PRTG Network Monitor
CloudFabrix supports PRTG Network Monitor API integration for fetching asset inventory, sensor data, metrics and historical alerts periodically or on demand. For API integration, it requires only read access permissions. Follow the below given steps to create service account for CloudFabrix AIOps solution with read-only permissions on PRTG Network Monitor tool.
1. Configure PRTG Network Monitor for API Access:
Step 1: Login into PRTG Network Monitor using an user account which has privileges to create new user account and assign read-only permissions.
Step 2: Click on Setup menu, under System Administration , click on User Accounts to create a service account with readonly access permissions for CloudFabrix AIOps solution.
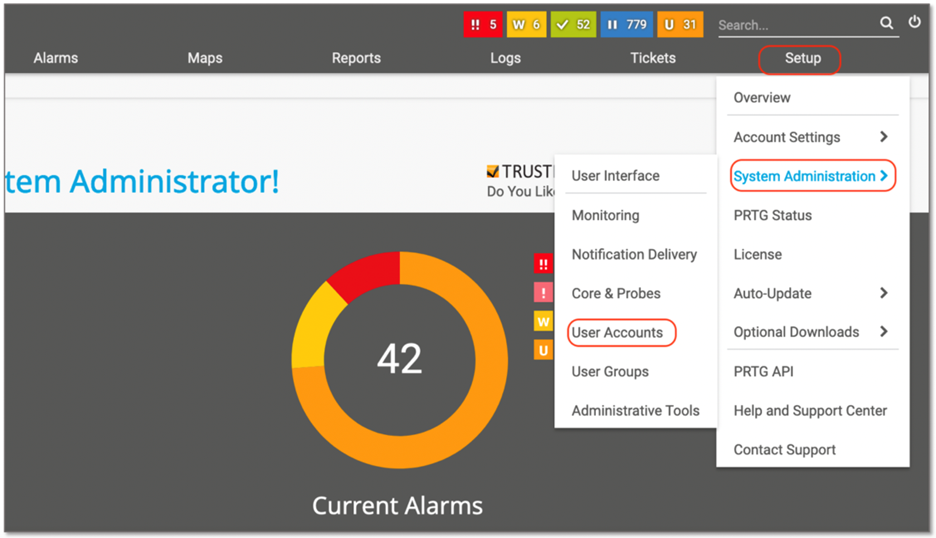
Step 3: Under User Accounts tab, click on + button & select Add User as shown in the below screen to create User Account
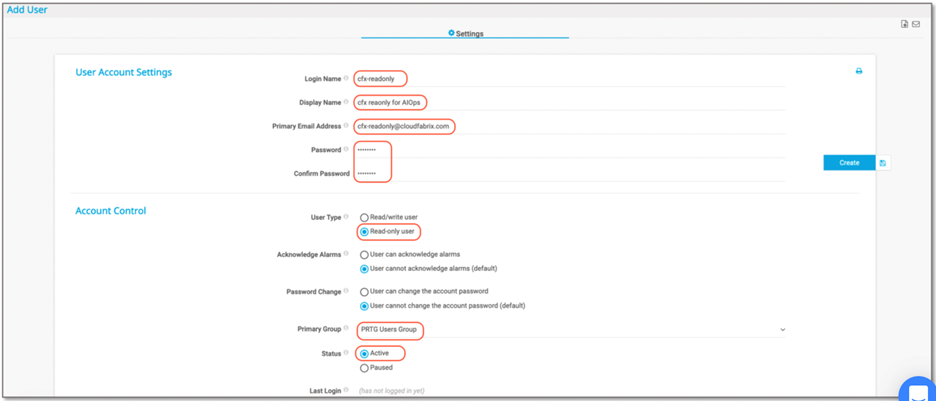
- Leave the default options (as shown in the below screen)
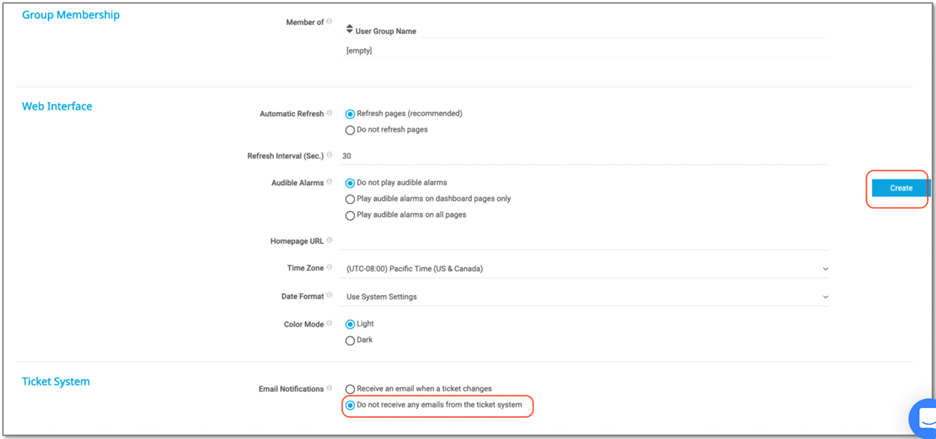
- Email Notifications: Select Do not receive any emails from the ticket system
- Click on Create button to create the user account with readonly permissions.
2. Adding PRTG Network Monitor as Datasource/Extension in RDA Studio:
Nagios XI or any other datasource/extension's configuration is configured in RDA's user interface. Login into RDA's user interface using a browser.
https://[rda-ip-address]:9998
Under Notebook, click on CFXDX Python 3 box
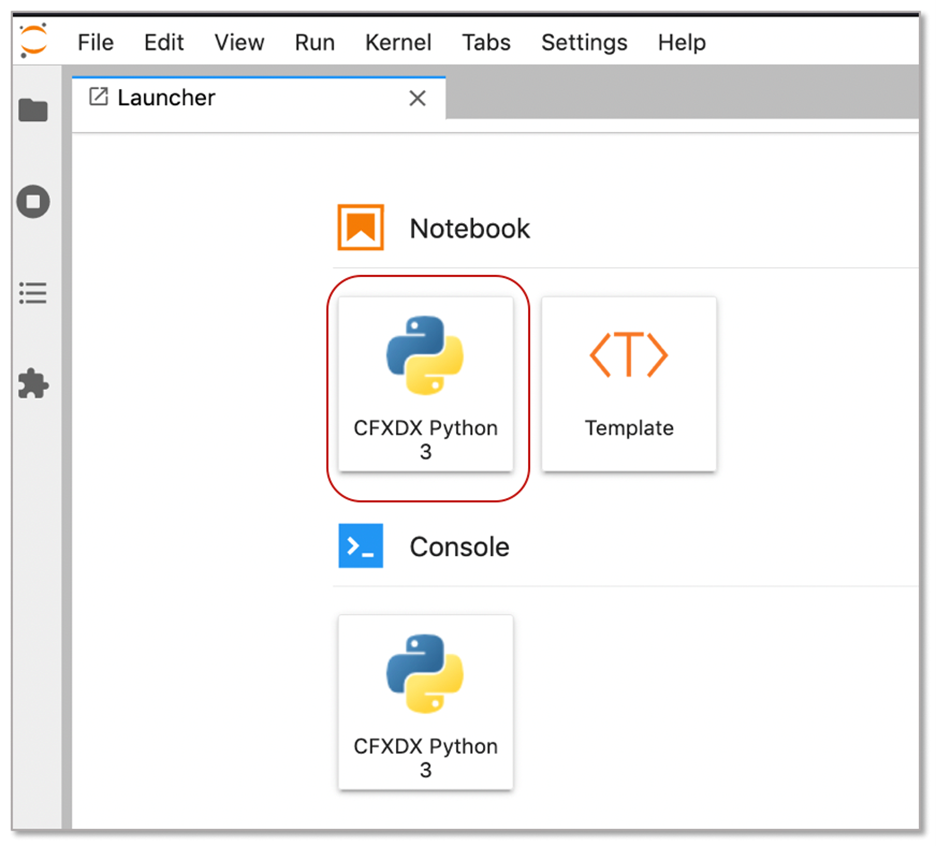
In the Notebook command box, type botadmin() and alt (or option) + Enter to open datasource administration menu.
Click on Add menu and under Type drop down, select prtg
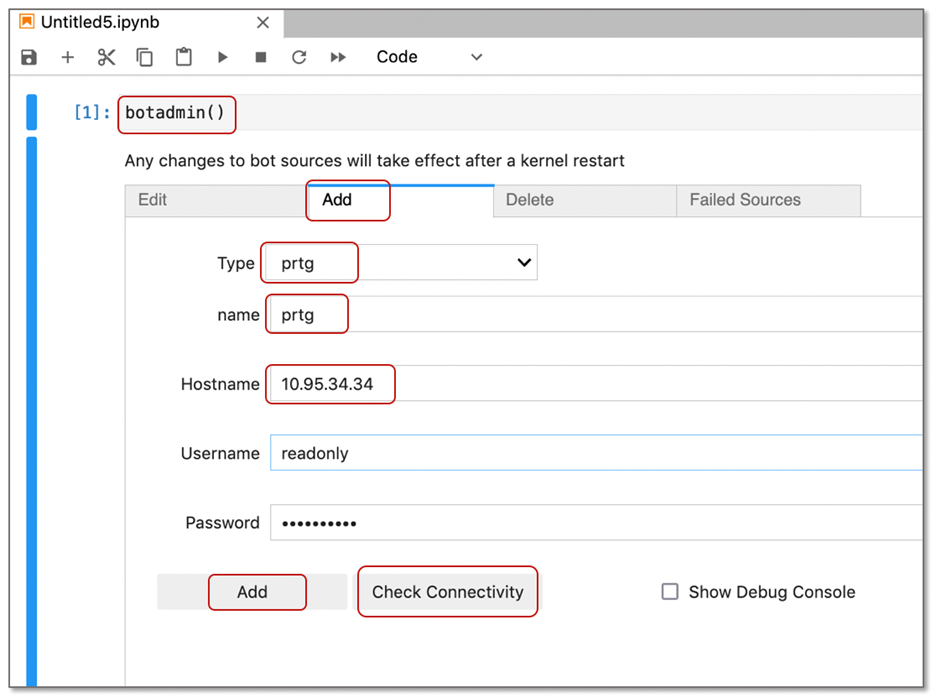
- Type: Datasource/Extension type. In this context, it is prtg
- name: Datasource/Extension label which should be unique within the RDA
- Hostname: VMware vCenter's IP Address or DNS name
- Username: Username that was created in PRTG with read-only permissions
- Password: User account's password
Click on Check Connectivity to verify the network access and credentials validity. Once it is validated, click on Add button to add the PRTG as a datasource.
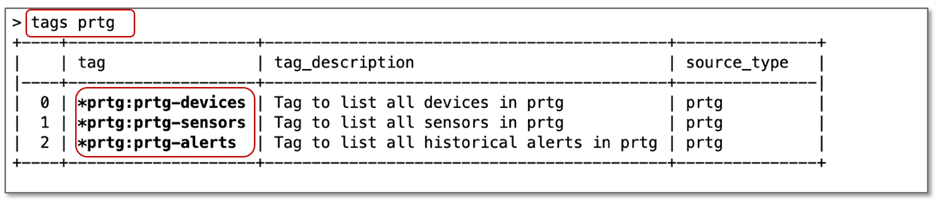
Below are available data bots for PRTG datasource.
3. PRTG exploration in RDA Studio:
Once PRTG integration details are configured in RDA as a datasource, it will be ready to connect to targe PRTG monitoring tool and explore the data for the analysis.
For the details on PRTG data collection bots, please refer CloudFabrix RDA Bot Documentation