Dynatrace
1. Introduction
Dynatrace is a software-intelligence monitoring platform that simplifies enterprise cloud complexity and accelerates digital transformation. Dynatrace all-in-one platform provides answers, not just data, about the performance of your applications, their underlying infrastructure, and the experience of your end users.
-
Infrastructure and Applications inventory
-
Infrastructure and Application dependency and relationship data
-
Historical alerts data
-
Performance Metrics list
-
Performance Metrics data
2. Prerequisites
The following are pre-requisites for creating Dynatrace as a Datasource. It is used for Alert Notifications from Dynatrace and collecting Host/Application Configuration and Metrics & Logs on-demand.
1) Dynatrace SaaS Account
2) An API Key (Created on Dynatrace SaaS portal)
3) One or more Hosts or Applications or Databases being monitored by Dynatrace
3. Enabling API access on Dynatrace SaaS portal:
Step 1: Login to https://[instsance-id].live.dynatrace.com using your credentials
Step 2: Go to Settings → Integration → Dynatrace API and click on Generate token
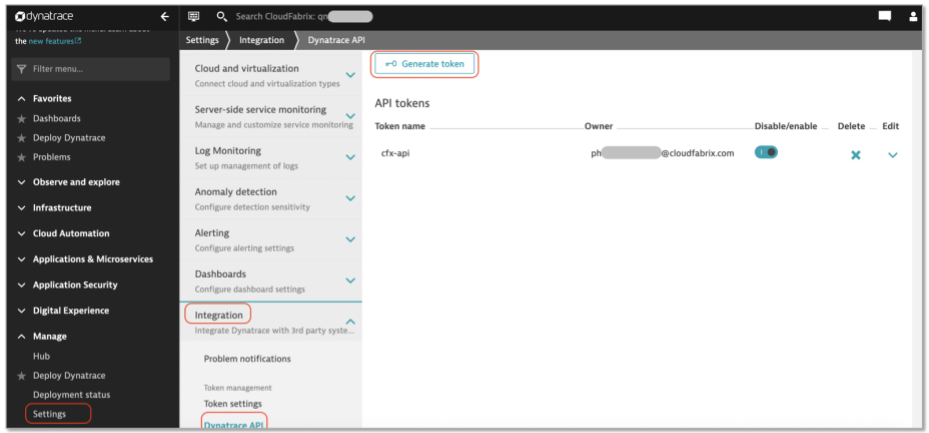
Step 3: Enter API name as cfx-rda-api or any other name and enable the below permissions for both API v1 & v2
API v1:
-
Access problem and event feed, metrics, and topology
-
Read log contents
-
Read synthetic monitors, location and nodes
-
Read configuration
-
Read audit logs
API v2:
-
Read metrics
-
Read entities
-
Read problems
-
Read events
-
Read ActiveGates
-
Read extensions
-
Read extension environment configuration
-
Read extension monitoring configuration
-
Read synthetic locations
-
Read settings
-
Read SLO
-
Read releases
-
Read audit logs
Step 4: Click on Generate
4. Adding Dynatrace as Datasource/Extension in RDA Studio:
Dynatrace or any other datasource/extension's configuration is configured in RDA's user interface. Login into RDA's user interface using a browser.
https://[rda-ip-address]:9998
Info
Default username and password of standalone **RDA Studio** is **rdademo** and **rdademo1234**
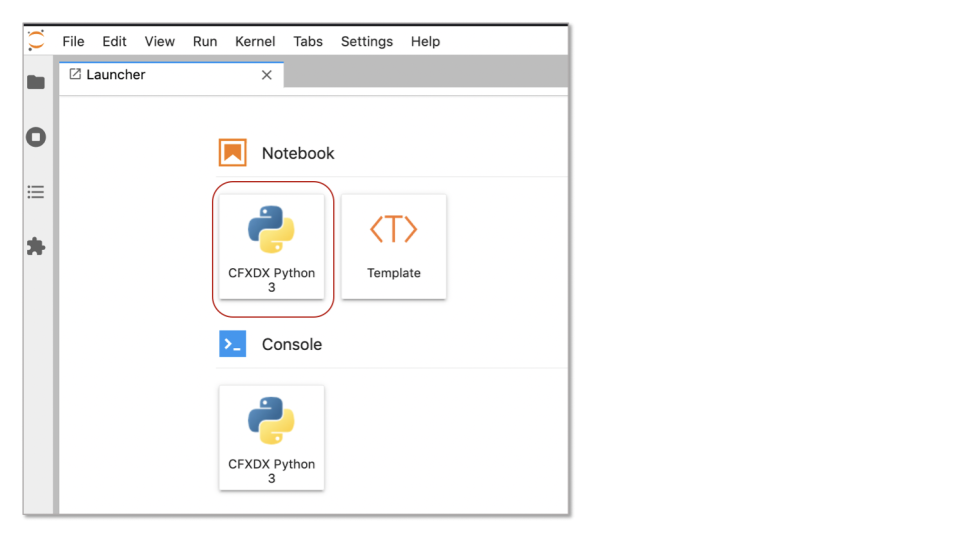
Under Notebook, click on CFXDX Python 3 box
In the Notebook command box, type botadmin() and alt (or option) + Enter to open datasource administration menu.
Click on Add menu and under Type drop down, select dynatrace
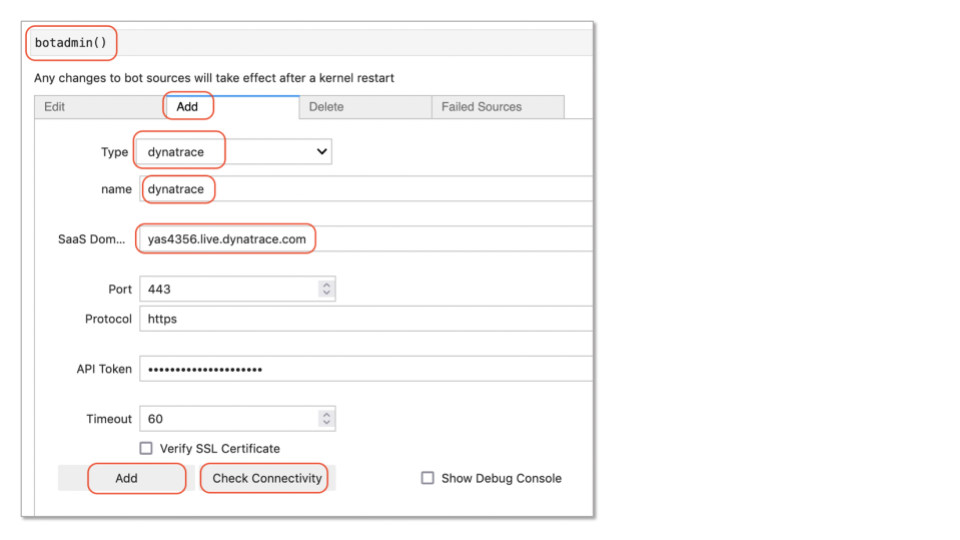
- Type: Datasource/Extension type. In this context, it is dynatrace
- name: Datasource/Extension label which should be unique within the RDA
- SaaS Domain URL: Dynatrace SaaS instance FQDN (Ex: yas4356.live.dynatrace.com)
- Port: 443
- Protocol: https
- API Token: API token generated in Dynatrace SaaS portal
Click on Check Connectivity to verify the network access and credentials validity. Once it is validated Click on Add button to add the Dynatrace as a datasource.
5. Adding Dynatrace data exploration in RDA Studio:
For the details on Dynatrace inventory data collection bots, refer CloudFabrix RDA Bot Documentation