RDA Client Command Line Interface
1. Installing RDA Command Line Tool
RDA Command Line Interface tool comes as a docker image to make it easy to run RDA commands on any Laptop, Desktop or in a Cloud VM.
To run this tool, following are required:
- Operating Systems: Linux or MacOS
- Docker installed on that system
- At least Python 3.0
STEP-1: Download the python script
Make the script an executable:
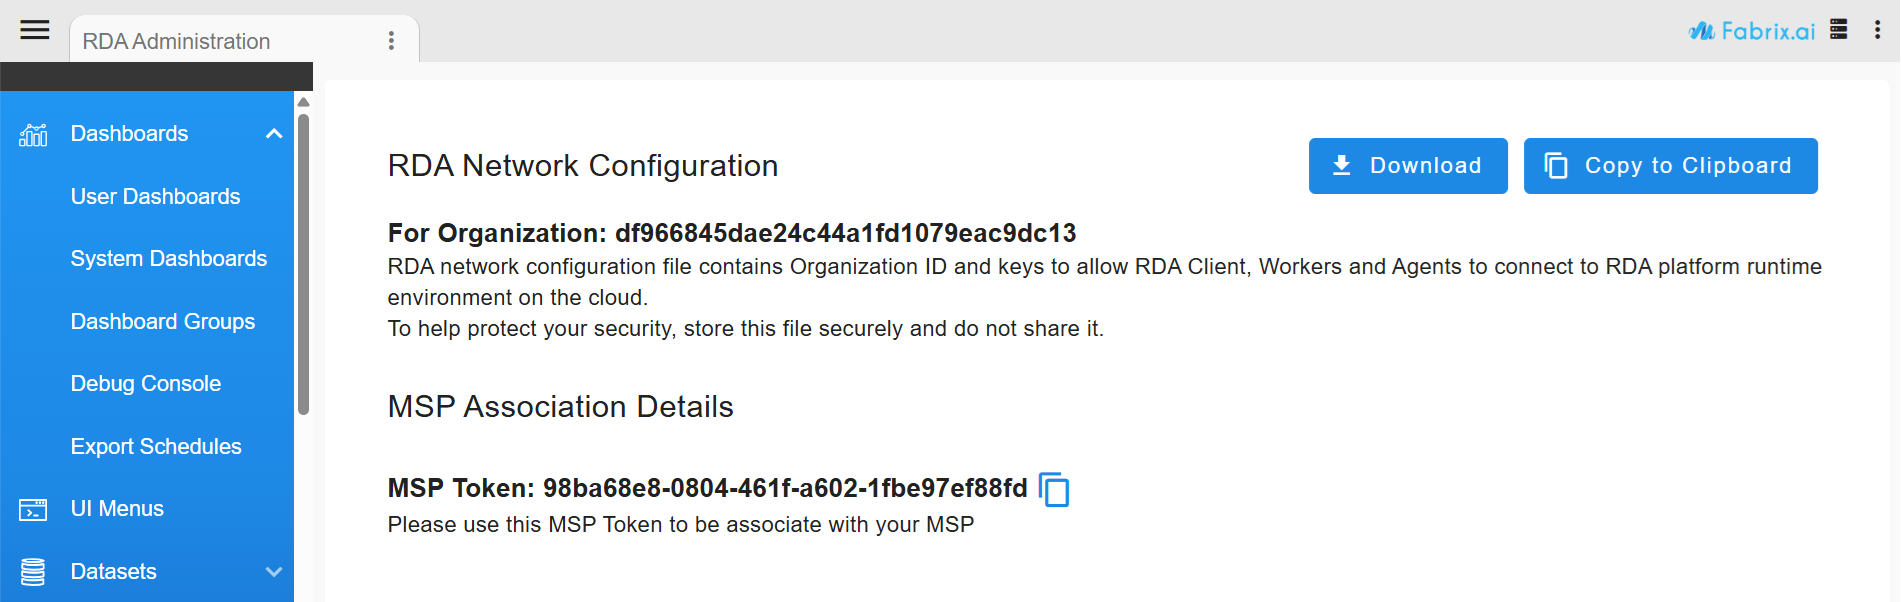
STEP-2: Download RDA network configuration
From your cfxCloud account, you can download a copy the RDA Network configuration.
Download the RDA Network configuration file and save it under $HOME/.rda/rda_network_config.json
STEP-3: Verify Script
Verify that rdac.py is working correctly by using one of the following commands:
Or
For very first time, above script will validate dependencies such OS, Python version and availability of Docker. If the validation is successful, it will download the docker container image for RDA CLI and run it.
Subsequently, if you want to update the docker container image to latest version, run following command:
2. RDA Commands: Cheat Sheet
This section lists few most commonly used RDA Commands.
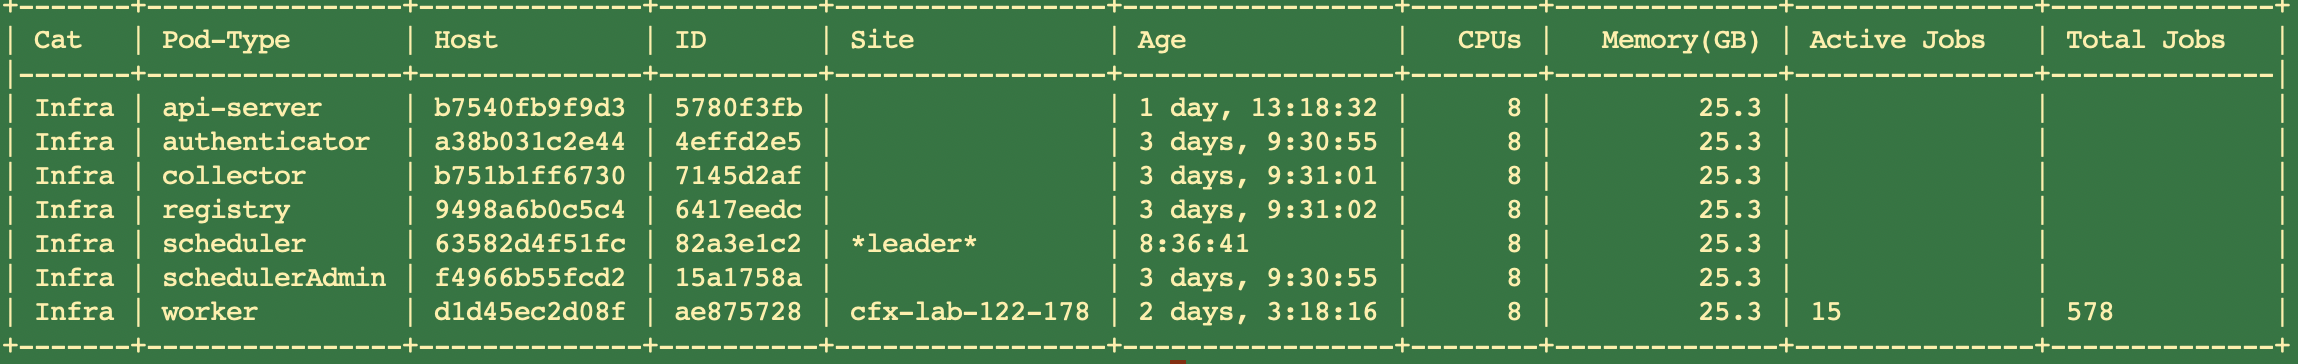
Listing RDA Platform Microservices
RDA Fabric is for each tenant has a set of microservices (pods) deployed as containers either using Kubernetes or as simple docker containers.
Following command lists all active microservices in your RDA Fabric:
Typical output for pods command would look like:
Most of RDA Commands support option --json which would print output in a JSON format instead of tabular format.
Example rdac pods JSON Output
Partial output of --json option:
{
    "now": "2022-05-20T02:16:31.054287",
    "started_at": "2022-05-17T22:44:13.602509",
    "pod_type": "worker",
    "pod_category": "rda_infra",
    "pod_id": "ae875728",
    "hostname": "d1d45ec2d08f",
    "proc_id": 1,
    "labels": {
        "tenant_name": "dev-1-unified",
        "rda_platform_version": "22.5.13.3",
        "rda_messenger_version": "22.5.15.1",
        "rda_pod_version": "22.5.17.1",
        "rda_license_valid": "no",
        "rda_license_not_expired": "no",
        "rda_license_expiration_date": ""
    },
    "build_tag": "daily",
    "requests": {
        "auto": "tenants.2dddab0e52544f4eb2de067057aaac31.worker.group.3571581d876b.auto",
        "direct": "tenants.2dddab0e52544f4eb2de067057aaac31.worker.group.3571581d876b.direct.ae875728"
    },
    "resources": {
        "cpu_count": 8,
        "cpu_load1": 2.24,
        "cpu_load5": 2.43,
        "cpu_load15": 2.52,
        "mem_total_gb": 25.3,
        "mem_available_gb": 9.7,
        "mem_percent": 61.7,
        "mem_used_gb": 15.01,
        "mem_free_gb": 2.93,
        "mem_active_gb": 11.49,
        "mem_inactive_gb": 7.64,
        "pod_usage_active_jobs": 15,
        "pod_usage_total_jobs": 578
    },
    "pod_leader": false,
    "objstore_info": {
        "host": "10.10.10.100:9000",
        "config_checksum": "8936434b"
    },
    "group": "cfx-lab-122-178",
    "group_id": "3571581d876b",
    "site_name": "cfx-lab-122-178",
    "site_id": "3571581d876b",
    "public_access": false,
    "capacity_filter": "cpu_load1 <= 7.0 and mem_percent < 98 and pod_usage_active_jobs < 20",
    "_local_time": 1653012991.0593688
}
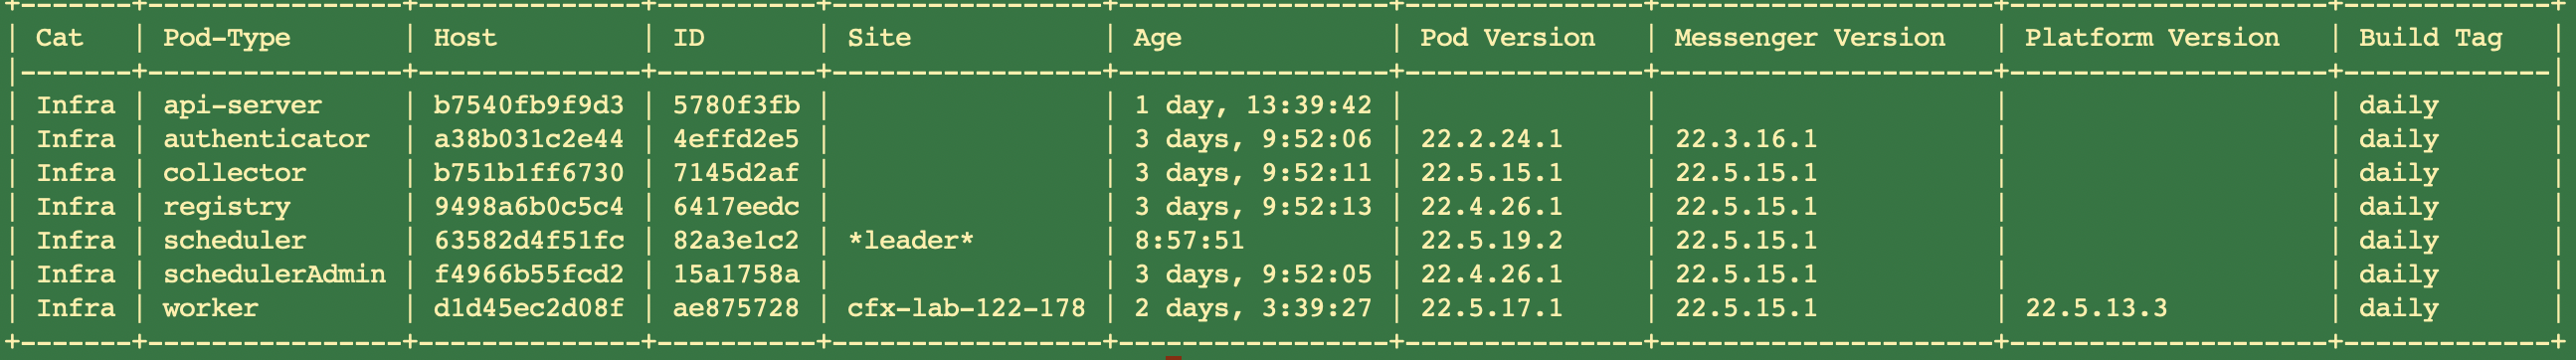
Listing RDA Platform Microservices with Versions
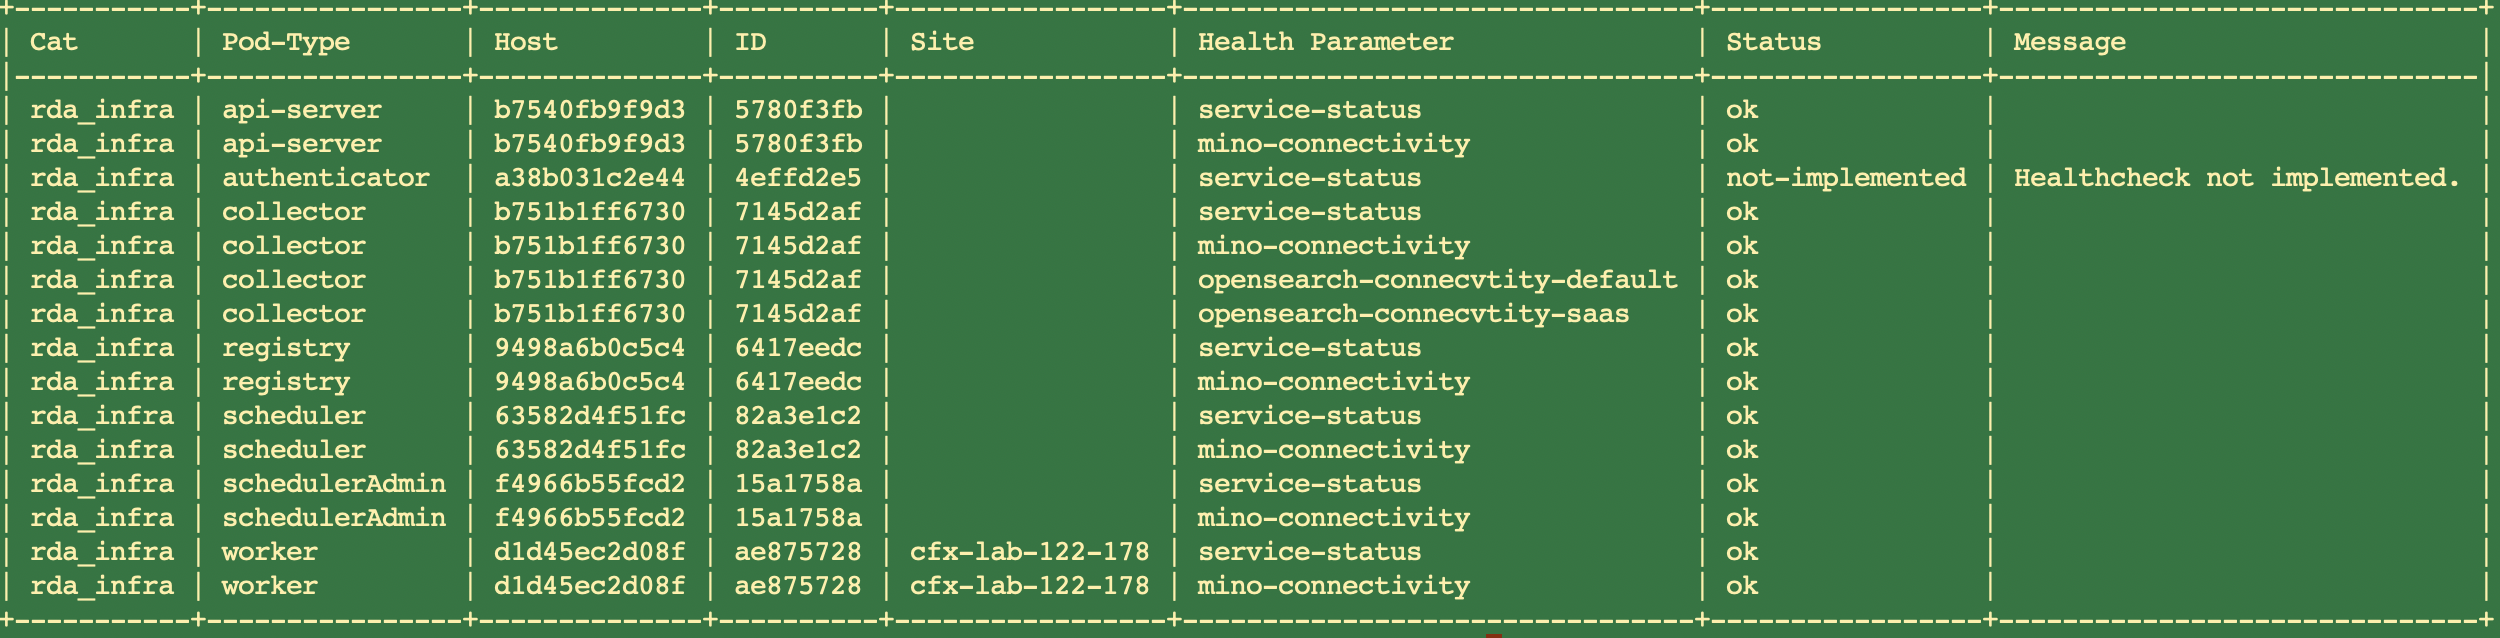
Performing a Health Check on RDA Microservices
Following command performs a health check on all microservices and returns status of each health parameter.
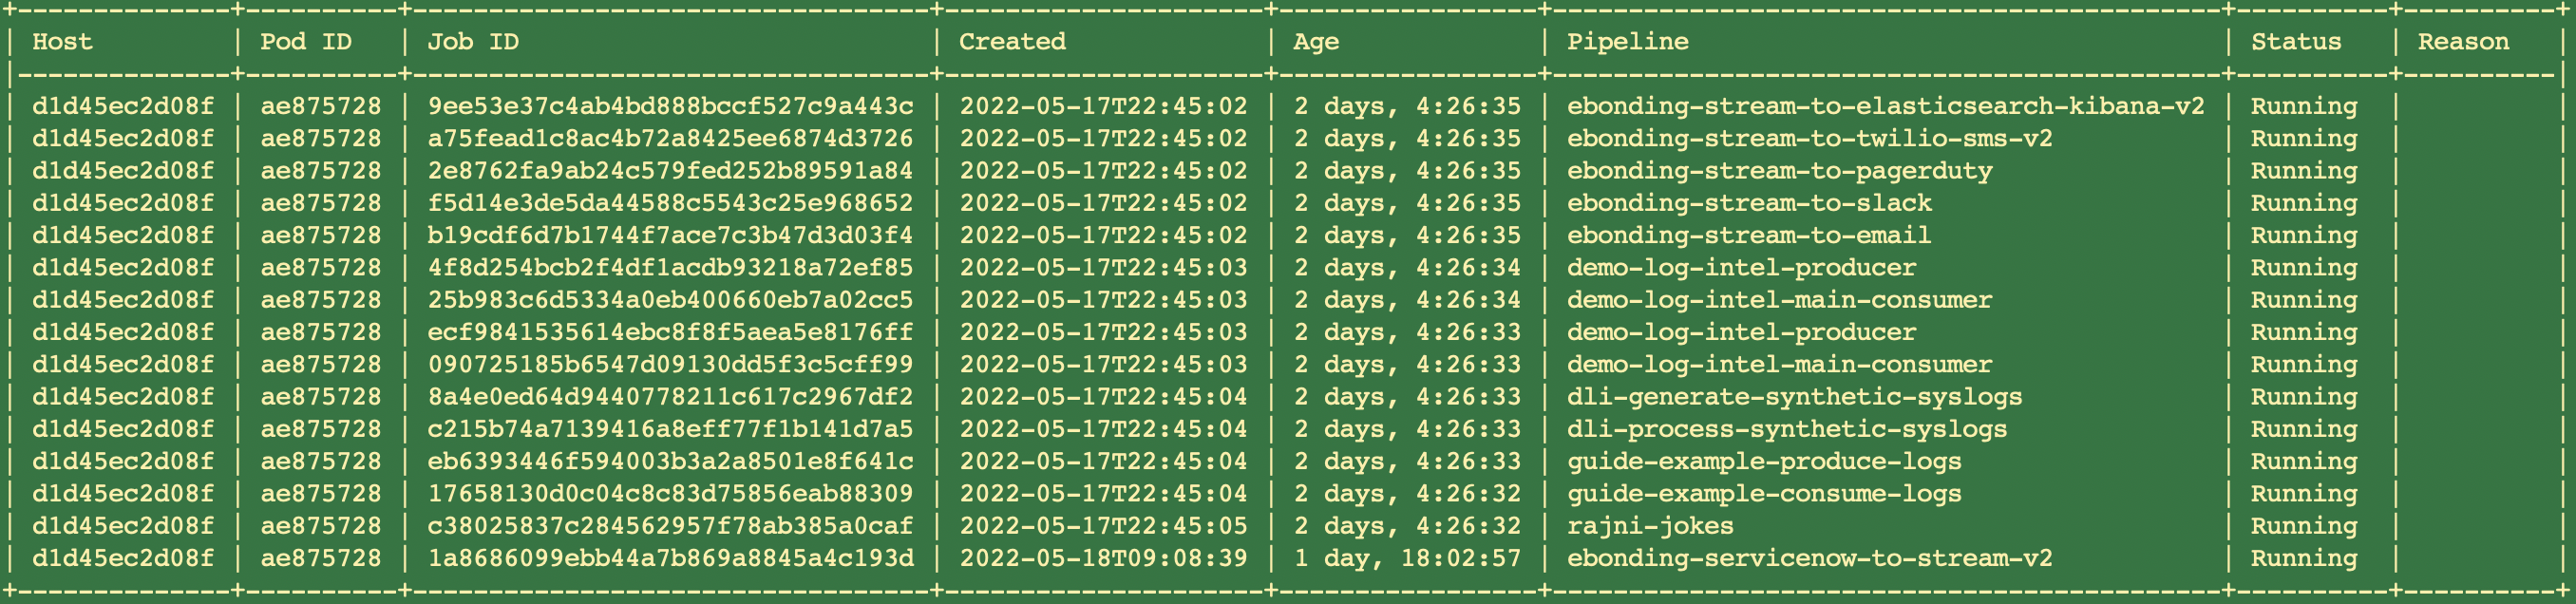
Listing all Running Pipeline Jobs
Following command lists all active jobs created using Portal, CLI, Scheduler or via Service Blueprints.
Evicting a Job
Following command can be used to evict a specific Job from RDA Worker. If the job was created by Scheduler or by a Service Blueprint, a new job may be re-created immediately after the job has been evicted.
This script attempts to evict the job with ID c38025837c284562957f78ab385a0caf
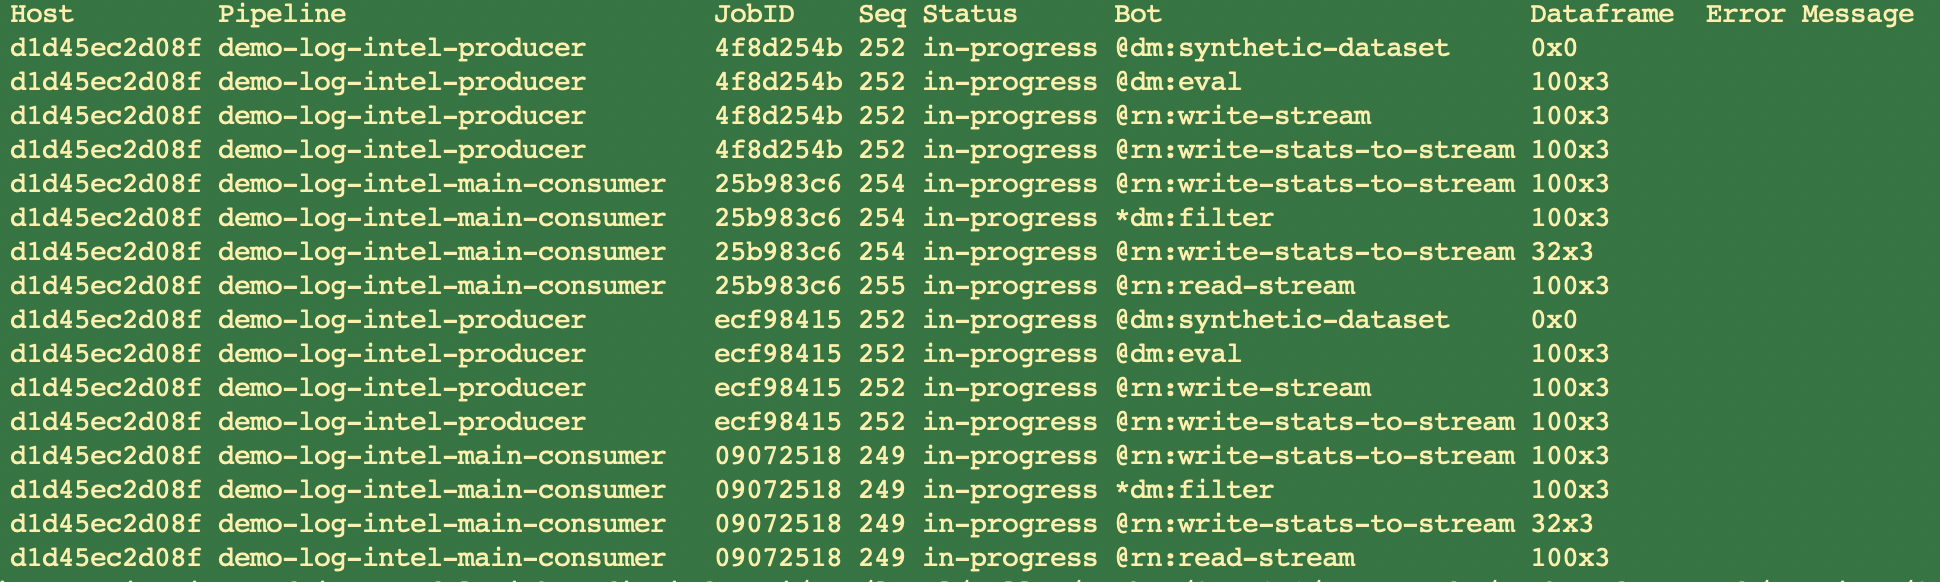
Observing Pipeline Execution Traces from CLI
Following command can be used watch (observe) all traces from all workers and all the pipelines that are getting executed anywhere in the RDA Fabric.
List all datasets currently saved in RDA Fabric
Adding a new dataset to RDA Fabric
Datasets can be added if the data is available as a local file on your system where rdac.py is available or if the data is available via URL. Supported formats are CSV, JSON, XLS, Parquet, ORC and many compresses formats for CSV.
To add a local file as a dataset:
Note
rdac.py mounts current directory as /home inside the docker container. You may also place the data in your home directory folder $HOME/rdac_data/ and access it as --file /data/mydata.csv
You may also add a dataset if the data is accessible via http or https URL.
3. List of All RDA CLI Sub Commands
| Sub Command | Description |
|---|---|
| agent-bots | List all bots registered by agents for the current tenant |
| agents | List all agents for the current tenant |
| alert-rules | Alert Rule management commands |
| bots-by-source | List bots available for given sources |
| check-credentials | Perform credential check for one or more sources on a worker pod |
| checksum | Compute checksums for pipeline contents locally for a given JSON file |
| content-to-object | Convert data from a column into objects |
| copy-to-objstore | Deploy files specified in a ZIP file to the Object Store |
| dashboard | User defined dashboard management commands |
| dataset | Dataset management commands |
| demo | Demo related commands |
| deployment | Service Blueprints (Deployments) management commands |
| event-gw-status | List status of all ingestion endpoints at all the event gateways |
| evict | Evict a job from a worker pod |
| file-ops | Perform various operations on local files |
| file-to-object | Convert files from a column into objects |
| fmt-template | Formatting Templates management commands |
| graphdb | Manage graph database operations |
| healthcheck | Perform healthcheck on each of the Pods |
| invoke-agent-bot | Invoke a bot published by an agent |
| jobs | List all jobs for the current tenant |
| library | Manage RDA libraries for worker containers |
| logarchive | Logarchive management commands |
| merge-logarchive-files | Merge multiple locally downloaded Log Archive (.gz) filles into a single CSV/Parquet file |
| object | RDA Object management commands |
| output | Get the output of a Job using jobid. |
| pack | Commands to manage RDA Packages |
| pipeline | Pipeline management commands |
| pods | List all pods for the current tenant |
| pod-controller | Control supervisord-managed pod processes |
| pod-logging | Commands to set and get logging configuration of pods |
| pod-logging-handler-set | To change log levels for any required pod |
| project | Project management commands. Projects can be used to link different tenants / projects from this RDA Fabric or a remote RDA Fabric |
| pstream | Add a new Persistent stream |
| purge-outputs | Purge outputs of completed jobs |
| read-stream | Read messages from an RDA stream |
| run | Run a pipeline on a worker pod |
| run-get-output | Run a pipeline on a worker, wait for the completion, get the final output |
| schedule-add | Add a new schedule for pipeline execution |
| schedule-delete | Delete an existing schedule |
| schedule-edit | Edit an existing schedule |
| schedule-info | Get details of a schedule |
| schedule-list | List all schedules |
| schedule-update-status | Update status of an existing schedule |
| schema | Dataset Model Schema management commands |
| secret | Credentials (Secrets) management commands |
| set-pod-log-level | Update the logging level for a given RDA Pod |
| site-profile | Site Profile management commands |
| site-summary | Show summary by Site and Overall |
| stack | Application Dependency Mapping (Stack) management commands |
| staging-area | Staging Area based data ingestion management commands |
| subscription | Show current CloudFabrix RDA subscription details |
| synthetics | Data synthesizing management commands |
| verify-pipeline | Verify the pipeline on a worker pod |
| viz | Visualize data from a file within the console (terminal) |
| watch | Commands to watch various streams such sas trace, logs and change notifications by microservices |
| worker-obj-info | List all worker pods with their current Object Store configuration |
| write-stream | Write data to the specified stream |
Sub Command: agent-bots
Description: List all bots registered by agents for the current tenant
usage: rdac [-h] [--json] [--type AGENT_TYPE] [--group AGENT_GROUP]

optional arguments:
  -h, --help           show this help message and exit
  --json               Print detailed information in JSON format instead of
                       tabular format
  --type AGENT_TYPE    Show only the agents that match the specified agent
                       type
  --group AGENT_GROUP  Show only the agents that match the specified agent
                       group
- Following is the syntax for agent-bots
[
    {
        "name": "get-status",
        "description": "List all endpoints configured at this gateway and current status",
        "query-type": "api-endpoint",
        "mode": "source-any",
        "model": {},
        "agent_type": "rda-event-gateway",
        "site_name": "event_gateway_site01",
        "pod_id": "250951da"
    }
]
Sub Command: agents
Description: List all agents for the current tenant
Usage: agents  [-h] [--json] [--type AGENT_TYPE] [--group AGENT_GROUP]
            [--site SITE_NAME]

optional arguments:
  -h, --help           show this help message and exit
  --json               Print detailed information in JSON format instead of
                       tabular format
  --type AGENT_TYPE    Show only the agents that match the specified agent
                       type
  --group AGENT_GROUP  Deprecated. Use --site. Show only the agents that match
                       the specified site
  --site SITE_NAME     Show only the agents that match the specified site
+-------------------+----------------+----------+----------------------+-------------------+--------+--------------+
| Agent-Type        | Host           | ID       | Site                 | Age               |   CPUs |   Memory(GB) |
|-------------------+----------------+----------+----------------------+-------------------+--------+--------------|
| rda-event-gateway | saaswrk72.qa.e | 250951da | event_gateway_site01 | 28 days, 21:54:20 |      4 |        31.33 |
| agent-ml          | 5339ca9ca765   | c4d7b94e | mlagent              | 23:04:10          |      4 |        31.33 |
| agent-irm         | aa932951e71e   | 0fbc78ec | irmagent             | 23:03:42          |      4 |        31.33 |
+-------------------+----------------+----------+----------------------+-------------------+--------+--------------+
Sub Command: alert-rules
Following are the valid Sub-Commands for the alert-rules
Sub Commands |
Description |
|---|---|
| add | Add or update alert ruleset |
| get | Get YAML data for an alert ruleset |
| delete | Delete an alert ruleset |
| list | List all alert rulesets. |
Following are valid sub-commands for alert-rules:
  add                       Add or update alert ruleset
  get                       Get YAML data for an alert ruleset
  delete                    Delete an alert ruleset
  list                      List all alert rulesets.
Sub Command: add>**
Description: Add or update alert ruleset
Usage: alert-rules-add  [-h] --file INPUT_FILE [--overwrite]

optional arguments:
  -h, --help         show this help message and exit
  --file INPUT_FILE  YAML file containing alert ruleset definition
  --overwrite        Overwrite even if a ruleset already exists with a name.
- Following is the syntax for alert-rules add
cat > alertrulestest1.yml << 'EOF'
name: alertruletest
description: syslog from filebeat
realtime-alerts:
    -   name: filebeat_syslog_msgs
        description: VPX Finish task msgs
        groupBy: host_name
        condition: severity = 'INFO'
        severity: CRITICAL
        suppress-for-minutes: 5
saved_time: '2022-02-19T22:34:10.888947'
EOF

rdac alert-rules add --file alertrulestest1.yml
Sub Command: delete
Description: Delete an alert ruleset
Usage: alert-rules-delete  [-h] --name RULESET_NAME

optional arguments:
  -h, --help           show this help message and exit
  --name RULESET_NAME  Name of the alert ruleset to delete
- Following is the syntax for alert-rules delete
Sub Command: get
Description: Get YAML data for an alert ruleset
Usage: alert-rules-get  [-h] --name RULESET_NAME

optional arguments:
  -h, --help           show this help message and exit
  --name RULESET_NAME  Name of the alert ruleset to display
- Following is the syntax for alert-rules get
description: Alert_Rules
name: ATest_ZRules
aggregate-alerts:
- rule_a
- rule_b
realtime-alerts:
- rule_1
- rule_2
saved_time: '2022-12-20T05:16:41.716023'
Sub Command: list
Description: List all alert rulesets.
Usage: alert-rules-list  [-h] [--json]

optional arguments:
  -h, --help  show this help message and exit
  --json      Print detailed information in JSON format instead of tabular
              format
- Following is the syntax for alert-rules list
    name              description           saved_time                    num_realtime_alert_rules    num_aggr_alert_rules
--  ----------------  --------------------  --------------------------  --------------------------  ----------------------
 0  alertruletestnew  syslog from filebeat  2023-01-03T05:01:55.361186                           1                       0

Cleaning up socket for process: 1. Socket file: /tmp/rdf_log_socket_57602b71-8ea5-49c5-acbd-54c9908a0680
Exiting out of LogRecordSocketReceiver. pid: 1. Socket file: /tmp/rdf_log_socket_57602b71-8ea5-49c5-acbd-54c9908a0680
Sub Command: bot-package
Following are the valid Sub-Commands for the bot-package
Sub Commands |
Description |
|---|---|
| add | Add or update Bot Package |
| get | Get meta data for a Bot Package |
| delete | Delete a Bot Package |
| list | List all Bot Packages |
| build | Build the specified bot package |
| ut | Run Unit Tests |
| generate | Generate the specified bot package |
| list-runtimes | List available Bot Package runtime environments on each worker |
Following are valid sub-commands for bot-package:
  add                       Add or update Bot Package
  get                       Get meta data for a Bot Package
  delete                    Delete a Bot Package
  list                      List all Bot Packages
  build                     Build the specified bot package
  ut                        Run Unit Tests
  generate                  Generate the specified bot package
  list-runtimes             List available Bot Package runtime environments on each worker
Sub Command: list
Description: List all Bot Packages
usage: bot-package [-h] [--json]

optional arguments:
  -h, --help  show this help message and exit
  --json      Print detailed information in JSON format instead of tabular
              format
- Following is the syntax for bot-package list
Name                       Version    Description                              Has Dist    Publisher    Saved Time
-------------------------  ---------  ---------------------------------------  ----------  -----------  --------------------------
botpkg_demo_proactivecase  22.11.9    ProctiveCase API for ServiceNow Tickets  Yes         CloudFabrix  2022-11-14T21:16:30.201550
Sub Command: get
Description: Get meta data for a Bot Package
optional arguments:
  -h, --help           show this help message and exit
  --name PACKAGE_NAME  Name of the Bot Package
extension:
  namespace: demo
  type: proactivecase
  version: 22.11.9
  description: ProctiveCase API for ServiceNow Tickets
  default_name: proactivecase
  publisher: CloudFabrix
  support_email: mohammed.rahman@cloudfabrix.com
  config_template:
    hostname: null
    port: 443
    uri_suffix: internal/proactiveCaseAPI/v1.1
    client_id: null
    secret: null
    $secure:
    - secret
    $mandatory:
    - hostname
    - client_id
    - secret
    $labels:
      hostname: Host
      port: Port
      client_id: Client ID
      secret: Secret Value
  implementation:
    code: proactivecase.ProactiveCase
bots:
- name: get-ticket
  description: Get ServiceNow Ticket
  bot_type: source
  model_type: api
  model_parameters:
  - name: ticket_id
    description: comma separated ticket IDs
    type: text
    mandatory: true
  - name: source
    description: Source
    type: text
    mandatory: true
Sub Command: generate
Description: Generate the specified bot package
usage: bot-package [-h] --namespace NAMESPACE --name NAME [--version VERSION]
                   [--bots NUM_OF_BOTS] --output_dir OUTPUT_DIR

optional arguments:
  -h, --help            show this help message and exit
  --namespace NAMESPACE
                        Namespace for Bot extension
  --name NAME           Name of the bot extension package
  --version VERSION     Version for Bot extension
  --bots NUM_OF_BOTS    Number of Bots to be added to the package
  --output_dir OUTPUT_DIR
                        Output directory for creating bot package
- Following is the syntax for bot-package generate
rdac bot-package generate --namespace demo --name proactivecasenew --version 23.01.03 --bot 2 --output_dir new11
Configure : Custom Bot 1

Name*: get-ticket
Bot Type*: source
Number of bot input parameters*: 2

Configure : Bot input parameter 1

Name*: ticket_id
Type: text
Is mandatory[yes/no]*: yes

Configure : Bot input parameter 2

Name*: source
Type: text
Is mandatory[yes/no]*: yes

Configure : Custom Bot 2

Name*: get-ticket1
Bot Type*: source
Number of bot input parameters*: 1

Configure : Bot input parameter 2 1

Name*: ticket_id1
Type: text
Is mandatory[yes/no]*: yes
Generated: new11/bots.yml
Sub Command: list-runtimes
Description: List available Bot Package runtime environments on each worker
optional arguments:
  -h, --help  show this help message and exit
  --json      Print detailed information in JSON format instead of tabular
              format
- Following is the syntax for bot-package list-runtimes
2022-12-22:09:44:17 [1] INFO nats_client Saving NATS certificate to file: /tmp/nats_cert_custom_461dedd908ef2d75e509377dfe35be02_1.pem
+--------------+----------+-------------+-------------+-------------+--------------+----------+
| Host         | Pod ID   | Site        | Python3.7   | Python3.9   | Python3.10   | Java11   |
|--------------+----------+-------------+-------------+-------------+--------------+----------|
| 05969789d903 | b6bb8486 | rda-site-01 | yes         |             |              |          |
+--------------+----------+-------------+-------------+-------------+--------------+----------+
Sub Command: bots-by-source
Description: List bots available for given sources
Usage: bots-by-source  [-h] [--sources SOURCES] [--group WORKER_GROUP]
            [--site WORKER_SITE] [--lfilter LABEL_FILTER]
            [--rfilter RESOURCE_FILTER] [--maxwait MAX_WAIT] [--json]

optional arguments:
  -h, --help            show this help message and exit
  --sources SOURCES     Comma separated list of sources to find bots (in
                        addition to built-in sources)
  --group WORKER_GROUP  Deprecated. Use --site option. Specify a worker site
                        name. If not specified, will use any available worker.
  --site WORKER_SITE    Specify a worker site name. If not specified, will use
                        any available worker.
  --lfilter LABEL_FILTER
                        CFXQL style query to narrow down workers using their
                        labels
  --rfilter RESOURCE_FILTER
                        CFXQL style query to narrow down workers using their
                        resources
  --maxwait MAX_WAIT    Maximum wait time (seconds) for credential check to
                        complete.
  --json                Print detailed information in JSON format instead of
                        tabular format
- Following is the syntax for bots-by-source
{
  "status": "started",
  "reason": "",
  "results": [],
  "now": "2023-01-03T06:20:38.129086",
  "status-subject": "tenants.545590daa4ba44a3b32cb3b33f69df13.worker.group.f4a56ba6388c.direct.2d30eab7",
  "jobid": "b244f76f663a4033964301e7c3916ddc"
}
Completed:
Bot                                     Type                  Description                                                                                                                                                                                                                                                                Source
--------------------------------------  --------------------  -------------------------------------------------------------------------------------------------------------------------------------------------------------------------------------------------------------------------------------------------------------------------  --------
@c:new-block                            api-endpoint          Start a new block within the pipeline                                                                                                                                                                                                                                      c
@c:simple-loop                          api-endpoint          Start a simple looping block using 'loop_var' as list of values                                                                                                                                                                                                            c
@c:data-loop                            api-endpoint          Start a looping block using 'dataset' name of the saved dataset, and unique values from 'columns'                                                                                                                                                                          c
@c:count-loop                           api-endpoint          Start a looping block that counts from 'start' to 'end' with 'increment' numerical values                                                                                                                                                                                  c
@c:timed-loop                           api-endpoint          Start a looping block that waits 'interval' seconds between each iteration
Sub Command: check-credentials
Description: Perform credential check for one or more sources on a worker pod
Usage: check-credentials  [-h] --config CONFIG [--group WORKER_GROUP] [--site WORKER_SITE]
            [--maxwait MAX_WAIT]

optional arguments:
  -h, --help            show this help message and exit
  --config CONFIG       File containing pipeline contents or configuration
  --group WORKER_GROUP  Deprecated. Use --site. Specify a worker site name. If
                        not specified, will use any available worker.
  --site WORKER_SITE    Specify a worker Site name. If not specified, will use
                        any available worker.
  --maxwait MAX_WAIT    Maximum wait time (seconds) for credential check to
                        complete.
- Following is the syntax for check-credentials
Initiating Credential check
{
  "status": "started",
  "reason": "",
  "results": [],
  "now": "2021-07-28T02:12:46.577687",
  "status-subject": "tenants.2dddab0e52544f4eb2de067057aaac31.worker.group.c640b839efec.direct.255941bb",
  "jobid": "328ea2d5f0454ed29b64ccdb287c5626"
}
{
  "jobid": "328ea2d5f0454ed29b64ccdb287c5626",
  "status-subject": "tenants.2dddab0e52544f4eb2de067057aaac31.worker.group.c640b839efec.direct.255941bb"
}
Running:
Running:
Running:
Completed:
+---------------+---------------+----------+----------+-----------------+
| Source Name   | Source Type   | Status   | Reason   |   Duration (ms) |
|---------------+---------------+----------+----------+-----------------|
| aws-dev       | aws           | OK       |          |         1473.79 |
| aws-prod      | aws           | OK       |          |         1404.15 |
+---------------+---------------+----------+----------+-----------------+
Sub Command: checksum
Description: Compute checksums for pipeline contents locally for a given JSON file
Usage: checksum  [-h] --pipeline PIPELINE

optional arguments:
  -h, --help           show this help message and exit
  --pipeline PIPELINE  File containing pipeline information in JSON format
Sub Command: content-to-object
Description: Convert data from a column into objects
Usage: content-to-object  [-h] --inpcol INPUT_CONTENT_COLUMN --outcol OUTPUT_COLUMN --file
            INPUT_FILE --outfolder OUTPUT_FOLDER --outfile OUTPUT_FILE

optional arguments:
  -h, --help            show this help message and exit
  --inpcol INPUT_CONTENT_COLUMN
                        Name of the column in input that contains the data
  --outcol OUTPUT_COLUMN
                        Column name where object names will be inserted
  --file INPUT_FILE     Input csv filename
  --outfolder OUTPUT_FOLDER
                        Folder name where objects will be stored
  --outfile OUTPUT_FILE
                        Name of output csv file that has object location
                        stored
Sub Command: copy-to-objstore
Description: Deploy files specified in a ZIP file to the Object Store
Usage: copy-to-objstore  [-h] --file ZIP_FILENAME [--verify] [--force]

optional arguments:
  -h, --help           show this help message and exit
  --file ZIP_FILENAME  ZIP filename (or URL) containing bucket/object entries.
                       If bucket name is 'default', this tool will use the
                       target bucket as specified in configuration.
  --verify             Do not upload files, only verify if the objects in the
                       ZIP file exists on the target object store
  --force              Upload the files even if they exist on the target
                       system with same size
Sub Command: dashboard
Following are the valid Sub-Commands for the dashboard
Sub Commands |
Description |
|---|---|
| add | Add or update dashboard |
| get | Get YAML data for a dashboard |
| list | List all dashboards |
| convert | Convert all dashboards from YAML to JSON |
| delete | Delete a dashboard |
| enable | Change the status of a dashboard to 'enabled' |
| disable | Change the status of a dashboard to 'disabled' |
| verify | Verify the dashboard and any pages inside it for PStreams and columns |
| to-app | Convert a tabbed or sectioned dashboard into multi-paged app |
| live-edit | Supports live edit of dashboards using local editor |
Following are valid sub-commands for dashboard:
  add                       Add or update dashboard
  get                       Get YAML data for a dashboard
  list                      List all dashboards
  convert                   Convert all dashboards from YAML to JSON
  delete                    Delete a dashboard
  enable                    Change the status of a dashboard to 'enabled'
  disable                   Change the status of a dashboard to 'disabled'
  verify                    Verify the dashboard and any pages inside it for PStreams and columns
  to-app                    Convert a tabbed or sectioned dashboard into multi-paged app
  live-edit                 Supports live edit of dashboards using local editor
add
Description: Add or update dashboard
optional arguments:
  -h, --help         show this help message and exit
  --file INPUT_FILE  YAML file containing dashboard definition
  --overwrite        Overwrite even if a dashboard already exists with the
                     specified name.
Note
Before running the add cmd ,create a yaml file containing dashboard definition
- Following is the syntax for dashboard add
2023-01-04:10:24:09 [1] INFO nats_client Creating new SharedPool ...
2023-01-04:10:24:09 [1] INFO nats_client Initiallzing PubMgr for pid=1
2023-01-04:10:24:09 [1] INFO nats_client Saving NATS certificate to file: /tmp/nats_cert_custom_461dedd908ef2d75e509377dfe35be02_1.pem
Added dashboard Appdynamics cpu metrics analysis-shaded chartnew
Sub Command: get
Description: Get YAML data for a dashboard
usage: dashboard [-h] --name DASHBOARD_NAME

optional arguments:
  -h, --help            show this help message and exit
  --name DASHBOARD_NAME
                        Name of the dashboard
- Following is the syntax for dashboard get
label: Appdynamics CPU metrics
description: Shaded chart for Appdynamics metrics
enabled: true
dashboard_style: tabbed
dashboard_filters:
  time_filter: true
  columns_filter: []
  group_filters: []
debug: true
dashboard_sections:
- title: Appdynamics_cpu_metrics
  show_filter: true
  widgets:
  - widget_type: shaded_chart
    title: Appdynamics-cpumetrics
    stream: Appdynamics_cpu_metrics
    ts_column: timestamp
    baseline_column: baseline
    anomalies_column: anomalies
    predicted_column: predicted
    upperBound_column: upperBound
    lowerBound_column: lowerBound
    duration_hours: 5000
    synchronized-group: 0
    markers-def:
    - message: Now
      color: '#E53935'
      timestamp: 1647814186
    - message: Tomorrow
      color: '#E53935'
      timestamp: 1648937386
    - message: Current
      color: '#E53935'
      timestamp: 1658355595
    show-markers: true
    downsample: true
    downsample-to-percent: 10
    downsample-limit-rows: 500
    widget_id: b0d45ad1
saved_time: '2022-12-14T06:07:11.835323'
Sub Command: list
Description: List all dashboards
optional arguments:
  -h, --help  show this help message and exit
  --json      Print detailed information in JSON format instead of tabular
              format
- Following is the syntax for dashboard list
    name                                                  dashboard_type    label                                                      description                                                                                                                                enabled    saved_time
---  ----------------------------------------------------  ----------------  ---------------------------------------------------------  -----------------------------------------------------------------------------------------------------------------------------------------  ---------  --------------------------
  0  rda-mgmt-page-alert-rules                             dashboard         Alert Rules                                                Alert Rules Page                                                                                                                           True       2022-10-06T13:43:06.707246
  1  rda-mgmt-page-credentials                             dashboard         Credentials                                                Credentials Management Page                                                                                                                True       2022-10-06T13:43:07.346093
  2  Test_IFRAME                                           dashboard         IFRAME Test                                                ACME Platform Sanity Dash                                                                                                                  False      2022-10-06T13:43:07.367278
  3  olb-observability-data_page_Incidents                 dashboard         OLB L2/L3 Dashboard, Page: Incidents                       Online Banking App Observability Data for L2/L3 Users, Page: Incidents                                                                     False      2022-11-18T09:24:50.445315
  4  olb-experience-desk_page_KPIs                         template          Experience Desk Dashboard, Page: KPIs                      Equipped with Events, Alerts and Incidents Information to Maximize Customer Experience and Satisfaction, Page: KPIs                        False      2022-10-06T13:43:07.443675
  5  ACME_Test_Preview_App                                 template          Test Case Preview                                          Dashboard to preview commits and logs for a test case                                                                                      False      2022-10-06T13:43:07.509264
  6  l1-service-health                                     template          Service Health - L1 Users                                  L1 Service Health                                                                                                                          False      2022-12-21T05:19:02.332379
  7  rda-integrations-app                                  app               RDA Integrations                                           Robotic Data Automation Integrations                                                                                                       True       2022-10-06T13:43:07.622712
  8  l2-l3-dashboard                                       app               L2/L3 Dashboard                                            Dashboard L2/L3 Users                                                                                                                      True       2022-12-21T05:19:02.396260
  9  rda-dashboard-errors                                  dashboard         Dashboard Errors                                           Query errors in RDA Dashboard widgets                                                                                                      True       2022-10-07T01:49:51.552796
 10  Appdynamics cpu metrics analysis-shaded chart         dashboard         Appdynamics CPU metrics                                    Shaded chart for Appdynamics metrics                                                                                                       True       2022-12-14T06:07:11.835323
Sub Command: convert
Description : Convert all dashboards from YAML to JSON
- Following is the syntax for dashboard convert
Migrating to JSON: rda-mgmt-page-alert-rules
2023-01-04:05:30:41 [1] INFO nats_client Creating new SharedPool ...
2023-01-04:05:30:41 [1] INFO nats_client Initiallzing PubMgr for pid=1
2023-01-04:05:30:41 [1] INFO nats_client Saving NATS certificate to file: /tmp/nats_cert_custom_461dedd908ef2d75e509377dfe35be02_1.pem
Migrating to JSON: rda-mgmt-page-credentials
Migrating to JSON: Test_IFRAME
Migrating to JSON: olb-observability-data_page_Incidents
Migrating to JSON: olb-experience-desk_page_KPIs
Migrating to JSON: ACME_Test_Preview_App
Migrating to JSON: l1-service-health
Migrating to JSON: rda-integrations-app
Migrating to JSON: l2-l3-dashboard
Migrating to JSON: rda-dashboard-errors
Migrating to JSON: Appdynamics cpu metrics analysis-shaded chart
Migrating to JSON: metric_anomalies_template
Migrating to JSON: olb-engineering-dashboard_page_Metrics
Migrating to JSON: olb-observability-data_page_Metrics__with_Anomalies
Migrating to JSON: olb-observability-data_page_Metric Analysis
Sub Command: delete
Description: Delete a dashboard
usage: dashboard [-h] --name DASHBOARD_NAME
optional arguments:
  -h, --help  show this help message and exit
--name DASHBOARD_NAME
Name of the dashboard to delete
- Following is the syntax for dashboard delete
2023-01-04:09:34:58 [1] INFO nats_client Creating new SharedPool ...
2023-01-04:09:34:58 [1] INFO nats_client Initiallzing PubMgr for pid=1
2023-01-04:09:34:58 [1] INFO nats_client Saving NATS certificate to file: /tmp/nats_cert_custom_461dedd908ef2d75e509377dfe35be02_1.pem
Deleted dashboard: Appdynamics cpu metrics analysis-shaded chart 2
Sub Command: enable
Description: Change the status of a dashboard to 'enabled'
usage: dashboard [-h] --name DASHBOARD_NAME

optional arguments:
  -h, --help            show this help message and exit
  --name DASHBOARD_NAME
                        Name of the dashboard
- Following is the syntax for dashboard enable
2023-01-04:05:45:46 [1] INFO nats_client Creating new SharedPool ...
2023-01-04:05:45:46 [1] INFO nats_client Initiallzing PubMgr for pid=1
2023-01-04:05:45:46 [1] INFO nats_client Saving NATS certificate to file: /tmp/nats_cert_custom_461dedd908ef2d75e509377dfe35be02_1.pem
Changed status of Appdynamics cpu metrics analysis-shaded chart to enabled
Sub Command: disable
Description: Change the status of a dashboard to 'disabled'
usage: dashboard [-h] --name DASHBOARD_NAME

optional arguments:
  -h, --help            show this help message and exit
  --name DASHBOARD_NAME
                        Name of the dashboard
- Following is the syntax for dashboard disable
2023-01-04:05:44:47 [1] INFO nats_client Creating new SharedPool ...
2023-01-04:05:44:47 [1] INFO nats_client Initiallzing PubMgr for pid=1
2023-01-04:05:44:47 [1] INFO nats_client Saving NATS certificate to file: /tmp/nats_cert_custom_461dedd908ef2d75e509377dfe35be02_1.pem
Changed status of Appdynamics cpu metrics analysis-shaded chart to disabled
Sub Command: verify
Description: Verify the dashboard and any pages inside it for PStreams and columns
usage: dashboard [-h] --name DASHBOARD_NAME

optional arguments:
  -h, --help            show this help message and exit
  --name DASHBOARD_NAME
                        Name of the dashboard to verify
- Following is the syntax for dashboard verify
2023-01-04:06:28:41 [1] INFO nats_client Saving NATS certificate to file: /tmp/nats_cert_custom_461dedd908ef2d75e509377dfe35be02_1.pem
[
  {
    "dashboard": "Appdynamics cpu metrics analysis-shaded chart",
    "type": "widget",
    "widget_type": "shaded_chart",
    "title": "Appdynamics-cpumetrics",
    "stream": "Appdynamics_cpu_metrics",
    "columns": "timestamp",
    "stream_status": "found",
    "missing_columns": ""
  }
]
Sub Command: to-app
Description: Convert a tabbed or sectioned dashboard into multi-paged app
usage: dashboard [-h] --name DASHBOARD_NAME

optional arguments:
  -h, --help            show this help message and exit
  --name DASHBOARD_NAME
                        Name of the dashboard
- Following is the syntax for dashboard to-app
Adding new internal dashboard: rda-microservice-traces_page_Traces
2023-01-04:06:37:48 [1] INFO nats_client Creating new SharedPool ...
2023-01-04:06:37:48 [1] INFO nats_client Initiallzing PubMgr for pid=1
2023-01-04:06:37:48 [1] INFO nats_client Saving NATS certificate to file: /tmp/nats_cert_custom_461dedd908ef2d75e509377dfe35be02_1.pem
Adding new internal dashboard: rda-microservice-traces_page_Healthchecks
Updating dashboard {dashboard_name} as app...
rdauser@manojp-rda-platform:~$
Sub Command: dashgroup
Following are the valid Sub-Commands for the dashgroup
Sub Commands |
Description |
|---|---|
| add | Add or update dashboard group |
| get | Get JSON data for a dashboard group |
| list | List all dashboard groups |
| delete | Delete a dashboard group |
| enable | Change the status of a dashboard group to 'enabled' |
| disable | Change the status of a dashboard group to 'disabled' |
Following are valid sub-commands for dashgroup:
  add                       Add or update dashboard group
  get                       Get JSON data for a dashboard group
  list                      List all dashboard groups
  delete                    Delete a dashboard group
  enable                    Change the status of a dashboard group to 'enabled'
  disable                   Change the status of a dashboard group to 'disabled'
Sub Command: add
Description: Add or update dashboard group
usage: dashgroup [-h] --file INPUT_FILE [--overwrite]

optional arguments:
  -h, --help         show this help message and exit
  --file INPUT_FILE  JSON file containing dashboard group definition
  --overwrite        Overwrite even if a dashboard group already exists with
                     the specified name.
Note
Before running the add cmd ,create a JSON file containing dashboard group definition
- Following is the syntax for dashgroup add
2023-01-04:11:13:12 [1] INFO nats_client Creating new SharedPool ...
2023-01-04:11:13:12 [1] INFO nats_client Initiallzing PubMgr for pid=1
2023-01-04:11:13:12 [1] INFO nats_client Saving NATS certificate to file: /tmp/nats_cert_custom_461dedd908ef2d75e509377dfe35be02_1.pem
Added dashboard group l1-user new
Sub Command: get
Description: Get JSON data for a dashboard group
optional arguments:
  -h, --help            show this help message and exit
  --name DASHBOARD_GROUP_NAME
                        Name of the dashboard group
- Following is the syntax for dashgroup get
{
    "name": "l1-users",
    "label": "L1 Users",
    "dashboardList": [
        {
            "id": "user-dashboard-incident-topology",
            "name": "incident-topology"
        },
        {
            "id": "user-dashboard-incident-metrics",
            "name": "incident-metrics"
        },
        {
            "id": "user-dashboard-incident-collaboration",
            "name": "incident-collaboration"
        },
        {
            "id": "user-dashboard-l1-main-app",
            "name": "l1-main-app"
        }
    ],
    "users": "l1-user@cfx.com",
    "enabled": true,
    "description": "Dashboards for L1 Users",
    "saved_time": "2022-09-28T05:56:11.325672"
}
Sub Command: list
Description: List all dashboard groups
usage: dashgroup [-h] [--json]

optional arguments:
  -h, --help  show this help message and exit
  --json      Print detailed information in JSON format instead of tabular
              format
- Following is the syntax for dashgroup list
    name                     label                description                               enabled    saved_time
--  -----------------------  -------------------  ----------------------------------------  ---------  --------------------------
 0  Test                     Admin Group                                                    True       2022-12-21T16:59:47.419691
 1  l1-users                 L1 Users             Dashboards for L1 Users                   True       2022-09-28T05:56:11.325672
 2  executives               Executives           Dashboards for Executives                 True       2022-09-29T03:00:33.425663
 3  Experience Desk          Experience Desk      Dashboards for Experience Desk            True       2022-09-28T05:56:05.969015
 4  DevOps                   Users                                                          True       2022-09-28T19:21:38.852671
 5  TestGroup                TestGroup                                                      True       2022-09-28T03:59:14.609687
 6  Reression Training Test  Admin Group                                                    False      2022-09-28T05:56:07.802828
 7  Partner                  Admin                All Partner Dashboards                    True       2022-09-28T05:56:06.961122
 8  Acme                     Acme                                                           True       2022-10-23T22:03:29.461241
 9  bizops                   Business Operations  Dashboards for Business Operations Users  True       2022-09-29T03:11:06.780365
10  l2-users                 L2 Users             Dashboards for L2 Users                   True       2022-09-28T05:56:12.239130
11  l1-l3 Dashboard          l1-l3 Dashboard                                                True       2022-12-21T05:28:23.966417
12  Biz Command Center       Biz Command Center   Dashboards for Biz Command Center         True       2022-09-28T05:56:03.338590
13  Engineering              Engineering Group    Dashboards for Engineering Group          True       2022-09-28T05:56:05.072187
delete
Description: Delete a dashboard group
usage: dashgroup [-h] --name DASHBOARD_GROUP_NAME

optional arguments:
  -h, --help            show this help message and exit
  --name DASHBOARD_GROUP_NAME
                        Name of the dashboard group to delete
- Following is the syntax for dashgroup delete
2023-01-04:12:02:37 [1] INFO nats_client Creating new SharedPool ...
2023-01-04:12:02:37 [1] INFO nats_client Initiallzing PubMgr for pid=1
2023-01-04:12:02:37 [1] INFO nats_client Saving NATS certificate to file: /tmp/nats_cert_custom_461dedd908ef2d75e509377dfe35be02_1.pem
Deleted dashboard group: synthetics-control
Sub Command: enable
Description: Change the status of a dashboard group to 'enabled'
usage: dashgroup [-h] --name DASHBOARD_GROUP_NAME

optional arguments:
  -h, --help            show this help message and exit
  --name DASHBOARD_GROUP_NAME
                        Name of the dashboard group
- Following is the syntax for dashgroup enable
2023-01-04:10:54:08 [1] INFO nats_client Creating new SharedPool ...
2023-01-04:10:54:08 [1] INFO nats_client Initiallzing PubMgr for pid=1
2023-01-04:10:54:08 [1] INFO nats_client Saving NATS certificate to file: /tmp/nats_cert_custom_461dedd908ef2d75e509377dfe35be02_1.pem
Changed status of l1-users to enabled
Sub Command: disable
Description: Change the status of a dashboard group to 'disabled'
usage: dashgroup [-h] --name DASHBOARD_GROUP_NAME

optional arguments:
  -h, --help            show this help message and exit
  --name DASHBOARD_GROUP_NAME
                        Name of the dashboard group
- Following is the syntax for dashgroup disable
2023-01-04:10:53:16 [1] INFO nats_client Creating new SharedPool ...
2023-01-04:10:53:16 [1] INFO nats_client Initiallzing PubMgr for pid=1
2023-01-04:10:53:16 [1] INFO nats_client Saving NATS certificate to file: /tmp/nats_cert_custom_461dedd908ef2d75e509377dfe35be02_1.pem
Changed status of l1-users to disabled
Sub Command: dataset
Following are the valid Sub-Commands for the dataset
Sub Commands |
Description |
|---|---|
| list | List datasets from the object store |
| get | Download a dataset from the object store |
| meta | Download metadata for a dataset from the object store |
| add | Add a new dataset to the object store |
| delete | Delete a dataset from the object store |
| bounded-list | List bounded datasets from the object store |
| bounded-get | Download a bounded dataset from the object store |
| bounded-meta | Download metadata for a bounded dataset from the object store |
| bounded-add | Add a new bounded dataset to the system |
| bounded-import | Import the data for a bounded dataset and store it in the object store |
| bounded-delete | Delete a bounded dataset from the object store |
Dataset management commands

Following are valid sub-commands for dataset:
  list                      List datasets from the object store
  get                       Download a dataset from the object store
  meta                      Download metadata for a dataset from the object store
  add                       Add a new dataset to the object store
  delete                    Delete a dataset from the object store
  bounded-list              List bounded datasets from the object store
  bounded-get               Download a bounded dataset from the object store
  bounded-meta              Download metadata for a bounded dataset from the object store
  bounded-add               Add a new bounded dataset to the system
  bounded-import            Import the data for a bounded dataset and store it in the object store
  bounded-delete            Delete a bounded dataset from the object store
Sub Command: list
Description: List datasets from the object store
usage: dataset [-h] [--json]

optional arguments:
  -h, --help  show this help message and exit
  --json      Print detailed information in JSON format instead of tabular
              format
- Following is the syntax for dataset list
     name                                                    format      mem_size_mb    num_rows    num_columns  saved_time
---  ------------------------------------------------------  --------  -------------  ----------  -------------  --------------------------
  0  Appdynamics_cpu_metrics                                 csv               0.092        1000             12  2022-12-14T05:48:07.940815
  1  Appdynamics_cpu_metrics_new                             csv               0.092        1000             12  2023-01-04T12:00:17.628034
  2  Balancing_Control_to_Platform_Standardizer              csv               0               1              3  2022-10-19T00:32:51.328289
  3  DATASET-SERVICEWOW                                      csv               0.015        2000              1  2022-10-13T14:35:08.843641
  4  Data_Masking_to_hive_load                               csv               0               1              3  2022-10-19T00:32:51.657829
  5  Data_Parsing_to_Balancing_Control                       csv               0               1              3  2022-10-19T00:32:51.213174
  6  Feed_Data_Standardizer_to_Data_Masking                  csv               0               1              3  2022-10-19T00:32:51.550645
  7  Metadata_Validator_to_Preprocessing                     csv               0               1              3  2022-10-19T00:32:50.999017
  8  Online_Banking_Stack_Metrics                            csv               0.001           6             12  2022-09-29T04:01:45.875869
  9  Platform_Standardizer_to_Feed_Data_Standardizer         csv               0               1              3  2022-10-19T00:32:51.433995
 10  Preprocessing_to_Data_Parsing                           csv               0               1              3  2022-10-19T00:32:51.101942
 11  SS-AWS-event-groups                                     csv               0               3              9  2022-11-08T14:39:47.207992
Sub Command: get
Description: Download a dataset from the object store
usage: dataset [-h] --name NAME [--tofile SAVE_TO_FILE] [--json]
               [--format DATA_FORMAT] [--viz]

optional arguments:
  -h, --help            show this help message and exit
  --name NAME           Dataset name
  --tofile SAVE_TO_FILE
                        Save the data to the specified file (CSV or JSON if
                        --json is specified)
  --json                Export data as a JSON formatted rows. ** Deprecated.
                        Use --format **
  --format DATA_FORMAT  Save the downloaded data in the specified format.
                        Valid values are csv, json, parquet. If format is
                        'auto', format is determined from extension
  --viz                 Open Dataframe visualizer to show the data
- Following is the syntax for dataset get
Downloaded dataset. Number of Rows: 6, Columns: 12
[DFViz:1] Rows 6, Cols 12 | View Rows 0-6, Cols: 0-4 | Press 'q' to exit, '?' for help
          Data Filter:  | Col Filter:  | Data Sort:  | cfxql:
+----+-------------+----------+-----------------------+-----------------------------+--------------------------+
|    | component   | count_   | layer                 | metric_name                 | node_id                  |
|----+-------------+----------+-----------------------+-----------------------------+--------------------------|
|  0 |             |          | Application Component | db_slow_queries             | 10.95.134.103_Database   |
|  1 |             |          | Application Component | total_response_time         | 10.95.134.101_Webserver  |
|  2 |             |          | Application Component | consumer_lag                | 10.95.134.104_MessageBus |
|  3 |             |          | Application Component | under_replicated_partitions | 10.95.134.104_MessageBus |
|  4 |             |          | Application Component | db_connections              | 10.95.134.103_Database   |
|  5 |             |          | Application Component | transaction_time            | 10.95.134.102_Appserver  |
+----+-------------+----------+-----------------------+-----------------------------+--------------------------+
Sub Command: meta
Description: Download metadata for a dataset from the object store
usage: dataset [-h] --name NAME

optional arguments:
  -h, --help   show this help message and exit
  --name NAME  Dataset name
- Following is the syntax for dataset meta
{
  "name": "Online_Banking_Stack_Metrics",
  "format": "csv",
  "datafile": "cfxdm-saved-data/Online_Banking_Stack_Metrics-data.csv",
  "mem_size_mb": 0.001,
  "num_rows": 6,
  "num_columns": 12,
  "saved_time": "2022-09-29T04:01:45.875869",
  "dtypes": {
    "component": "float64",
    "count_": "float64",
    "layer": "object",
    "metric_name": "object",
    "node_id": "object",
    "node_label": "object",
    "node_type": "object",
    "source_tool": "object",
    "stack_name": "object",
    "timestamp": "object",
    "unit": "object",
    "value": "float64"
  }
}
Sub Command: add
Description: Add a new dataset to the object store
usage: dataset [-h] [--folder FOLDER] --name NAME --file INPUT_FILE
               [--local_format LOCAL_FORMAT] [--remote_format REMOTE_FORMAT]

optional arguments:
  -h, --help            show this help message and exit
  --folder FOLDER       Dataset Folder
  --name NAME           Dataset name
  --file INPUT_FILE     CSV or parquet formatted file from which dataset will
                        be added
  --local_format LOCAL_FORMAT
                        Local file format (auto or csv or parquet or json).
                        'auto' means format will be determined from filename
                        extension
  --remote_format REMOTE_FORMAT
                        Remote file format (csv or parquet).
- Following is the syntax for dataset add
Loaded dataset from file. Number of Rows: 100000, Columns: 13
Dataset 'metricsdata' not found in the object storage.
2023-01-05:05:13:37 [1] INFO nats_client Creating new SharedPool ...
2023-01-05:05:13:37 [1] INFO nats_client Initiallzing PubMgr for pid=1
2023-01-05:05:13:37 [1] INFO nats_client Saving NATS certificate to file: /tmp/nats_cert_custom_461dedd908ef2d75e509377dfe35be02_1.pem

Added dataset 'metricsdata'
Sub Command: delete
Description: Delete a dataset from the object store
usage: dataset [-h] --name NAME [--yes]

optional arguments:
  -h, --help   show this help message and exit
  --name NAME  Dataset name
  --yes        Delete without prompting
- Following is the syntax for dataset delete
Confirm deletion of dataset (y/n)? y
2023-01-05:05:21:39 [1] INFO nats_client Creating new SharedPool ...
2023-01-05:05:21:39 [1] INFO nats_client Initiallzing PubMgr for pid=1
2023-01-05:05:21:39 [1] INFO nats_client Saving NATS certificate to file: /tmp/nats_cert_custom_461dedd908ef2d75e509377dfe35be02_1.pem
Sub Command: bounded-list
Description: List bounded datasets from the object store
usage: dataset [-h] [--json]

optional arguments:
  -h, --help  show this help message and exit
  --json      Print detailed information in JSON format instead of tabular
              format
- Following is the syntax for dataset bounded-list
   drafts      mem_size_mb  name         num_columns    num_rows  saved_time                  schema
--  --------  -------------  ---------  -------------  ----------  --------------------------  ---------
 0  []                    0  Schema-QA              6           0  2023-01-05T04:39:16.255705  Schema-QA
 1  []                    0  Test                   3           0  2023-01-05T04:39:24.660053  Test
Sub Command: bounded-get
Description: Download a bounded dataset from the object store
usage: dataset [-h] --name NAME [--tofile SAVE_TO_FILE] [--format DATA_FORMAT]
               [--viz]

optional arguments:
  -h, --help            show this help message and exit
  --name NAME           Dataset name
  --tofile SAVE_TO_FILE
                        Save the data to the specified file (CSV or JSON if
                        --json is specified)
  --format DATA_FORMAT  Save the downloaded data in the specified format.
                        Valid values are csv, json, parquet. If format is
                        'auto', format is determined from extension
  --viz                 Open Dataframe visualizer to show the data
- Following is the syntax for dataset bounded-get
Downloaded bounded dataset. Number of Rows: 0, Columns: 7
[DFViz:1] Rows 0, Cols 7 | View Rows 0-0, Cols: 0-4 | Press 'q' to exit, '?' for help
          Data Filter:  | Col Filter:  | Data Sort:  | cfxql:
+--------+--------+--------+--------------+-------+
| text   | enum   | bool   | enum_array   | int   |
|--------+--------+--------+--------------+-------|
+--------+--------+--------+--------------+-------+
Sub Command: bounded-meta
Description: Download metadata for a bounded dataset from the object store
usage: dataset [-h] --name NAME

optional arguments:
  -h, --help   show this help message and exit
  --name NAME  Dataset name
{
  "name": "Schema-QA",
  "mem_size_mb": 0,
  "num_rows": 0,
  "drafts": [],
  "saved_time": "2023-01-05T04:39:16.255705",
  "schema": "Schema-QA",
  "num_columns": 6
}
Sub Command: bounded-add
Description: Add a new bounded dataset to the system
usage: dataset [-h] --name NAME --schema SCHEMA_NAME

optional arguments:
  -h, --help            show this help message and exit
  --name NAME           Dataset name
  --schema SCHEMA_NAME  Validate data against given schema. When schema is
                        given, the dataset is added as 'schema bounded
                        dataset'.
- Following is the syntax for dataset bounded-add
2023-01-05:04:54:02 [1] INFO nats_client Creating new SharedPool ...
2023-01-05:04:54:02 [1] INFO nats_client Initiallzing PubMgr for pid=1
2023-01-05:04:54:02 [1] INFO nats_client Saving NATS certificate to file: /tmp/nats_cert_custom_461dedd908ef2d75e509377dfe35be02_1.pem
Successfully added bounded dataset Example Schema
Sub Command: bounded-delete
Description: Delete a bounded dataset from the object store
usage: dataset [-h] --name NAME [--yes]

optional arguments:
  -h, --help   show this help message and exit
  --name NAME  Dataset name
  --yes        Delete without prompting
Confirm deletion of dataset (y/n)? y
Successfully deleted all drafts of Example Schema
2023-01-05:04:55:43 [1] INFO nats_client Creating new SharedPool ...
2023-01-05:04:55:43 [1] INFO nats_client Initiallzing PubMgr for pid=1
2023-01-05:04:55:43 [1] INFO nats_client Saving NATS certificate to file: /tmp/nats_cert_custom_461dedd908ef2d75e509377dfe35be02_1.pem
Successfully deleted bounded data set Example Schema
bounded-import
Description: Import the data for a bounded dataset and store it in the object store
usage: dataset [-h] --name NAME --file INPUT_FILE
               [--local_format LOCAL_FORMAT] [--yes] [--json]

optional arguments:
  -h, --help            show this help message and exit
  --name NAME           Dataset name
  --file INPUT_FILE     CSV or parquet formatted file from which dataset will
                        be added
  --local_format LOCAL_FORMAT
                        Local file format (auto or csv or parquet or json).
                        'auto' means format will be determined from filename
                        extension
  --yes                 Delete without prompting
  --json                Print detailed information in JSON format instead of
                        tabular format
- Following is the syntax for dataset bounded-import
Sub Command: demo
Following are the valid Sub-Commands for the demo
Sub Commands |
Description |
|---|---|
| backup | Export dashboards and all related artifact meta data in to a folder |
| setup | Setup a target system for demo |
| diff | Compare two backup directories |
Demo related commands

Following are valid sub-commands for demo:
  backup                    Export dashboards and all related artifact meta data in to a folder
  setup                     Setup a target system for demo
  diff                      Compare two backup directories
Note
To create demo.tar.gz file from the output folder use the below mentioned commands
Sub Command: backup
Description: Export dashboards and all related artifact meta data in to a folder
usage: demo [-h] --to_dir TO_DIR [--yaml]

optional arguments:
  -h, --help       show this help message and exit
  --to_dir TO_DIR  Output directory
  --yaml           Export in YAML format (default is JSON)
- Following is the syntax for demo backup
Backing up 109 Dashboards
Backing up 16 Dashboard Groups
Backing up 52 Published Pipelines
Backing up 11 Blueprints
Backing up 4 Synthetic Profiles
Backing up 4 Stacks used in Synthetic Profiles
2023-01-05:06:31:18 [1] INFO nats_client Saving NATS certificate to file: /tmp/nats_cert_custom_461dedd908ef2d75e509377dfe35be02_1.pem
Backing up 16 Endpoints
Backing up 9 Mappings
Backing up 98 Persistent Streams
Sub Command: diff
Description: Compare two backup directories
usage: demo [-h] --first FIRST --second SECOND [--details] [--side]
            [--no_ident] [--opts OPTIONS]

optional arguments:
  -h, --help       show this help message and exit
  --first FIRST    First Directory where demo setup artifacts are stored.
  --second SECOND  Second Directory where demo setup artifacts are stored.
  --details        Show detailed diffs between files
  --side           While Showing diffs use side-by-side format
  --no_ident       Exclude Identical Objects from output
  --opts OPTIONS   Comma separated list of artifacts names to restrict: stacks
                   (st), pstreams (ps), dashboards (d), dashboard_groups
                   (dg),synthetic_profiles (syn)
- Following is the syntax for demo diff
Dashboard        l1-main-app                                        Identical
Dashboard        olb-engineering-dashboard_page_Metric Analysis     Identical
Dashboard        rda-mgmt-page-blueprints                           Identical
Dashboard        olb-business-command-center                        Identical
Dashboard        rda-microservice-traces_page_Healthchecks          Identical
Dashboard        rda-mgmt-page-stagingarea                          Identical
Dashboard        incident-metrics                                   Identical
Dashboard        ss_ch_all_sources                                  Identical
Dashboard        alert-incident-summary                             Identical
Dashboard        l2-l3-incidents                                    Identical
Dashboard        olb-observability-data_page_Metric Analysis        Identical
Dashboard        incident-topology                                  Identical
Dashboard        olb-bizops-observability_page_Incidents_network    Identical
Dashboard        ss_ch_pal_page_Analytics                           Identical
Dashboard        olb-bizops-observability                           Identical
- Following is the syntax No.2 for demo diff
Sub Command: setup
Description: Setup a target system for demo
usage: demo [-h] --dir FOLDER --ip PLATFORM_IP [--port WEBHOOK_PORT]
            [--protocol  WEBHOOK_PROTO] [--pipelines PIPELINES]
            [--blueprints BLUEPRINTS] [--verify_only]

optional arguments:
  -h, --help            show this help message and exit
  --dir FOLDER          Directory where demo setup artifacts are stored. Most
                        contain a settings.json in that folder
  --ip PLATFORM_IP      Target platform Public IP Address
  --port WEBHOOK_PORT   Port for webhook server (Default 7443)
  --protocol  WEBHOOK_PROTO
                        Protocol for Webhook server (Default https)
  --pipelines PIPELINES
                        Comma seperated list of Pipeline names to deploy them
                        alone
  --blueprints BLUEPRINTS
                        Comma seperated list of Blueprint names to deploy them
                        alone
  --verify_only         Verify Only. Do not push changes to target system
- Following is the syntax for demo setup
WARNING: dashboards directory not found, skipping
WARNING: dashboard_groups directory not found, skipping
WARNING: stacks directory not found, skipping
WARNING: synthetic_profiles directory not found, skipping
WARNING: persistent_streams directory not found, skipping
WARNING: pipelines directory not found, skipping
WARNING: blueprints directory not found, skipping
WARNING: endpoints directory not found, skipping
WARNING: mappings directory not found, skipping
Performing Audit ...
2023-01-05:06:22:58 [1] INFO nats_client Saving NATS certificate to file: /tmp/nats_cert_custom_461dedd908ef2d75e509377dfe35be02_1.pem
Skipping audit for pstreams
Skipping audit for dashboards
Skipping audit for Dashboard Groups
Skipping audit for Stacks
Skipping audit for Synthetic Profiles
Skipping audit for Publish Pipelines
Skipping audit for Blueprints

Everyhing configured (Total Checks 2)
Sub Command: bundle-deploy
optional arguments:
  -h, --help          show this help message and exit
  --file BUNDLE_FILE  Bundle file to be deployed. Must be in .tar.gz format
  --type TYPE         Deploy only specified types. Comma separated list. (d:
                      dashboard, b: blueprint, p: pipeline)
  --compare           Compare bundle vs currently deployed. Do not deploy any
                      artifact
Deployed following artifacts from this bundle:

    type      name
--  --------  ---------------------------------------------------
 0  pipeline  vmware_vcenter_inventory_pipeline_v1_c1
 1  pipeline  vmware_vcenter_inventory_topology_pipeline_v1_c2
 2  pipeline  windows_host_os_system_inventory_and_topology_v1_c1
 3  pipeline  irm-stream-missing-columns-update
 4  pipeline  netapp_cmode_storage_arrays_inventory_v1
 5  pipeline  vmware_vcenter_inventory_pipeline_v1_c2
 6  pipeline  vmware_vcenter_inventory_topology_pipeline_v1_c1
 7  pipeline  linux_host_os_system_inventory_and_topology_v1_c2
 8  pipeline  linux_host_os_system_inventory_and_topology_v1_c3
 9  pipeline  oia-sources-streams-merge
10  pipeline  netapp_storage_array_topology_pipeline_v1
11  pipeline  kubernetes_cluster_inventory_pipeline_v1
12  pipeline  cisco_ucs_cimc_inventory_v1
13  pipeline  linux_host_os_system_inventory_and_topology_v1_c1
14  pipeline  windows_host_os_system_inventory_and_topology_v1_c2
15  pipeline  kubernetes_cluster_topology_pipeline_v1
16  pipeline  cisco-ucsm-infra-topology-pipeline-v1
17  pipeline  NetApp_7Mode_inventroy
Note
Similar to the pipeline bundle deployment in the example shown above, We can deploy for Dashboards and Service Blueprints
Sub Command: deployment
Following are the valid Sub-Commands for the deployment
Sub Commands |
Description |
|---|---|
| activity | List recent deployment activities |
| status | Display status of all deployments |
| audit-report | Display Audit report for a given deployment ID |
| add | Add a new Deployment to the repository. Deployment specification must be in valid YML format |
| enable | Enable an existing deployment if it is not already enabled |
| disable | Disable an existing deployment if it is not already disabled |
| delete | Delete an existing deployment from repository |
| dependencies | List all artifact dependencies used by the deployment |
| svcs-status | List current status of all service pipelines in a deployment |
| map | Print service map information in JSON format for the given deployment |
Following are valid sub-commands for deployment:

  activity                  List recent deployment activities
  status                    Display status of all deployments
  audit-report              Display Audit report for a given deployment ID
  add                       Add a new Deployment to the repository. Deployment specification must be in valid YML format
  enable                    Enable an existing deployment if it is not already enabled
  disable                   Disable an existing deployment if it is not already disabled
  delete                    Delete an existing deployment from repository
  dependencies              List all artifact dependencies used by the deployment
  svcs-status               List current status of all service pipelines in a deployment
  map                       Print service map information in JSON format for the given deployment
Sub Command: activity
Description: List recent deployment activities
usage: deployment [-h] [--json]

optional arguments:
  -h, --help  show this help message and exit
  --json      Print detailed information in JSON format instead of tabular
              format
- Following is the syntax for deployment activity
    timestamp                   severity    message
--  --------------------------  ----------  ----------------------------------------------------------------------------------------------------------------------------------------
 0  2022-12-21T09:05:13.943451  WARNING     Re-Created Job: f5cc308e6d014173ac2a7893b1bae564 for Deployment Name: Demo_vmware_service_blueprint, Id: b744c8c2. Restart Count: 213
 1  2022-12-21T09:05:13.301284  WARNING     Re-Created Job: 19c5ad1f4b5442a6a662bfd0493cc3db for Deployment Name: Service Action schedule pipeline, Id: b744c8c0. Restart Count: 213
 2  2022-12-21T09:05:12.817716  WARNING     Re-Created Job: 8cc74ba0d633413faea5230aa2590d41 for Deployment Name: Blueprint_18_11_2022, Id: b744c873. Restart Count: 213
 3  2022-12-21T09:04:02.257588  WARNING     Re-Created Job: 4d2b3770013b462db8cbcc421084a057 for Deployment Name: Demo_vmware_service_blueprint, Id: b744c8c2. Restart Count: 212
 4  2022-12-21T09:04:01.482574  WARNING     Re-Created Job: e37777adca0a4a3fb6eeb431e0b9acca for Deployment Name: Service Action schedule pipeline, Id: b744c8c0. Restart Count: 212
 5  2022-12-21T09:04:00.992727  WARNING     Re-Created Job: b792ae4110a6469883abcdf709692dee for Deployment Name: Blueprint_18_11_2022, Id: b744c873. Restart Count: 212
 6  2022-12-21T09:02:50.307263  WARNING     Re-Created Job: f9e9a10bf1dd46e8a14049d0ac26a87a for Deployment Name: Demo_vmware_service_blueprint, Id: b744c8c2. Restart Count: 211
Sub Command: status
Description: Display status of all deployments
usage: deployment [-h] [--json]

optional arguments:
  -h, --help  show this help message and exit
  --json      Print detailed information in JSON format instead of tabular
              format
- Following is the syntax for deployment status
    id                                      category                                name                                    description                                                                                     enabled      errors    warnings
--  --------------------------------------  --------------------------------------  --------------------------------------  ----------------------------------------------------------------------------------------------  ---------  --------  ----------
 0  41e33973                                ITSM                                    eBonding                                eBond ServiceNow incidents to PagerDuty, Twilio-SMS, Elasticsearch/Kibana, Slack, Email         no                0           0
 1  81a1a030                                ITOM                                    ML-Experiments                          ML Experiments                                                                                  yes               0           0
 2  81a1a2202                               ITOM                                    OIA                                     Ops Intelligence & Analytics                                                                    yes               0           0
 3  81a1a2203                               ITOM                                    Stacks                                  Stacks                                                                                          yes               0           0
 4  V2tdZpEs                                Dependency Mapping                      AWS Dependency Mapper                   AWS Dependency mapping with updates every hour                                                  yes               2           0
 5  b744c873                                Service Action schedule pipeline        Blueprint_18_11_2022                    Service Action schedule pipeline example                                                        yes               0           2
 6  b744c8c0                                Service Action schedule pipeline        Service Action schedule pipeline        Service Action schedule pipeline example                                                        yes               0           1
 7  b744c8c1                                Service Action schedule pipeline        Blueprint_16_11_2022                    Service Action schedule pipeline example                                                        no                0           0
 8  b744c8c2                                vmware schedule pipeline                Demo_vmware_service_blueprint           vmware schedule pipeline                                                                        yes               0           0
 9  exec_dashboard_kpi_metrics_querystream  exec_dashboard_kpi_metrics_querystream  exec_dashboard_kpi_metrics_querystream  exec_dashboard_kpi_metrics_querystream                                                          yes               0           0
10  guide001                                Log Analytics                           Beginner Guide Blueprint                Generate Synthetic Syslogs, Save all logs to Log Archive, send processed logs to a NULL stream  yes               0           0
Sub Command: audit-report
Description: Display Audit report for a given deployment ID
usage: deployment [-h] --id DEPLOYMENT_ID [--json]

optional arguments:
  -h, --help          show this help message and exit
  --id DEPLOYMENT_ID  Deployment ID
  --json              Print detailed information in JSON format instead of
                      tabular format
- Following is the syntax for deployment audit-report
    type                      severity    message
--  ------------------------  ----------  -------------------------------------------------------------------------------------------
 0  Verify Pipeline           INFO        Pipeline with name 'aws-dependency-mapper' and version '22_02_16_1' loaded
 1  Verify Pipeline           INFO        Pipeline with name 'aws-dependency-mapper-inner-pipeline' and version '2022_02_16_1' loaded
 2  Verify Pipeline           ERROR       No published versions found for pipline: aws-dependency-mapper2
 3  Verify Site               ERROR       No sites matched the regex 'cfx.*' or no active workers found
 4  Verify Source             INFO        Credential found for Integration: aws, Type: aws_v2
 5  Verify Persistent Stream  INFO        PStream rda_worker_resource_usage found
 6  Verify Persistent Stream  INFO        PStream rda_system_worker_trace_summary found
 7  Verify Persistent Stream  INFO        PStream rda_worker_resource_usage found
 8  Verify Persistent Stream  INFO        PStream rda_system_worker_trace_summary found
 9  Verify Persistent Stream  INFO        PStream rda_system_deployment_updates found
10  Verify Persistent Stream  INFO        PStream rda_system_gw_endpoint_metrics found
Sub Command: add
Description: Add a new Deployment to the repository. Deployment specification must be in valid YML format
usage: deployment [-h] --file INPUT_FILE [--overwrite]

optional arguments:
  -h, --help         show this help message and exit
  --file INPUT_FILE  YAML file containing Deployment specification
  --overwrite        Overwrite even if a ruleset already exists with a name.
- Following is the syntax for deployment add
- sample blueprint.yml file
cat > blueprint.yml << 'EOF'
name: Blueprint_Example
id: b744c873a
version: '2022_12_19_01'
category: Service Action schedule pipeline
comment: Service Action schedule pipeline example
enabled: true
type: Service
auto_deploy: false
provider: CloudFabrix Software Inc.
attrs: {}
service_pipelines:
    -   name: Service_Pipeline
        label: Service Pipelines
        version: '*'
        site: rda-site-01
        site_type: regex
        instances: 1
        scaling_policy:
            min_instances: 1
            max_instances: 1
action_pipelines:
    -   name: Action_Pipeline
        label: Action Pipelines
        version: '*'
        site: rda-site-01
        site_type: regex
        instances: 1
        scaling_policy:
            min_instances: 1
            max_instances: 1
scheduled_pipelines:
    -   name: schedule_pipeline
        label: Scheduled Pipelines
        version: '*'
        site: rda-site-01
        cron_expression: '*/5 * * * *'
        site_type: regex
        instances: 1
        scaling_policy:
            min_instances: 1
            max_instances: 1

EOF
Sub Command: enable
Description: Enable an existing deployment if it is not already enabled
Usage: deployment-enable  [-h] --id DEP_ID

optional arguments:
  -h, --help   show this help message and exit
  --id DEP_ID  Deployment ID
- Following is the syntax for deployment enable
Sub Command: disable
Description: Disable an existing deployment if it is not already disabled
Usage: deployment-disable  [-h] --id DEP_ID

optional arguments:
  -h, --help   show this help message and exit
  --id DEP_ID  Deployment ID
- Following is the syntax for deployment disable
Sub Command: delete
Description: Delete an existing deployment from repository
usage: deployment [-h] --id DEP_ID

optional arguments:
  -h, --help   show this help message and exit
  --id DEP_ID  Deployment ID
- Following is the syntax for deployment delete
2022-12-22:08:49:02 [1] INFO nats_client Creating new SharedPool ...
2022-12-22:08:49:02 [1] INFO nats_client Initiallzing PubMgr for pid=1
2022-12-22:08:49:02 [1] INFO nats_client Saving NATS certificate to file: /tmp/nats_cert_custom_461dedd908ef2d75e509377dfe35be02_1.pem
Deleted deployment with ID ID: 44de62c6
Sub Command: dependencies
Description: List all artifact dependencies used by the deployment
Usage: deployment-dependencies  [-h] --id DEPLOYMENT_ID [--json]

optional arguments:
  -h, --help          show this help message and exit
  --id DEPLOYMENT_ID  Deployment ID
  --json              Print detailed information in JSON format instead of
                      tabular format
- Following is the syntax for deployment dependencies
    type      name                                  read    write
--  --------  ------------------------------------  ------  -------
 0  pipeline  aws-dependency-mapper                 True    False
 1  pipeline  aws-dependency-mapper-inner-pipeline  True    False
 2  dataset   cfx-aws-ec2-instances                 True    True
 3  dataset   cfx-aws-ec2-instance-types            True    True
 4  dataset   cfx-aws-ec2-volumes                   True    True
 5  dataset   cfx-aws-ec2-vpcs                      True    True
 6  dataset   cfx-aws-ec2-efs-filesystems           True    True
 7  dataset   cfx-aws-ec2-security-groups           True    True
 8  dataset   cfx-aws-ec2-subnets                   True    True
 9  dataset   cfx-aws-ec2-internet-gateways         True    True
10  dataset   cfx-aws-ec2-security-group-nodes      True    True
Sub Command: svcs-status
Description: List current status of all service pipelines in a deployment
usage: deployment [-h] --id DEPLOYMENT_ID [--json]

optional arguments:
  -h, --help          show this help message and exit
  --id DEPLOYMENT_ID  Deployment ID
  --json              Print detailed information in JSON format instead of
                      tabular format
- Following is the syntax for deployment svcs-status
  label                                                         pipeline_name                               version      min_instances    max_instances    instances    num_jobs
--  ------------------------------------------------------------  ------------------------------------------  ---------  ---------------  ---------------  -----------  ----------
 0  Read incidents from ServiceNow write to stream                ebonding-servicenow-to-stream-v2            *                        1                4            1           0
 1  Read incidents from stream and write to Elasticsearch/Kibana  ebonding-stream-to-elasticsearch-kibana-v2  *                        0                4            1           0
 2  Read incidents from stream and write to Twilio-SMS            ebonding-stream-to-twilio-sms-v2            *                        0                4            1           0
 3  Read incidents from stream and write to PagerDuty             ebonding-stream-to-pagerduty                *                        0                4            1           0
 4  Read incidents from stream and write to Slack                 ebonding-stream-to-slack                    *                        0                4            1           0
 5  Read incidents from stream and write to Email                 ebonding-stream-to-email                    *                        0                4            1           0
Sub Command: map
Description: Print service map information in JSON format for the given deployment
Usage: deployment-map  [-h] --id DEPLOYMENT_ID

optional arguments:
  -h, --help          show this help message and exit
  --id DEPLOYMENT_ID  Deployment ID
- Following is the syntax for deployment map
{
  "status": "ok",
  "reason": "",
  "data": {
    "stack": {
      "name": "eBonding",
      "description": "Service map for blueprint: eBonding",
      "nodes": [
        {
          "node_id": "rda-network-stream-ebonding-analytics",
          "node_type": "rda-network-stream",
          "layer": "RDA Stream",
          "iconURL": "Stream",
          "node_label": "ebonding-analytics"
        },
        {
          "node_id": "pstream-ebonding-analytics",
          "node_type": "Persistent Stream",
          "node_label": "ebonding-analytics",
          "layer": "Persistent Stream",
          "iconURL": "Persistent_Stream"
        },
        {
          "node_id": "rda-network-stream-rda_worker_resource_usage",
          "node_type": "rda-network-stream",
          "layer": "RDA Stream",
          "iconURL": "Stream",
          "node_label": "rda_worker_resource_usage",
          "defaultVisibility": "hidden"
        },
        {
          "node_id": "pstream-rda_worker_resource_usage",
          "node_type": "Persistent Stream",
          "node_label": "rda_worker_resource_usage",
          "layer": "Persistent Stream",
          "iconURL": "Persistent_Stream",
          "defaultVisibility": "hidden"
        },
        {
          "node_id": "rda-network-stream-rda_system_worker_trace_summary",
          "node_type": "rda-network-stream",
          "layer": "RDA Stream",
          "iconURL": "Stream",
          "node_label": "rda_system_worker_trace_summary",
          "defaultVisibility": "hidden"
        },
        {
          "node_id": "pstream-rda_system_worker_trace_summary",
          "node_type": "Persistent Stream",
          "node_label": "rda_system_worker_trace_summary",
          "layer": "Persistent Stream",
          "iconURL": "Persistent_Stream",
          "defaultVisibility": "hidden"
        },
        {
          "node_id": "rda-network-stream-rda_system_deployment_updates",
          "node_type": "rda-network-stream",
          "layer": "RDA Stream",
          "iconURL": "Stream",
          "node_label": "rda_system_deployment_updates",
          "defaultVisibility": "hidden"
        },
        {
          "node_id": "pstream-rda_system_deployment_updates",
          "node_type": "Persistent Stream",
          "node_label": "rda_system_deployment_updates",
          "layer": "Persistent Stream",
          "iconURL": "Persistent_Stream",
          "defaultVisibility": "hidden"
        }
      ],
      "relationships": [
        {
          "left_id": "rda-network-stream-ebonding-analytics",
          "right_id": "pstream-ebonding-analytics",
          "description": "Stream persistence",
          "relationship_type": "uses"
        },
        {
          "left_id": "rda-network-stream-rda_worker_resource_usage",
          "right_id": "pstream-rda_worker_resource_usage",
          "description": "Stream persistence",
          "relationship_type": "uses"
        },
        {
          "left_id": "rda-network-stream-rda_system_worker_trace_summary",
          "right_id": "pstream-rda_system_worker_trace_summary",
          "description": "Stream persistence",
          "relationship_type": "uses"
        },
        {
          "left_id": "rda-network-stream-rda_system_deployment_updates",
          "right_id": "pstream-rda_system_deployment_updates",
          "description": "Stream persistence",
          "relationship_type": "uses"
        }
      ]
    }
  }
}
Sub Command: event-gw-status
Description: List status of all ingestion endpoints at all the event gateways
usage: rdac [-h] [--json]

optional arguments:
  -h, --help  show this help message and exit
  --json      Print detailed information in JSON format instead of tabular
              format
Sub Command: evict
Description: Evict a job from a worker pod
Usage: evict  [-h] --jobid JOBID [--yes]

optional arguments:
  -h, --help     show this help message and exit
  --jobid JOBID  RDA worker jobid. If partial must match only one job.
  --yes          Do not prompt for confirmation, evict if job is found
Sub Command: file-ops
Description: Perform various operations on local files
Usage: file-ops copy                      Copy dataframe from one format to another. Format is inferred from extension. Examples are csv, parquet, json
  csv-to-parquet            Copy data from CSV to parquet file using chunking
  test-formats              Run performance test on various formats

positional arguments:
  subcommand  File ops sub-command

optional arguments:
  -h, --help  show this help message and exit
Sub Command: file-to-object
Description: Convert files from a column into objects
Usage: file-to-object  [-h] --inpcol INPUT_FILENAME_COLUMN --outcol OUTPUT_COLUMN --file
            INPUT_FILE --outfolder OUTPUT_FOLDER --outfile OUTPUT_FILE

optional arguments:
  -h, --help            show this help message and exit
  --inpcol INPUT_FILENAME_COLUMN
                        Name of the column in input that contains the
                        filenames
  --outcol OUTPUT_COLUMN
                        Column name where object names will be inserted
  --file INPUT_FILE     Input csv filename
  --outfolder OUTPUT_FOLDER
                        Folder name where objects will be stored
  --outfile OUTPUT_FILE
                        Name of output csv file that has object location
                        stored
Sub Command: fmt-template-delete
Description: Delete Formatting Template
Usage: fmt-template-delete  [-h] --name NAME

optional arguments:
  -h, --help   show this help message and exit
  --name NAME  Formatting Template Name
Sub Command: fmt-template-get
Description: Get Formatting Template
Usage: fmt-template-get  [-h] --name NAME [--tofile SAVE_TO_FILE] [--json]

optional arguments:
  -h, --help            show this help message and exit
  --name NAME           Formatting Template Name
  --tofile SAVE_TO_FILE
                        Save the data to the specified file
  --json                Export data as a JSON formatted rows. ** Deprecated.
                        Use --format **
Sub Command: fmt-template-list
Description: List Formatting Templates
Usage: fmt-template-list  [-h] [--json]

optional arguments:
  -h, --help  show this help message and exit
  --json      Print detailed information in JSON format instead of tabular
              format
Sub Command: graphdb
Following are the valid Sub-Commands for the graphdb
Sub Commands |
Description |
|---|---|
| create | Create a new database |
| delete | Delete a database |
| list | List all databases |
| create-collection | Create a new collection (document or edge) |
| delete-collection | Delete a collection |
| list-collections | List all collections in a database |
| create-graph | Create a graph |
| delete-graph | Delete a graph |
| list-graphs | List all graphs in a database |
| query | Query a collection using CFXQL |
| graph-query | Execute an AQL query |
| insert-nodes | Insert nodes from CSV or JSON file |
| insert-edges | Insert edges from CSV or JSON file |
Commands to manage GraphDB

Following are valid sub-commands for graphdb:
  create                    Create a new database
  delete                    Delete a database
  list                      List all databases
  create-collection         Create a new collection (document or edge)
  delete-collection         Delete a collection
  list-collections          List all collections in a database
  create-graph              Create a graph
  delete-graph              Delete a graph
  list-graphs               List all graphs in a database
  query                     Query a collection using CFXQL
  graph-query               Execute an AQL query
  insert-nodes              Insert nodes from CSV or JSON file
  insert-edges              Insert edges from CSV or JSON file
Sub Command: create
Description: Create a new database in GraphDB
usage: graphdb create [-h] database_name

positional arguments:
  database_name  Name of the database to create

optional arguments:
  -h, --help     show this help message and exit
- Following is the syntax for graphdb create
Sub Command: delete
Description: Delete a database from GraphDB
usage: graphdb delete [-h] [--confirm] database_name

positional arguments:
  database_name  Name of the database to delete

optional arguments:
  -h, --help     show this help message and exit
  --confirm      Confirm deletion without prompting
- Following is the syntax for graphdb delete
Are you sure you want to delete database 'my_topology_db'? (yes/no): yes
Database 'my_topology_db' deleted successfully
- Following is the syntax for graphdb delete with
--confirmflag (skip confirmation prompt)
Warning
graphdb delete permanently deletes the database and all its collections, graphs, and data. Use with caution.
Sub Command: list
Description: List all databases in GraphDB
usage: graphdb list [-h] [--json]

optional arguments:
  -h, --help  show this help message and exit
  --json      Output in JSON format (default: table)
- Following is the syntax for graphdb list
+------------------+
| database         |
+==================+
| _system          |
+------------------+
| my_topology_db   |
+------------------+
| network_topology |
+------------------+

Total databases: 3
- Following is the syntax for graphdb list with JSON output
Sub Command: create-collection
Description: Create a new collection in a database (document or edge collection)
usage: graphdb create-collection [-h] --database DATABASE_NAME [--edge] collection_name

positional arguments:
  collection_name       Name of the collection to create

optional arguments:
  -h, --help            show this help message and exit
  --database DATABASE_NAME
                        Database name
  --edge                Create an edge collection
- Following is the syntax for graphdb create-collection (document collection)
- Following is the syntax for graphdb create-collection (edge collection)
Note
Document collections store nodes/vertices. Edge collections store relationships between nodes. Use --edge flag when creating collections that will store relationships.
Sub Command: delete-collection
Description: Delete a collection from a database
usage: graphdb delete-collection [-h] --database DATABASE_NAME [--confirm] collection_name

positional arguments:
  collection_name       Name of the collection to delete

optional arguments:
  -h, --help            show this help message and exit
  --database DATABASE_NAME
                        Database name
  --confirm             Confirm deletion without prompting
- Following is the syntax for graphdb delete-collection
Are you sure you want to delete collection 'nodes'? (yes/no): yes
Collection 'nodes' deleted successfully
- Following is the syntax for graphdb delete-collection with
--confirmflag
Sub Command: list-collections
Description: List all collections in a database
usage: graphdb list-collections [-h] --database DATABASE_NAME [--system] [--json]

optional arguments:
  -h, --help            show this help message and exit
  --database DATABASE_NAME
                        Database name
  --system              Include system collections
  --json                Output in JSON format (default: table)
- Following is the syntax for graphdb list-collections
+---------------+----------+--------+
| name          | type     | system |
+===============+==========+========+
| nodes         | document | False  |
+---------------+----------+--------+
| relationships | edge     | False  |
+---------------+----------+--------+
| devices       | document | False  |
+---------------+----------+--------+

Total collections: 3
- Following is the syntax for graphdb list-collections with system collections
+---------------------+----------+--------+
| name                | type     | system |
+=====================+==========+========+
| _analyzers          | document | True   |
+---------------------+----------+--------+
| _appbundles         | document | True   |
+---------------------+----------+--------+
| nodes               | document | False  |
+---------------------+----------+--------+
| relationships       | edge     | False  |
+---------------------+----------+--------+

Total collections: 4
- Following is the syntax for graphdb list-collections with JSON output
[
  {
    "name": "nodes",
    "type": "document",
    "system": false
  },
  {
    "name": "relationships",
    "type": "edge",
    "system": false
  }
]
Sub Command: create-graph
Description: Create a graph in GraphDB
usage: graphdb create-graph [-h] --database DATABASE_NAME --from-collections FROM_COLLECTIONS
                            --to-collections TO_COLLECTIONS --edge-collection EDGE_COLLECTION
                            graph_name

positional arguments:
  graph_name            Name of the graph to create

optional arguments:
  -h, --help            show this help message and exit
  --database DATABASE_NAME
                        Database name
  --from-collections FROM_COLLECTIONS
                        Comma-separated list of source vertex collections
  --to-collections TO_COLLECTIONS
                        Comma-separated list of target vertex collections
  --edge-collection EDGE_COLLECTION
                        Edge collection name
- Following is the syntax for graphdb create-graph
rdac graphdb create-graph topology_graph --database my_topology_db \
    --from-collections nodes \
    --to-collections nodes \
    --edge-collection relationships
- Following is the syntax for graphdb create-graph with multiple source/target collections
rdac graphdb create-graph network_graph --database network_topology \
    --from-collections servers,routers,switches \
    --to-collections servers,routers,switches \
    --edge-collection connections
Note
A graph defines the relationship structure between vertex (node) collections through an edge collection. The --from-collections and --to-collections specify which collections can be connected by edges in the --edge-collection.
Sub Command: delete-graph
Description: Delete a graph from GraphDB
usage: graphdb delete-graph [-h] --database DATABASE_NAME [--drop-collections] [--confirm]
                            graph_name

positional arguments:
  graph_name            Name of the graph to delete

optional arguments:
  -h, --help            show this help message and exit
  --database DATABASE_NAME
                        Database name
  --drop-collections    Also drop the associated collections
  --confirm             Confirm deletion without prompting
- Following is the syntax for graphdb delete-graph
Are you sure you want to delete graph 'topology_graph'? (yes/no): yes
Graph 'topology_graph' deleted successfully
- Following is the syntax for graphdb delete-graph with
--drop-collections(also delete associated collections)
Warning
Using --drop-collections will permanently delete all vertex and edge collections associated with the graph along with their data.
Sub Command: list-graphs
Description: List all graphs in a database
usage: graphdb list-graphs [-h] --database DATABASE_NAME [--json]

optional arguments:
  -h, --help            show this help message and exit
  --database DATABASE_NAME
                        Database name
  --json                Output in JSON format (default: table)
- Following is the syntax for graphdb list-graphs
+----------------+------------------+------------------+------------------+
| name           | edge_collection  | from_collections | to_collections   |
+================+==================+==================+==================+
| topology_graph | relationships    | nodes            | nodes            |
+----------------+------------------+------------------+------------------+
| network_graph  | connections      | servers, routers | servers, routers |
+----------------+------------------+------------------+------------------+

Total graphs: 2
- Following is the syntax for graphdb list-graphs with JSON output
[
  {
    "name": "topology_graph",
    "edge_definitions": [
      {
        "edge_collection": "relationships",
        "from_vertex_collections": ["nodes"],
        "to_vertex_collections": ["nodes"]
      }
    ]
  }
]
Sub Command: query
Description: Query a GraphDB collection using CFXQL
usage: graphdb query [-h] --database DATABASE_NAME [--query CFXQL_QUERY] [--max-rows MAX_ROWS]
                     [--sortby SORT_BY] [--order {asc,desc}] [--json]
                     collection_name

positional arguments:
  collection_name       Collection name to query

optional arguments:
  -h, --help            show this help message and exit
  --database DATABASE_NAME
                        Database name
  --query CFXQL_QUERY   CFXQL query string (default: *)
  --max-rows MAX_ROWS   Maximum number of rows to return (default: 100)
  --sortby SORT_BY      Comma-separated list of columns to sort by
  --order {asc,desc}    Sort order: asc or desc (default: desc)
  --json                Output in JSON format (default: table)
- Following is the syntax for graphdb query (query all documents)
+------------------+------------+-------------+--------+
| _key             | node_id    | node_label  | status |
+==================+============+=============+========+
| server_001       | server_001 | Web Server  | active |
+------------------+------------+-------------+--------+
| server_002       | server_002 | DB Server   | active |
+------------------+------------+-------------+--------+
| router_001       | router_001 | Core Router | active |
+------------------+------------+-------------+--------+

Total results: 3
- Following is the syntax for graphdb query with CFXQL filter
rdac graphdb query nodes --database my_topology_db --query "status = 'active' and node_type = 'server'"
+------------------+------------+-------------+--------+-----------+
| _key             | node_id    | node_label  | status | node_type |
+==================+============+=============+========+===========+
| server_001       | server_001 | Web Server  | active | server    |
+------------------+------------+-------------+--------+-----------+
| server_002       | server_002 | DB Server   | active | server    |
+------------------+------------+-------------+--------+-----------+

Total results: 2
- Following is the syntax for graphdb query with sorting and limit
rdac graphdb query nodes --database my_topology_db --query "*" --sortby node_label --order asc --max-rows 10
+------------------+------------+-------------+--------+
| _key             | node_id    | node_label  | status |
+==================+============+=============+========+
| router_001       | router_001 | Core Router | active |
+------------------+------------+-------------+--------+
| server_002       | server_002 | DB Server   | active |
+------------------+------------+-------------+--------+
| server_001       | server_001 | Web Server  | active |
+------------------+------------+-------------+--------+

Total results: 3
- Following is the syntax for graphdb query with JSON output
[
  {
    "_key": "server_001",
    "_id": "nodes/server_001",
    "node_id": "server_001",
    "node_label": "Web Server",
    "status": "active"
  },
  {
    "_key": "server_002",
    "_id": "nodes/server_002",
    "node_id": "server_002",
    "node_label": "DB Server",
    "status": "active"
  }
]
Sub Command: graph-query
Description: Execute an AQL (ArangoDB Query Language) query against GraphDB
usage: graphdb graph-query [-h] --database DATABASE_NAME [--query QUERY] [--query-file QUERY_FILE]
                           [--json] [--limit LIMIT]

optional arguments:
  -h, --help            show this help message and exit
  --database DATABASE_NAME
                        Database name
  --query QUERY         AQL query string
  --query-file QUERY_FILE
                        File containing AQL query
  --json                Output in JSON format (default: table)
  --limit LIMIT         Limit number of results displayed
- Following is the syntax for graphdb graph-query with inline AQL
+------------------+------------+-------------+--------+
| _key             | node_id    | node_label  | status |
+==================+============+=============+========+
| server_001       | server_001 | Web Server  | active |
+------------------+------------+-------------+--------+
| server_002       | server_002 | DB Server   | active |
+------------------+------------+-------------+--------+

Total results: 2
- Following is the syntax for graphdb graph-query with graph traversal
rdac graphdb graph-query --database my_topology_db \
    --query "FOR v, e, p IN 1..3 OUTBOUND 'nodes/server_001' GRAPH 'topology_graph' RETURN {vertex: v, edge: e, path: p}"
+------------------+------------------+------------------+
| vertex           | edge             | path             |
+==================+==================+==================+
| {_key: db_001}   | {_from: ...}     | {vertices: ...}  |
+------------------+------------------+------------------+

Total results: 1
- Following is the syntax for graphdb graph-query with query file
First, create a query file:
cat > /tmp/my_query.aql << 'EOF'
FOR node IN nodes
    FILTER node.status == 'active'
    FOR connected IN 1..2 OUTBOUND node GRAPH 'topology_graph'
        RETURN {
            source: node.node_label,
            target: connected.node_label
        }
EOF
Then execute:
+-------------+-------------+
| source      | target      |
+=============+=============+
| Web Server  | DB Server   |
+-------------+-------------+
| Web Server  | Cache       |
+-------------+-------------+

Total results: 2
- Following is the syntax for graphdb graph-query with limit and JSON output
rdac graphdb graph-query --database my_topology_db \
    --query "FOR doc IN nodes RETURN doc" \
    --limit 5 --json
[
  {
    "_key": "server_001",
    "_id": "nodes/server_001",
    "node_id": "server_001",
    "node_label": "Web Server",
    "status": "active"
  }
]
Note
AQL (ArangoDB Query Language) is a powerful query language for graph traversals, joins, filtering, and aggregations. Use --query-file for complex multi-line queries.
Sub Command: insert-nodes
Description: Insert nodes into a collection from CSV or JSON file
usage: graphdb insert-nodes [-h] --database DATABASE_NAME [--key-column KEY_COLUMN]
                            [--batch-size BATCH_SIZE] [--on-duplicate {update,replace,ignore}]
                            [--halt-on-error]
                            collection_name file_path

positional arguments:
  collection_name       Name of the node collection
  file_path             Path to CSV or JSON file containing node data

optional arguments:
  -h, --help            show this help message and exit
  --database DATABASE_NAME
                        Database name
  --key-column KEY_COLUMN
                        Column name to use as node key (default: node_id)
  --batch-size BATCH_SIZE
                        Batch size for bulk insert (default: 100)
  --on-duplicate {update,replace,ignore}
                        Action on duplicate keys (default: update)
  --halt-on-error       Halt on first error
- Sample CSV file for nodes (
nodes.csv):
node_id,node_label,node_type,status,ip_address
server_001,Web Server,server,active,10.0.0.1
server_002,DB Server,server,active,10.0.0.2
router_001,Core Router,router,active,10.0.0.254
switch_001,Access Switch,switch,active,10.0.0.100
- Following is the syntax for graphdb insert-nodes
Loading data from nodes.csv...
Loaded 4 rows
Inserting nodes into collection 'nodes'...
Successfully inserted/updated 4 nodes
- Following is the syntax for graphdb insert-nodes with custom key column
Loading data from devices.csv...
Loaded 10 rows
Inserting nodes into collection 'devices'...
Successfully inserted/updated 10 nodes
- Following is the syntax for graphdb insert-nodes with batch size and duplicate handling
rdac graphdb insert-nodes nodes large_nodes.csv --database my_topology_db \
    --batch-size 500 \
    --on-duplicate replace
Loading data from large_nodes.csv...
Loaded 5000 rows
Inserting nodes into collection 'nodes'...
Successfully inserted/updated 5000 nodes
- Following is the syntax for graphdb insert-nodes from JSON file
Loading data from nodes.json...
Loaded 4 rows
Inserting nodes into collection 'nodes'...
Successfully inserted/updated 4 nodes
| Parameter | Description |
|---|---|
--key-column |
Specifies which column to use as the document _key in ArangoDB (default: node_id) |
--batch-size |
Number of documents to insert per batch (default: 100). Increase for large datasets. |
--on-duplicate |
Action when a document with the same key exists: update, replace, or ignore |
--halt-on-error |
Stop processing on first error instead of continuing with remaining documents |
Sub Command: insert-edges
Description: Insert edges into a collection from CSV or JSON file
usage: graphdb insert-edges [-h] --database DATABASE_NAME [--left-id-column LEFT_ID_COLUMN]
                            [--right-id-column RIGHT_ID_COLUMN] [--batch-size BATCH_SIZE]
                            [--edge-key-attrs EDGE_KEY_ATTRS] [--sort-on-key]
                            [--on-duplicate {update,replace,ignore}] [--halt-on-error]
                            nodes_collection edges_collection file_path

positional arguments:
  nodes_collection      Name of the node collection that edges connect
  edges_collection      Name of the edge collection
  file_path             Path to CSV or JSON file containing edge data

optional arguments:
  -h, --help            show this help message and exit
  --database DATABASE_NAME
                        Database name
  --left-id-column LEFT_ID_COLUMN
                        Column name for source node ID (default: left_id)
  --right-id-column RIGHT_ID_COLUMN
                        Column name for target node ID (default: right_id)
  --batch-size BATCH_SIZE
                        Batch size for bulk insert (default: 100)
  --edge-key-attrs EDGE_KEY_ATTRS
                        Comma-separated list of edge attributes to include in key generation
  --sort-on-key         Sort key components before generating hash
  --on-duplicate {update,replace,ignore}
                        Action on duplicate keys (default: update)
  --halt-on-error       Halt on first error
- Sample CSV file for edges (
edges.csv):
left_id,right_id,relationship_type,bandwidth,latency_ms
server_001,server_002,connects_to,1000,1
server_001,router_001,connects_to,1000,2
router_001,switch_001,connects_to,10000,0.5
- Following is the syntax for graphdb insert-edges
rdac graphdb insert-edges nodes relationships edges.csv --database my_topology_db
Example Output
Loading data from edges.csv...
Loaded 3 rows
Inserting edges into collection 'relationships'...
Successfully inserted/updated 3 edges
- Following is the syntax for graphdb insert-edges with custom ID columns
rdac graphdb insert-edges nodes relationships edges.csv --database my_topology_db \
    --left-id-column source_node \
    --right-id-column target_node
Example Output
Loading data from edges.csv...
Loaded 3 rows
Inserting edges into collection 'relationships'...
Successfully inserted/updated 3 edges
- Following is the syntax for graphdb insert-edges with edge key attributes
rdac graphdb insert-edges nodes relationships edges.csv --database my_topology_db \
    --edge-key-attrs relationship_type,bandwidth \
    --sort-on-key
Loading data from edges.csv...
Loaded 3 rows
Inserting edges into collection 'relationships'...
Successfully inserted/updated 3 edges
- Following is the syntax for graphdb insert-edges with batch size and duplicate handling
rdac graphdb insert-edges nodes relationships large_edges.csv --database my_topology_db \
    --batch-size 500 \
    --on-duplicate update \
    --halt-on-error
Loading data from large_edges.csv...
Loaded 10000 rows
Inserting edges into collection 'relationships'...
Successfully inserted/updated 10000 edges
| Parameter | Description |
|---|---|
--left-id-column |
Column name containing source node IDs (default: left_id) |
--right-id-column |
Column name containing target node IDs (default: right_id) |
--edge-key-attrs |
Additional columns to include in edge key generation for uniqueness |
--sort-on-key |
Sort key components before hashing (ensures consistent keys regardless of attribute order) |
--batch-size |
Number of edges to insert per batch (default: 100). Increase for large datasets. |
--on-duplicate |
Action when an edge with the same key exists: update, replace, or ignore |
--halt-on-error |
Stop processing on first error instead of continuing with remaining edges |
Note
The nodes_collection parameter specifies which node collection the edges reference. Edge documents will have _from and _to fields automatically set to {nodes_collection}/{left_id} and {nodes_collection}/{right_id} respectively.
Sub Command: healthcheck
Description: Perform healthcheck on each of the Pods
Usage: healthcheck  [-h] [--json] [--type POD_TYPE] [--infra] [--apps] [--simple]

optional arguments:
  -h, --help       show this help message and exit
  --json           Print detailed information in JSON format instead of
                   tabular format
  --type POD_TYPE  Show only the pods that match the specified pod type
  --infra          List only RDA Infra pods. not compatible with --apps option
  --apps           List only RDA App pods. not compatible with --infra option
  --simple         When showing in tabular format, show in a easy to read
                   format.
Sub Command: invoke-agent-bot
Description: Invoke a bot published by an agent
Usage: invoke-agent-bot  [-h] --type AGENT_TYPE --group AGENT_GROUP --bot BOT_NAME
            [--query QUERY] [--input INPUT_FILE] [--output OUTPUT_FILE]

optional arguments:
  -h, --help            show this help message and exit
  --type AGENT_TYPE     Agent type
  --group AGENT_GROUP   Agent group
  --bot BOT_NAME        Bot name
  --query QUERY         Bot Query (CFXQL)
  --input INPUT_FILE    Input Dataframe (CSV File)
  --output OUTPUT_FILE  Output Dataframe (CSV File)
Sub Command: jobs
Description: List all jobs for the current tenant
usage: rdac [-h] [--json] [--all] [--pipeline_name PIPELINE_NAME]

optional arguments:
  -h, --help            show this help message and exit
  --json                Print detailed information in JSON format instead of
                        tabular format
  --all                 Retrieve all jobs not just active jobs
  --pipeline_name PIPELINE_NAME
                        Get all jobs for given pipeline name
2023-01-09:05:58:09 [1] INFO nats_client Saving NATS certificate to file: /tmp/nats_cert_custom_461dedd908ef2d75e509377dfe35be02_1.pem
worker pipeline name: oia-new-incidents-to-snowv2
+--------------+----------+----------------------------------+-------+---------------------+-----------------+-----------------------------+--------------+----------+
| Host         | Pod ID   | Job ID                           |   PID | Created             | Age             | Pipeline                    | Status       | Reason   |
|--------------+----------+----------------------------------+-------+---------------------+-----------------+-----------------------------+--------------+----------|
| 05969789d903 | 88c26bbe | 5c93dc55cfd84586921aad41b9e7358e |   761 | 2023-01-07T14:00:03 | 1 day, 15:58:06 | oia-new-incidents-to-snowv2 | Initializing |          |
| 05969789d903 | 88c26bbe | f0f1d6a240cb45fabf3e65f0c4eb9cfe |  1605 | 2023-01-07T14:35:02 | 1 day, 15:23:07 | oia-new-incidents-to-snowv2 | Initializing |          |
| 05969789d903 | 88c26bbe | 384acd9ef4c240aa88c629a75523bc56 |  2352 | 2023-01-07T15:05:02 | 1 day, 14:53:07 | oia-new-incidents-to-snowv2 | Initializing |          |
| 05969789d903 | 88c26bbe | 84d8547509c94a4eaf695c57aa139506 | 17718 | 2023-01-08T01:30:02 | 1 day, 4:28:07  | oia-new-incidents-to-snowv2 | Initializing |          |
| 05969789d903 | 88c26bbe | 58848c8d5a7e4c54a08e01d25155f22e | 18097 | 2023-01-08T01:45:01 | 1 day, 4:13:08  | oia-new-incidents-to-snowv2 | Initializing |          |
| 05969789d903 | 88c26bbe | 32faf9f9ba2445b4b1cc2fb625538f35 | 19080 | 2023-01-08T02:25:02 | 1 day, 3:33:07  | oia-new-incidents-to-snowv2 | Initializing |          |
| 05969789d903 | 88c26bbe | b5dc599ce659485f9139242d05c9875e | 23632 | 2023-01-08T05:30:02 | 1 day, 0:28:07  | oia-new-incidents-to-snowv2 | Initializing |          |
| 05969789d903 | 88c26bbe | fd361ae94358405cbb9f2ac1d75c142c | 39213 | 2023-01-08T14:20:02 | 15:38:07        | oia-new-incidents-to-snowv2 | Initializing |          |
| 05969789d903 | 88c26bbe | 07da31424e18492e976db4451ce82252 | 44773 | 2023-01-08T18:05:02 | 11:53:07        | oia-new-incidents-to-snowv2 | Initializing |          |
| 05969789d903 | 88c26bbe | f332d5c0055f43839dffd906c04fb842 | 50985 | 2023-01-08T22:20:01 | 7:38:08         | oia-new-incidents-to-snowv2 | Initializing |          |
| 05969789d903 | 88c26bbe | 43b00217d5854d4cb5ab7497929b8369 | 57340 | 2023-01-09T03:30:03 | 2:28:06         | oia-new-incidents-to-snowv2 | Initializing |          |
| 05969789d903 | 88c26bbe | 78ab3c2492aa4781820c0be9013cc6d9 | 59707 | 2023-01-09T05:25:02 | 0:33:07         | oia-new-incidents-to-snowv2 | Initializing |          |
+--------------+----------+----------------------------------+-------+---------------------+-----------------+-----------------------------+--------------+----------+
Sub Command: library
Following are the valid Sub-Commands for the library
Sub Commands |
Description |
|---|---|
| upload | Upload a RDA library to object store |
| list | Compare libraries in object store with installed versions |
| install | Install libraries on worker (use --libraries all for all newer) |
| delete | Delete libraries from object store |
Commands to manage RDA libraries for worker containers

Following are valid sub-commands for library:
  upload                    Upload a RDA library to object store
  list                      Compare libraries in object store with installed versions
  install                   Install libraries on worker (use --libraries all for all newer)
  delete                    Delete libraries from object store (--libraries file1.tar.gz file2.whl)
Sub Command: upload
Description: Upload a RDA library package file (.whl or .tar.gz) to the object store. The filename must begin with cfxdx or rda.
usage: rdac [-h] --file FILE_PATH

options:
  -h, --help        show this help message and exit
  --file FILE_PATH  Path to the RDA library package file (e.g. .tar.gz, .whl)
- Following is the syntax for library upload
Uploading cfxdx_ext_qa_test-26.5.14.1-py312-none-any.whl to rda_packages/cfxdx_ext_qa_test-26.5.14.1-py312-none-any.whl...
Successfully uploaded cfxdx_ext_qa_test-26.5.14.1-py312-none-any.whl to object store
Sub Command: list
Description: List libraries in the object store and compare with installed versions on each worker pod. Either --pod-ids or --site is required.
usage: rdac [-h] --pod-type POD_TYPE [--pod-ids POD_IDS [POD_IDS ...]]
            [--site SITE] [--cfxql-query CFXQL_QUERY] [--wait WAIT_SECONDS]
            [--json]

options:
  -h, --help            show this help message and exit
  --pod-type POD_TYPE   Pod type to query (e.g. worker)
  --pod-ids POD_IDS [POD_IDS ...]
                        Query only pods with the specified pod IDs
  --site SITE           Query only pods whose site (WORKER_GROUP) matches the
                        given regex
  --cfxql-query CFXQL_QUERY
                        Optional cfxql expression to further filter the
                        resolved pods
  --wait WAIT_SECONDS   Seconds to wait for responses from worker nodes
                        (default: 30)
  --json                Output in JSON format
- Following is the syntax for library list
Waiting up to 30s for 1 worker pod(s)...

Received responses from 1/1 worker pod(s):

Pod: 0b0e6e3d   Hostname: 3ac14075f1cd   Site: rda-site-01
Package            Filename                                          Patch Version    Installed Version    Status
-----------------  ------------------------------------------------  ---------------  -------------------  -------------
cfxdx-ext-qa-test  cfxdx_ext_qa_test-26.5.14.1-py312-none-any.whl   26.5.14.1        -                    NOT INSTALLED

Note: Run 'rdac worker restart' after installing newer libraries for changes to take effect.
The Status column can contain the following values:
| Status | Meaning |
|---|---|
| NOT INSTALLED | Library is in the object store but has not yet been staged or installed on this pod |
| UP TO DATE | Installed version matches the version in the object store |
| PATCH AVAILABLE | A newer version exists in the object store |
- Following is the syntax for library list with JSON output
Waiting up to 30s for 1 worker pod(s)...
[
  {
    "pod_id": "0b0e6e3d",
    "hostname": "3ac14075f1cd",
    "site_name": "rda-site-01",
    "rows": [
      {
        "package": "cfxdx-ext-qa-test",
        "filename": "cfxdx_ext_qa_test-26.5.14.1-py312-none-any.whl",
        "objectstore_version": "26.5.14.1",
        "installed_version": "",
        "status": "NOT INSTALLED"
      }
    ]
  }
]
Note
The summary line Received responses from N/M indicates how many target pods responded. If N < M, verify that the missing pods are reachable using rdac pod-controller status.
Sub Command: install
Description: Stage library files into a worker pod's /rda_packages directory. Libraries are staged but not activated until the worker is restarted with rdac pod-controller restart. Either --pod-ids or --site is required.
usage: rdac [-h] --libraries LIBRARIES [LIBRARIES ...] --pod-type POD_TYPE
            [--pod-ids POD_IDS [POD_IDS ...]] [--site SITE]
            [--cfxql-query CFXQL_QUERY] [--wait WAIT_SECONDS]

options:
  -h, --help            show this help message and exit
  --libraries LIBRARIES [LIBRARIES ...]
                        Library package names to install (use 'all' to install
                        all newer libraries)
  --pod-type POD_TYPE   Pod type whose container should receive the staged
                        libraries (e.g. worker)
  --pod-ids POD_IDS [POD_IDS ...]
                        Install on pods with the specified pod IDs
  --site SITE           Install on pods whose site matches the given regex
  --cfxql-query CFXQL_QUERY
                        Optional cfxql expression to further filter the
                        resolved pods
  --wait WAIT_SECONDS   Seconds to wait for responses from worker nodes
                        (default: 300)
- Following is the syntax for library install
rdac library-install --pod-type worker --site rda-site-01 --libraries cfxdx_ext_qa_test-26.5.14.1-py312-none-any.whl
Waiting up to 300s for 1 worker pod(s)...

Received responses from 1/1 worker pod(s):

Pod ID    Hostname      Filename                                          Status    Message
--------  ------------  ------------------------------------------------  --------  -------------------------------------------------------------------
0b0e6e3d  3ac14075f1cd  cfxdx_ext_qa_test-26.5.14.1-py312-none-any.whl   STAGED    Copied to /rda_packages; run 'rdac pod-controller restart' to apply

Note: Libraries were staged into the worker's /rda_packages directory.
Run 'rdac pod-controller restart' to apply them on the next worker startup.
Note
Status = STAGED means the file has been copied to the worker's /rda_packages directory. Use --libraries all to stage every library from the object store that is newer than the currently installed version. The library does not take effect until rdac pod-controller restart is run for the pod.
Sub Command: delete
Description: Delete one or more library files from the object store. Previously staged copies inside worker containers are not affected.
usage: rdac [-h] --libraries LIBRARIES [LIBRARIES ...]

options:
  -h, --help            show this help message and exit
  --libraries LIBRARIES [LIBRARIES ...]
                        Library filenames to delete from minio
- Following is the syntax for library delete
Deleted cfxdx_ext_qa_test-26.5.14.1-py312-none-any.whl

Library                                           Status
------------------------------------------------  --------
cfxdx_ext_qa_test-26.5.14.1-py312-none-any.whl   DELETED
Sub Command: logarchive-add-platform
Description: Add current platform Minio as logarchive repository
Usage: logarchive-add-platform  [-h] --repo REPO --prefix OBJECT_PREFIX
            [--retention RETENTION_DAYS]

optional arguments:
  -h, --help            show this help message and exit
  --repo REPO           Log archive repository name to be created
  --prefix OBJECT_PREFIX
                        Object prefix to be used for the archive
  --retention RETENTION_DAYS
                        Data retention period in number of days. If not
                        specified, RDA will not manage the data retention.
Sub Command: logarchive-data-read
Description: Read the data from given archive for a specified time interval
Usage: logarchive-data-read  [-h] --repo REPO --name ARCHIVE_NAME [--from TIMESTAMP]
            [--minutes MINUTES] [--max_rows MAX_ROWS] [--speed SPEED] [--line]

optional arguments:
  -h, --help           show this help message and exit
  --repo REPO          Log archive repository name
  --name ARCHIVE_NAME  Name of the log archive within the repository
  --from TIMESTAMP     From Date & time in text format (ex: ISO format).
                       Timezone must be UTC. If not specified, it will use
                       current time minus specified minutes
  --minutes MINUTES    Number of minutes from specified date & time. Default
                       is 15
  --max_rows MAX_ROWS  If value is specified > 0, stop after reading max_rows
                       from the archive
  --speed SPEED        Replay speed. 0 means no delay, 1.0 means closer to
                       original rate, < 1.0 means slower, > 1.0 means faster
  --line               Instead of JSON format, print one message per line
Sub Command: logarchive-data-size
Description: Show size of data available for given archive for a specified time interval
Usage: logarchive-data-size  [-h] --repo REPO --name ARCHIVE_NAME [--from TIMESTAMP]
            [--minutes MINUTES] [--json]

optional arguments:
  -h, --help           show this help message and exit
  --repo REPO          Log archive repository name
  --name ARCHIVE_NAME  Name of the log archive within the repository
  --from TIMESTAMP     From Date & time in text format (ex: ISO format).
                       Timezone must be UTC. If not specified, it will use
                       current time minus specified minutes
  --minutes MINUTES    Number of minutes from specified date & time. Default
                       is 15
  --json               Print detailed information in JSON format instead of
                       tabular format
Sub Command: logarchive-download
Description: Download the data from given archive for a specified time interval
Usage: logarchive-download  [-h] --repo REPO --name ARCHIVE_NAME [--from TIMESTAMP]
            [--minutes MINUTES] --out OUTPUT_DIR [--flatten]

optional arguments:
  -h, --help           show this help message and exit
  --repo REPO          Log archive repository name
  --name ARCHIVE_NAME  Name of the log archive within the repository
  --from TIMESTAMP     From Date & time in text format (ex: ISO format).
                       Timezone must be UTC. If not specified, it will use
                       current time minus specified minutes
  --minutes MINUTES    Number of minutes from specified date & time. Default
                       is 15
  --out OUTPUT_DIR     Output directory where to save the downloaded data
  --flatten            Flatten directory structure of the files, which
                       otherwise stores in yyyy/mm/dd/HH/MM/ directory
                       structure
Sub Command: logarchive-names
Description: List archive names in a given repository
Usage: logarchive-names  [-h] --repo REPO [--json]

optional arguments:
  -h, --help   show this help message and exit
  --repo REPO  Name of the log archive repository
  --json       Print detailed information in JSON format instead of tabular
               format
Sub Command: logarchive-replay
Description: Replay the data from given archive for a specified time interval with specified label
Usage: logarchive-replay  [-h] --repo REPO --name ARCHIVE_NAME [--from TIMESTAMP]
            [--minutes MINUTES] [--max_rows MAX_ROWS] [--speed SPEED]
            [--batch_size BATCH_SIZE] --stream STREAM [--label LABEL] --site
            SITE

optional arguments:
  -h, --help            show this help message and exit
  --repo REPO           Log archive repository name
  --name ARCHIVE_NAME   Name of the log archive within the repository
  --from TIMESTAMP      From Date & time in text format (ex: ISO format).
                        Timezone must be UTC. If not specified, it will use
                        current time minus specified minutes
  --minutes MINUTES     Number of minutes from specified date & time. Default
                        is 15
  --max_rows MAX_ROWS   If value is specified > 0, stop after reading max_rows
                        from the archive
  --speed SPEED         Replay speed. 0 means no delay, 1.0 means closer to
                        original rate, < 1.0 means slower, > 1.0 means faster
  --batch_size BATCH_SIZE
                        Number of rows to return for each iteration
  --stream STREAM       Name of the stream to write to
  --label LABEL         Label for the replay job
  --site SITE           Site name to run this on a worker
Sub Command: logarchive-repos
Description: List of all log archive repositories
Usage: logarchive-repos  [-h] [--json]

optional arguments:
  -h, --help  show this help message and exit
  --json      Print detailed information in JSON format instead of tabular
              format
- Following is the syntax for logarchive-repos
+-------------------+--------------------+------------------------------------------+-----------------+
| Repository Name   | Endpoint           | Bucket Name                              | Object Prefix   |
|-------------------+--------------------+------------------------------------------+-----------------|
| demo_logarchive   | 10.95.122.127:9443 | tenants.ae144f67d2a24034ad6920ace6809763 | demo_logs/      |
+-------------------+--------------------+------------------------------------------+-----------------+
Sub Command: merge-logarchive-files
Description: Merge multiple locally downloaded Log Archive (.gz) filles into a single CSV/Parquet file
Usage: merge-logarchive-files  [-h] --folder FOLDER --tofile TOFILE [--sample SAMPLE_RATE]
            [--ts TIMESTAMP]

optional arguments:
  -h, --help            show this help message and exit
  --folder FOLDER       Path to the folder where locally downloaded .gz files
                        are available
  --tofile TOFILE       Save the output to specified file
  --sample SAMPLE_RATE  Data sample rate must be >0 and <= 1.0
  --ts TIMESTAMP        Timestamp column, if specified will sort the data
                        after merge
Sub Command: object
Description: RDA Object management commands
Following are the valid Sub-Commands for the object
Sub Commands |
Description |
|---|---|
| list | List objects from the object store |
| get | Download a object from the object store |
| meta | Download metadata for an object from the object store |
| add | Add a new object to the object store |
| delete | Delete object from the object store |
| to-file | Convert object pointers from a column into file |
| to-content | Convert object pointers from a column into content |
| delete-list | Delete list of objects |
RDA Object management commands

Following are valid sub-commands for object:
  list                      List objects from the object store
  get                       Download a object from the object store
  meta                      Download metadata for an object from the object store
  add                       Add a new object to the object store
  delete                    Delete object from the object store
  to-file                   Convert object pointers from a column into file
  to-content                Convert object pointers from a column into content
  delete-list               Delete list of objects
Sub Command: object-add
Description: Add a new object to the object store
Usage: object-add  [-h] --name NAME --folder FOLDER --file INPUT_FILE
            [--descr DESCRIPTION] [--overwrite OVERWRITE]

optional arguments:
  -h, --help            show this help message and exit
  --name NAME           Object name
  --folder FOLDER       Folder name on the object storage
  --file INPUT_FILE     file from which object will be added
  --descr DESCRIPTION   Description
  --overwrite OVERWRITE
                        If file already exists, overwrite without prompting.
                        Accepted values (yes/no)
Sub Command: object-delete
Description: Delete object from the object store
Usage: object-delete  [-h] --name NAME --folder FOLDER

optional arguments:
  -h, --help       show this help message and exit
  --name NAME      Object name
  --folder FOLDER  Folder name on the object storage
- Following is the syntax for object-get
Sub Command: object-delete-list
Description: Delete list of objects
Usage: object-delete-list  [-h] --inpcol INPUT_OBJECT_COLUMN --file INPUT_FILE --outfile
            OUTPUT_FILE

optional arguments:
  -h, --help            show this help message and exit
  --inpcol INPUT_OBJECT_COLUMN
                        Column with object names
  --file INPUT_FILE     Input csv filename
  --outfile OUTPUT_FILE
                        Name of output csv file that has result for deletion
Sub Command: object-get
Description: Download a object from the object store
usage: rdac [-h] --name NAME --folder FOLDER [--tofile SAVE_TO_FILE]
            [--todir SAVE_TO_DIR]

optional arguments:
  -h, --help            show this help message and exit
  --name NAME           Object name
  --folder FOLDER       Folder name on the object storage
  --tofile SAVE_TO_FILE
                        Save the downloaded object to specified file
  --todir SAVE_TO_DIR   Save the downloaded object to specified directory
- Following is the syntax for object-get
Sub Command: object-list
Description: List objects from the object store
usage: rdac [-h] [--folder FOLDER] [--json]
optional arguments:
-h, --help show this help message and exit
--folder FOLDER Folder name on the object storage
--json Print detailed information in JSON format instead of
tabular format
- Following is the syntax for object-list
folder name description file_type file_size saved_time
----------------- ------------- ------------- ----------- ----------- --------------------------
testobj-folder testobject testobjct csv 15303849 2023-01-09T06:12:03.413276
testobj-foldernew testobjectnew testobjctnew csv 15303849 2023-01-09T06:12:55.904404
Sub Command: object-meta
Description: Download metadata for an object from the object store
Usage: object-meta [-h] --name NAME --folder FOLDER
optional arguments:
-h, --help show this help message and exit
--name NAME Dataset name
--folder FOLDER Folder name on the object storage
{
"name": "testobject",
"folder": "testobj-folder",
"description": "testobjct",
"saved_time": "2023-01-09T06:12:03.413276",
"data_path": "rda-objects/data/testobj-folder/6f44d574-testobject.data",
"file_type": "csv",
"file_size": 15303849
}
Sub Command: object-to-content
Description: Convert object pointers from a column into content
Usage: object-to-content [-h] --inpcol INPUT_OBJECT_COLUMN --outcol OUTPUT_COLUMN --file
INPUT_FILE --outfile OUTPUT_FILE
optional arguments:
-h, --help show this help message and exit
--inpcol INPUT_OBJECT_COLUMN
Name of the column in input that contains the object
name
--outcol OUTPUT_COLUMN
Column name where content will be inserted
--file INPUT_FILE Input csv file
--outfile OUTPUT_FILE
Name of output csv file that has content inserted
Sub Command: object-to-file
Description: Convert object pointers from a column into file
usage: rdac [-h] --inpcol INPUT_OBJECT_COLUMN --outcol OUTPUT_COLUMN --file
INPUT_FILE --outfile OUTPUT_FILE
optional arguments:
-h, --help show this help message and exit
--inpcol INPUT_OBJECT_COLUMN
Name of the column in input that contains the objects
--outcol OUTPUT_COLUMN
Column name where filenames need to be inserted
--file INPUT_FILE Input csv file
--outfile OUTPUT_FILE
Name of output csv file that has filename inserted
Sub Command: output
Description: Get the output of a Job using jobid.
Usage: output [-h] --jobid JOBID [--tofile SAVE_TO_FILE] [--format DATA_FORMAT]
[--viz]
optional arguments:
-h, --help show this help message and exit
--jobid JOBID Job ID (either partial or complete)
--tofile SAVE_TO_FILE
Save the data to the specified file (CSV)
--format DATA_FORMAT Format for the saved file. Valid values are auto, csv,
json, parquet. If 'auto' format will be determined
from extension
--viz Open Dataframe visualizer to show the data
Sub Command: pack
Description: Commands to manage RDA Packages
Following are valid sub-commands for pack
Sub Commands |
Description |
|---|---|
| upload | Upload RDA Pack |
| remove | Remove RDA Pack |
| list | List RDA Packs |
| activate | Activate RDA Pack and deploy corresponding common artifacts |
| enable-single-tenant | Enable RDA Pack single tenant and deploy single tenant scoped artifacts |
| enable-customer | Enable RDA Pack for a customer and deploy customer scoped artifacts |
| deactivate | Deactivate RDA Pack and delete corresponding common artifacts |
| disable-customer | Disable RDA Pack for a customer and delete customer scoped artifacts |
| disable-single-tenant | Disable RDA Pack for single tenant and delete single tenant scoped artifacts |
| compare | Compare a pack against the deployed artifacts or another pack |
| create | Create a RDA Pack |
Following are valid sub-commands for pack:
upload Upload RDA Pack
remove Remove RDA Pack
list List RDA Packs
activate Activate RDA Pack and deploy corresponding common artifacts
enable-single-tenant Enable RDA Pack single tenant and deploy single tenant scoped artifacts
enable-customer Enable RDA Pack for a customer and deploy customer scoped artifacts
deactivate Deactivate RDA Pack and delete corresponding common artifacts
disable-customer Disable RDA Pack for a customer and delete customer scoped artifacts
disable-single-tenant Disable RDA Pack for single tenant and delete single tenant scoped artifacts
compare Compare a pack against the deployed artifacts or another pack.
create Create a RDA Pack.
Sub Command: upload
Description: Upload RDA Pack
usage: pack [-h] --file TAR_PATH
options:
-h, --help show this help message and exit
--file TAR_PATH Path to the tar.gz file that contains rda pack bundle
To upload a tar.gz file using the upload subcommand, run the following command
Sub Command: remove
Description: remove RDA Pack
usage: pack [-h] --name PACK_NAME [--version PACK_VERSION]
options:
-h, --help show this help message and exit
--name PACK_NAME Name of the pack to remove
--version PACK_VERSION
Version of the pack to remove. If not passed, all the
versions of the pack are removed.
To delete an existing pack, use the remove subcommand along with the pack name and version
Sub Command: list
Description: List RDA Packs
usage: pack [-h] [--name PACK_NAME] [--json]
options:
-h, --help show this help message and exit
--name PACK_NAME Name of the pack to list. By default, all packs are listed
--json Print detailed information in JSON format instead of
tabular format
Example 1 Listing All RDA Packs"
To list all available RDA packs, use the list subcommand without any filters:
id name version
-- ---------------------------------- ---------------------------------- ---------
0 june9_pipeline june9_pipeline 1.0.0
Example 2 Listing a Specific RDA Pack
To list details of a specific RDA pack by name:
Example 3 Listing a Specific RDA Pack in JSON Format
To list a specific RDA pack and get the output in JSON format:
Sub Command: activate
Description: Activate RDA Pack and deploy corresponding common artifacts
usage: pack [-h] --name PACK_NAME --version PACK_VERSION [--inputs INPUTS_STR]
[--json]
options:
-h, --help show this help message and exit
--name PACK_NAME Name of the pack to activate.
--version PACK_VERSION
Version of the pack to activate.
--inputs INPUTS_STR Input values in json format to be passed to pack
deployment
--json Print detailed information in JSON format instead of
tabular format
To activate an RDA Pack and deploy the corresponding common artifacts, use the activate subcommand. You can also include the --json flag to receive a structured JSON output.
[
{
"type": "credential",
"name": "oia",
"status": "Success"
},
{
"type": "credential",
"name": "agent",
"status": "Skipped"
},
{
"type": "pipeline",
"name": "metric_data_collection",
"pipeline_version": "2025.04.17.2",
"status": "Success"
},
{
"type": "blueprint",
"name": "Metric Data Collection for IRM",
"blueprint_id": "metric-data-collection-for-irm",
"status": "Success"
}
]
Sub Command: deactivate
Description: Deactivate RDA Pack and delete corresponding common artifacts
usage: pack [-h] --name PACK_NAME --version PACK_VERSION [--force]
options:
-h, --help show this help message and exit
--name PACK_NAME Name of the pack to deactivate.
--version PACK_VERSION
Version of the pack to deactivate.
--force Force remove the artifacts even if the pack is not
completely deployed
To deactivate a specific RDA Pack and delete the associated common artifacts, use the deactivate subcommand:
Done deleting pipeline
Done deleting pipeline
Done deleting pipeline
Done deleting pipeline
Done deleting pipeline
Deactivated pack Fabrix AIOps Fault Management Base 9.0.0
Note
Use –force when Pack needs to be deactivated forcefully.
Sub Command: enable-single-tenant
Description: Enable RDA Pack single tenant and deploy single tenant scoped artifacts
usage: pack [-h] --name PACK_NAME --version PACK_VERSION [--inputs INPUTS_STR]
[--json]
options:
-h, --help show this help message and exit
--name PACK_NAME Name of the pack to enable.
--version PACK_VERSION
Version of the pack to enable.
--inputs INPUTS_STR Input values in json format to be passed to pack
deployment
--json Print detailed information in JSON format instead of
tabular format
Example 1 Enabling Single-Tenant for an RDA Pack
To enable single-tenant support and deploy the corresponding scoped artifacts:
0
-- --------------------------------------------------------------------------------------------------------------------
0 {'type': 'blueprint', 'name': 'VMWare vCenter Single Tenant', 'blueprint_id': 'vcenter_vmware', 'status': 'Success'}
Example 2 Enabling Single-Tenant with JSON Output
To enable single-tenant for a pack and view the result in JSON format:
[
{
"type": "blueprint",
"name": "VMWare vCenter Single Tenant",
"blueprint_id": "vcenter_vmware",
"status": "Success"
}
]
Sub Command: disable-single-tenant
Description: Disable RDA Pack for single tenant and delete single tenant scoped artifacts
usage: pack [-h] --name PACK_NAME --version PACK_VERSION [--force]
options:
-h, --help show this help message and exit
--name PACK_NAME Name of the pack to disable single tenant.
--version PACK_VERSION
Version of the pack to disable.
--force Force remove the artifacts even if the pack is not
completely enabled
To disable single-tenant support for a specific RDA Pack and remove the associated scoped artifacts:
Note
Use the --force flag to disable the single-tenant pack and remove artifacts forcefully.
Sub Command: enable-customer
Description: Enable RDA Pack for a customer and deploy customer scoped artifacts
usage: pack [-h] --name PACK_NAME --version PACK_VERSION --customer-tag
CUSTOMER [--inputs INPUTS_STR] [--json]
options:
-h, --help show this help message and exit
--name PACK_NAME Name of the pack to enable.
--version PACK_VERSION
Version of the pack to enable.
--customer-tag CUSTOMER
Customer tag of the customer for which this pack needs
to be enabled.
--inputs INPUTS_STR Input values in json format to be passed to pack
deployment
--json Print detailed information in JSON format instead of
tabular format
To enable a pack for a specific customer and deploy customer-scoped artifacts, use the enable-customer subcommand with the --customer-tag:
0
-- --------------------------------------------------------------------------------------------------------------------------
0 {'type': 'blueprint', 'name': 'cust-OIA_VMWare vCenter 1', 'blueprint_id': 'cust-OIA_vcenter_vmware', 'status': 'Success'}
Sub Command: disable-customer
Description: Disable RDA Pack for a customer and delete customer scoped artifacts
usage: pack [-h] --name PACK_NAME --version PACK_VERSION --customer-tag
CUSTOMER [--force]
options:
-h, --help show this help message and exit
--name PACK_NAME Name of the pack to disable.
--version PACK_VERSION
Version of the pack to disable.
--customer-tag CUSTOMER
Customer tag of the customer for which this pack needs
to be disabled.
--force Force remove the artifacts even if the pack is not
completely enabled
To disable a pack for a specific customer and remove the associated customer-scoped artifacts, use the disable-customer subcommand with the --customer-tag:
Sub Command: compare
Description: Compare a pack against the deployed artifacts or another pack.
usage: pack [-h] --pack_name PACK_NAME --pack_version PACK_VERSION
[--with COMPARE_WITH] [--deploy_type DEPLOY_TYPE]
[--common_vars COMMON_VARS] [--customer_vars CUSTOMER_VARS]
[--single_tenant_vars SINGLE_TENANT_VARS]
[--other_pack_name OTHER_PACK_NAME]
[--other_pack_version OTHER_PACK_VERSION]
[--other_pack_common_vars OTHER_PACK_COMMON_VARS]
[--other_pack_customer_vars OTHER_PACK_CUSTOMER_VARS]
[--other_pack_single_tenant_vars OTHER_PACK_SINGLE_TENANT_VARS]
[--customer_tag CUSTOMER] [--output OUTPUT_FILE] [--json] [--html]
options:
-h, --help show this help message and exit
--pack_name PACK_NAME
Name of the pack that is being compared.
--pack_version PACK_VERSION
Version of the pack that is being compared.
--with COMPARE_WITH Specifies what to compare the pack against. The valid
values are 'deployed' or 'pack'. Default='deployed'.
--deploy_type DEPLOY_TYPE
What artifacts in the pack needs to be compared. Valid
values are customer, or 'single_tenant'. Note: Common
artifacts are always compared.
--common_vars COMMON_VARS
input values in json format that left pack needs for
common artifacts during deployment time.
--customer_vars CUSTOMER_VARS
input values in json format that left pack needs for
customer artifacts during deployment time.
--single_tenant_vars SINGLE_TENANT_VARS
input values in json format that left pack needs for
single tenant artifacts during deployment time.
--other_pack_name OTHER_PACK_NAME
Name of the other pack that is being compared.
--other_pack_version OTHER_PACK_VERSION
Version of the other pack that is being compared.
--other_pack_common_vars OTHER_PACK_COMMON_VARS
input values in json format that right pack needs for
common artifacts during deployment time.
--other_pack_customer_vars OTHER_PACK_CUSTOMER_VARS
input values in json format that right pack needs for
customer artifacts during deployment time.
--other_pack_single_tenant_vars OTHER_PACK_SINGLE_TENANT_VARS
input values in json format that right pack needs for
single tenant artifacts during deployment time.
--customer_tag CUSTOMER
Customer tag to use. This is required if --deploy_type
= 'customer'
--output OUTPUT_FILE Output file name that will contain the comparison
report file (tar.gz format). This is required if
--html is used.
--json Display the comparision report in JSON format.
--html Generates the html comparision report in tar.gz
formats. The file name specified in --output is used.
Example 1 Comparing Two Versions of an RDA Pack and Exporting as tar.gz
To compare two versions of the VMWare vCenter RDA Pack and export the result as an HTML report inside a .tar.gz file:
rdac pack compare --pack_name "VMWare vCenter" --pack_version 9.0.2 \
--with pack --deploy_type single_tenant \
--other_pack_name "VMWare vCenter" --other_pack_version 9.0.1 \
--output vmware_compare.tar.gz --html
Example 2 Comparing Two Versions of an RDA Pack with JSON Output
To compare two versions of the VMWare vCenter pack and view detailed comparison results in JSON format:
rdac pack compare --pack_name "VMWare vCenter" --pack_version 9.0.2 \
--with pack --other_pack_name "VMWare vCenter" --other_pack_version 9.0.1 --json
{
"summary": {
"timestamp": "2025-07-01T07:01:59.549327",
"left_pack_name": "VMWare vCenter",
"left_pack_version": "9.0.2",
"left_pack_common_deploy_vars": "{}",
"left_pack_context_vars": "{}",
"left_pack_customer_deploy_vars": null,
"left_pack_single_tenant_deploy_vars": "{}",
"right_pack_name": "VMWare vCenter",
"right_pack_version": "9.0.1",
"right_pack_common_deploy_vars": "{}",
"right_pack_context_vars": "{}",
"right_pack_customer_deploy_vars": null,
"right_pack_single_tenant_deploy_vars": "{}",
"compare_with": "pack",
"deployment_type": "single_tenant",
"total_count": 34,
"counts": {
"only_in_left": {
"count": 11,
"by_type": {
"dashboards": 11
}
},
"changed": {
"count": 4,
"by_type": {
"pipelines": 2,
"dashboards": 1,
"blueprints": 1
}
},
"unchanged": {
"count": 8,
"by_type": {
"pstreams": 4,
"pipelines": 2,
"stacks": 1,
"credentials": 1
}
},
"only_in_right": {
"count": 11,
"by_type": {
"pstreams": 1,
"dashboards": 10
}
}
}
},
"compare_rows": [
{
"artifact_type": "pstreams",
"artifact_name": "vcenter_vmware_on_boarded_devices",
"artifact_version_left": null,
"artifact_version_right": null,
"definition_file_name": "",
"change_type": "unchanged",
"pack_name_left": "VMWare vCenter",
"pack_version_left": "9.0.2",
"pack_name_right": "VMWare vCenter",
"pack_version_right": "9.0.1",
"checksum_left": "",
"checksum_right": ""
},
{
"artifact_type": "pipelines",
"artifact_name": "vcenter_inventory",
"artifact_version_left": "2024.03.19.1",
"artifact_version_right": "2024.03.19.1",
"definition_file_name": "vcenter_inventory.txt",
"change_type": "changed",
"pack_name_left": "VMWare vCenter",
"pack_version_left": "9.0.2",
"pack_name_right": "VMWare vCenter",
"pack_version_right": "9.0.1",
"checksum_left": "3ffbc7ed03bc0b2fe02a5af69292437d1b6a8682512fe0995847d6bcad708654",
"checksum_right": "cf450c4c38056ddc1c25847559d5de317016ec083093da961856ad4cd0119bd4"
},
{
"artifact_type": "dashboards",
"artifact_name": "vcenter_configure_and_manage",
"artifact_version_left": "24.10.24.1",
"artifact_version_right": "24.10.24.1",
"definition_file_name": "vcenter_configure_and_manage.json",
"change_type": "changed",
"pack_name_left": "VMWare vCenter",
"pack_version_left": "9.0.2",
"pack_name_right": "VMWare vCenter",
"pack_version_right": "9.0.1",
"checksum_left": "26961928e9d84a173e674135c40452d14288acb1e9afabd60e99c23f899e6d18",
"checksum_right": "4de12037022e9a86f04e0de054a1d5a26ee8efa26753760151fc94552af9fb8e"
},
{
"artifact_type": "blueprints",
"artifact_name": "VMWare vCenter Single Tenant",
"artifact_version_left": 2024021201031903,
"artifact_version_right": 2024021201031903,
"definition_file_name": "vcenter_vmware_single_tenant.yaml",
"change_type": "changed",
"pack_name_left": "VMWare vCenter",
"pack_version_left": "9.0.2",
"pack_name_right": "VMWare vCenter",
"pack_version_right": "9.0.1",
"checksum_left": "5d9e047e98c8b8d3c11f5cc7836a0d37e1a06dfb6dbe65a013607fbfcaa82464",
"checksum_right": "37a34977cf4b0f1e63b4a6b298242a293920dea3dbe2363afddd7a8f3edd2581"
}
]
}
Sub Command: create
Description: Create a RDA Pack
usage: pack [-h] --name PACK_NAME --version PACK_VERSION [--upload]
[--artifact_config ARTIFACT_CONFIG]
options:
-h, --help show this help message and exit
--name PACK_NAME Pack name. Must be unique.
--version PACK_VERSION
Pack version. Must be unique.
--upload Uploads the created RDA Pack
--artifact_config ARTIFACT_CONFIG
JSON string specifying artifact backup configuration.
Example: '{"default_artifact_type_backup": false,
"artifact": {"dashboard": {"backup_all": false,
"artifacts": ["topology-details-app-with-
graphdb"]}}}'. If 'default_artifact_type_backup' is
true, all artifact types not listed in 'artifact' will
also be backed up.
Sub Command: pipeline
Description: Pipeline management commands
Following are the valid Sub-Commands for the Pipeline
Sub Commands |
Description |
|---|---|
| list | List published pipelines |
| get-versions | Get versions for the pipeline |
| get | Get pipeline by name and version |
| delete | Delete pipeline by name and version |
| convert-to-json | Convert all pipelines in folder from yaml to json |
| publish | Publish the pipeline on a worker pod |
| published-run | Run a published pipeline on a worker pod |
Following are valid sub-commands for pipeline:
list List published pipelines
get-versions Get versions for the pipeline
get Get pipeline by name and version
delete Delete pipeline by name and version
convert-to-json Convert all pipelines in folder from yaml to json
publish Publish the pipeline on a worker pod
published-run Run a published pipeline on a worker pod
Sub Command: list
Description: Get pipeline by name and version
usage: rdac [-h] [--json]
optional arguments:
-h, --help show this help message and exit
--json Print detailed information in JSON format instead of tabular
format
- Following is the syntax for pipeline-list
category description name saved_time usecase version
----------------------- ------------- -------------------------------------- -------------------------- ------------------------------------------------------------------- -------------
Sub Command: get-versions
Description: Get versions for the pipeline
Usage: pipeline-get-versions [-h] --name NAME [--json]
optional arguments:
-h, --help show this help message and exit
--name NAME Get versions of pipeline specified by name
--json Print detailed information in JSON format instead of tabular
format
- Following is the syntax for pipeline-get-versions
2022_12_09_1
<a name='pipeline-list'></a>
### Sub Command: `pipeline-list`
Description: List published pipelines
```bash
Usage: pipeline-list [-h] [--json]
optional arguments:
-h, --help show this help message and exit
--json Print detailed information in JSON format instead of tabular
format
Sub Command: get
Description: Get pipeline by name and version
usage: rdac [-h] --name NAME --version VERSION [--tofile SAVE_TO_FILE]
[--json]
optional arguments:
-h, --help show this help message and exit
--name NAME Pipeline name
--version VERSION Pipeline version
--tofile SAVE_TO_FILE
Save the downloaded pipeline to specified file
--json Print detailed information in JSON format instead of
tabular format
- Following is the syntax for pipeline-get
{'name': 'regression_metrics_data', 'description': 'test pipeline', 'usecase': '', 'category': '1', 'version': '2022_12_09_1', 'sources': {'files': {'name': 'files', 'type': 'file'}, 'cfxml': {'name': 'cfxml', 'type': 'cfxai_regression'}, 'rn': {'name': 'rn', 'type': 'rn'}}, 'data': {'name': 'regression_metrics_data', 'sequence': [{'tag': '@files:loadfile', 'query': "filename = 'https://docs.fabrix.ai/data/datasets/sample-prometheus-timeseries-data.csv'"}, {'tag': '@cfxml:regression', 'query': "value_column = 'value' and\nts_column = 'timestamp' and\nfrequency = '4H' and\nagg_func = 'mean'"}, {'tag': '@dm:change-time-format', 'query': "columns='timestamp' &\nfrom_format='datetimestr' &\nto_format='%Y-%m-%dT%H:%M:%S'", 'comment': 'Changing time format before writing to stream'}, {'tag': '@rn:write-stream', 'query': 'name = "regression_metrics_data"'}]}, 'artifacts': [{'artifact_type': 'rda-network-stream', 'artifact_name': 'regression_metrics_data', 'access': 'write'}], 'html_data': "\n <style>\n\n .tooltip {\n position: relative;\n display: inline-block;\n border-bottom: 1px dotted black; /* If you want dots under the hoverable text */\n }\n\n /* Tooltip text */\n .tooltip .tooltiptext {\n visibility: hidden;\n width: 120px;\n background-color: black;\n color: #fff;\n text-align: center;\n padding: 5px 0;\n border-radius: 6px;\n \n /* Position the tooltip text - see examples below! */\n position: absolute;\n
Sub Command: delete
Description: Delete pipeline by name and version
Usage: pipeline-delete [-h] --name NAME --version VERSION
optional arguments:
-h, --help show this help message and exit
--name NAME Pipeline name
--version VERSION Version for pipeline
- Following is the syntax for pipeline-delete
2023-01-10:07:37:49 [1] INFO nats_client Creating new SharedPool ...
2023-01-10:07:37:49 [1] INFO nats_client Initiallzing PubMgr for pid=1
2023-01-10:07:37:49 [1] INFO nats_client Saving NATS certificate to file: /tmp/nats_cert_custom_461dedd908ef2d75e509377dfe35be02_1.pem
Done deleting pipeline
convert-to-json
Description: Convert all pipelines in folder from yaml to json
usage: pipeline [-h] --pipetype PIPE_TYPE
optional arguments:
-h, --help show this help message and exit
--pipetype PIPE_TYPE Type of pipelines to convert : Published/Draft. It
converts all pipelines in published/draft folder to
json format.
- Following is the syntax for pipeline convert-to-json
2023-01-09:11:19:40 [1] INFO nats_client Creating new SharedPool ...
2023-01-09:11:19:40 [1] INFO nats_client Initiallzing PubMgr for pid=1
2023-01-09:11:19:40 [1] INFO nats_client Saving NATS certificate to file: /tmp/nats_cert_custom_461dedd908ef2d75e509377dfe35be02_1.pem
Converted following pipelines from yaml to json
pipeline_name version
-- --------------------------------------- ------------
0 all-stacks-join 2022_09_28_1
1 appd_stack 2022_09_28_1
2 appdynamics-enrichment 2022_09_28_1
3 db_alerts_clustering 2022_09_28_1
4 db_alerts_clustering 2022_11_17_1
5 db_alerts_regression 2022_09_28_1
6 db_alerts_regression 2022_11_17_1
7 db_incidents_clustering 2022_09_28_1
8 db_incidents_clustering 2022_11_17_1
9 db_incidents_regression 2022_09_28_1
10 db_incidents_regression 2022_11_17_1
11 file_upload_alerts_clustering 2022_09_28_1
12 file_upload_alerts_clustering 2022_11_17_1
13 file_upload_incidents_clustering 2022_09_28_1
14 file_upload_incidents_clustering 2022_11_17_1
15 fileupload_alerts_regression 2022_09_28_1
16 fileupload_alerts_regression 2022_11_17_1
17 incident_notify_email 2022_09_28_1
18 incident_notify_jenkins 2022_09_28_1
19 incident_notify_msteams 2022_09_28_1
20 incident_stack_asset_attributes_mapping 2022_09_28_1
21 incident_stack_generator 2022_09_28_1
Sub Command: publish
Description: Publish the pipeline on a worker pod
usage: rdac [-h] --pipeline PIPELINE --name NAME --version VERSION --category
CATEGORY [--usecase USECASE] [--folder FOLDER]
[--group WORKER_GROUP] [--site WORKER_SITE]
[--lfilter LABEL_FILTER] [--rfilter RESOURCE_FILTER]
[--maxwait MAX_WAIT]
optional arguments:
-h, --help show this help message and exit
--pipeline PIPELINE File containing pipeline contents
--name NAME Pipeline name
--version VERSION Pipeline version
--category CATEGORY Pipeline category
--usecase USECASE Pipeline usecase
--folder FOLDER Pipeline Folder
--group WORKER_GROUP Deprecated. Use --site option. Specify a worker site
name. If not specified, will use any available worker.
--site WORKER_SITE Specify a worker site name. If not specified, will use
any available worker.
--lfilter LABEL_FILTER
CFXQL style query to narrow down workers using their
labels
--rfilter RESOURCE_FILTER
CFXQL style query to narrow down workers using their
resources
--maxwait MAX_WAIT Maximum wait time (seconds) for credential check to
complete.
- Following is the syntax for pipeline publish
rdac pipeline publish --pipeline testpipelinenew --name nifty_fifty --version 2023_01_10 --category test
2023-01-10:09:04:06 [1] INFO nats_client Saving NATS certificate to file: /tmp/nats_cert_custom_461dedd908ef2d75e509377dfe35be02_1.pem
{
"status": "started",
"reason": "",
"results": [],
"now": "2023-01-10T09:04:06.130688",
"status-subject": "tenants.ae144f67d2a24034ad6920ace6809763.worker.group.f4a56ba6388c.direct.88c26bbe",
"jobid": "fa81de86812f4770a0ff8b700749f934"
}
Waiting:
Publishing Pipeline:
Completed:
Sub Command: published-run
Description: Run a published pipeline on a worker pod
usage: pipeline [-h] --name NAME --version VERSION [--group WORKER_GROUP]
[--site WORKER_SITE] [--lfilter LABEL_FILTER]
[--rfilter RESOURCE_FILTER] [--maxwait MAX_WAIT]
optional arguments:
-h, --help show this help message and exit
--name NAME Pipeline name
--version VERSION Pipeline version
--group WORKER_GROUP Deprecated. Use --site option. Specify a worker site
name. If not specified, will use any available worker.
--site WORKER_SITE Specify a worker site name. If not specified, will use
any available worker.
--lfilter LABEL_FILTER
CFXQL style query to narrow down workers using their
labels
--rfilter RESOURCE_FILTER
CFXQL style query to narrow down workers using their
resources
--maxwait MAX_WAIT Maximum wait time (seconds) for credential check to
complete.
- Following is the syntax for pipeline published-run
2023-01-10:09:05:31 [1] INFO nats_client Saving NATS certificate to file: /tmp/nats_cert_custom_461dedd908ef2d75e509377dfe35be02_1.pem
{
"status": "started",
"reason": "",
"now": "2023-01-10T09:05:31.126185",
"pipeline-name": "nifty_fifty",
"status-subject": "tenants.ae144f67d2a24034ad6920ace6809763.worker.group.f4a56ba6388c.direct.88c26bbe",
"jobid": "1ec46b3ad80d496380ad1f9eb73482eb",
"attributes": {
"is_draft": "no"
},
"pipeline-checksums": {
"nifty_fifty": "785e1b5b"
}
}
Waiting:
Initializing:
Running:
Running:
Running:
Running:
Running:
Running:
Running:
Running:
Completed:
Sub Command: pods
Description: List all pods for the current tenant
usage: rdac [-h] [--json] [--type POD_TYPE] [--versions] [--infra] [--apps]
optional arguments:
-h, --help show this help message and exit
--json Print detailed information in JSON format instead of
tabular format
--type POD_TYPE Show only the pods that match the specified pod type
--versions Show versions for each pod in tabular format, not
compatible with --json option
--infra List only RDA Infra pods. not compatible with --apps option
--apps List only RDA App pods. not compatible with --infra option
- Following is the syntax for pods
2023-01-10:10:37:12 [1] INFO nats_client Saving NATS certificate to file: /tmp/nats_cert_custom_461dedd908ef2d75e509377dfe35be02_1.pem
[
{
"now": "2023-01-10T10:37:12.289225",
"started_at": "2023-01-07T13:30:42.380413",
"pod_type": "worker",
"pod_category": "rda_infra",
"pod_id": "88c26bbe",
"hostname": "05969789d903",
"proc_id": 10,
"labels": {
"rda_platform_version": "22.12.8.3",
"rda_messenger_version": "22.12.19.1",
"rda_pod_version": "22.12.14",
"rda_license_valid": "no",
"rda_license_not_expired": "no",
"rda_license_expiration_date": ""
},
"build_tag": "daily",
"requests": {
"auto": "tenants.ae144f67d2a24034ad6920ace6809763.worker.group.f4a56ba6388c.auto",
"direct": "tenants.ae144f67d2a24034ad6920ace6809763.worker.group.f4a56ba6388c.direct.88c26bbe"
},
"resources": {
"cpu_count": 4,
"cpu_load1": 6.7,
"cpu_load5": 7.08,
"cpu_load15": 7.14,
"mem_total_gb": 39.16,
"mem_available_gb": 15.34,
"mem_percent": 60.8,
Sub Command: pod-controller
Commands to control supervisord-managed pod processes.
Following are the valid Sub-Commands for the pod-controller
Sub Commands |
Description |
|---|---|
| status | Show supervisorctl status for the pod_type's program(s) |
| start | Send START to supervisorctl for the pod_type's program(s) |
| stop | Send STOP to supervisorctl for the pod_type's program(s) |
| restart | Send RESTART to supervisorctl for the pod_type's program(s) |
Commands to control supervisord-managed pod processes
Following are valid sub-commands for pod-controller:
start Send START to supervisorctl for the pod_type's program(s)
stop Send STOP to supervisorctl for the pod_type's program(s)
status Show supervisorctl status for the pod_type's program(s)
restart Send RESTART to supervisorctl for the pod_type's program(s)
Sub Command: status
Description: Show supervisorctl status for the target pod type's program(s). Read-only; does not modify any processes.
usage: pod-controller [-h] --pod-type POD_TYPE [--site SITE]
[--pod-ids POD_IDS [POD_IDS ...]]
[--cfxql-query CFXQL_QUERY] [--wait WAIT_SECONDS]
[--yes]
options:
-h, --help show this help message and exit
--pod-type POD_TYPE Pod type / supervisorctl program group to target (e.g.
worker)
--site SITE Target only pods whose site (WORKER_GROUP) matches the
given regex.
--pod-ids POD_IDS [POD_IDS ...]
Target only pods with the specified pod IDs.
--cfxql-query CFXQL_QUERY
Optional cfxql expression to further filter the
resolved pods
--wait WAIT_SECONDS Seconds to wait for responses from worker nodes
(default: 30)
--yes, -y Skip confirmation prompt
- Following is the syntax for pod-controller status
The following 1 worker pod(s) will receive 'STATUS':
Pod ID Status Site Hostname Host VM Name Host VM IP
-------- -------- ----------- ------------ -------------- ------------
0b0e6e3d UP rda-site-01 3ac14075f1cd - -
Waiting up to 30s for 1 worker pod(s)...
Received responses from 1/1 worker node(s):
Pod ID Hostname Action Status Message
-------- ------------ -------- -------- --------------------------------------------------------------------------
0b0e6e3d 3ac14075f1cd STATUS SUCCESS rda_worker RUNNING pid 14, uptime 13 days, 3:54:47
Note
The Status column indicates whether the supervisorctl command ran successfully (SUCCESS or FAILED). The actual process state (e.g. RUNNING, STOPPED) is reported in the Message column. A Status = SUCCESS result for a stopped pod is expected — it means supervisorctl responded correctly.
Sub Command: start
Description: Send START to supervisorctl for the target pod type's program(s). Displays a confirmation table of affected pods before executing; use -y to skip the prompt.
usage: pod-controller [-h] --pod-type POD_TYPE [--site SITE]
[--pod-ids POD_IDS [POD_IDS ...]]
[--cfxql-query CFXQL_QUERY] [--wait WAIT_SECONDS]
[--yes]
options:
-h, --help show this help message and exit
--pod-type POD_TYPE Pod type / supervisorctl program group to target (e.g.
worker)
--site SITE Target only pods whose site (WORKER_GROUP) matches the
given regex.
--pod-ids POD_IDS [POD_IDS ...]
Target only pods with the specified pod IDs.
--cfxql-query CFXQL_QUERY
Optional cfxql expression to further filter the
resolved pods
--wait WAIT_SECONDS Seconds to wait for responses from worker nodes
(default: 30)
--yes, -y Skip confirmation prompt
- Following is the syntax for pod-controller start
The following 1 worker pod(s) will receive 'START':
Pod ID Status Site Hostname Host VM Name Host VM IP
-------- -------- ----------- ------------ -------------- ------------
0b0e6e3d UP rda-site-01 3ac14075f1cd - -
Waiting up to 30s for 1 worker pod(s)...
Received responses from 1/1 worker node(s):
Pod ID Hostname Action Status Message
-------- ------------ -------- -------- -------------------
0b0e6e3d 3ac14075f1cd START SUCCESS rda_worker: started
Sub Command: stop
Description: Send STOP to supervisorctl for the target pod type's program(s). Displays a confirmation table of affected pods before executing; use -y to skip the prompt.
usage: pod-controller [-h] --pod-type POD_TYPE [--site SITE]
[--pod-ids POD_IDS [POD_IDS ...]]
[--cfxql-query CFXQL_QUERY] [--wait WAIT_SECONDS]
[--yes]
options:
-h, --help show this help message and exit
--pod-type POD_TYPE Pod type / supervisorctl program group to target (e.g.
worker)
--site SITE Target only pods whose site (WORKER_GROUP) matches the
given regex.
--pod-ids POD_IDS [POD_IDS ...]
Target only pods with the specified pod IDs.
--cfxql-query CFXQL_QUERY
Optional cfxql expression to further filter the
resolved pods
--wait WAIT_SECONDS Seconds to wait for responses from worker nodes
(default: 30)
--yes, -y Skip confirmation prompt
- Following is the syntax for pod-controller stop
The following 1 worker pod(s) will receive 'STOP':
Pod ID Status Site Hostname Host VM Name Host VM IP
-------- -------- ----------- ------------ -------------- ------------
0b0e6e3d UP rda-site-01 3ac14075f1cd - -
Proceed with STOP? [y/N]: y
Waiting up to 30s for 1 worker pod(s)...
Received responses from 1/1 worker node(s):
Pod ID Hostname Action Status Message
-------- ------------ -------- -------- -------------------
0b0e6e3d 3ac14075f1cd STOP SUCCESS rda_worker: stopped
Sub Command: restart
Description: Send RESTART to supervisorctl for the target pod type's program(s). Displays a confirmation table of affected pods before executing; use -y to skip the prompt. Run this after rdac library-install to activate staged libraries.
usage: pod-controller [-h] --pod-type POD_TYPE [--site SITE]
[--pod-ids POD_IDS [POD_IDS ...]]
[--cfxql-query CFXQL_QUERY] [--wait WAIT_SECONDS]
[--yes]
options:
-h, --help show this help message and exit
--pod-type POD_TYPE Pod type / supervisorctl program group to target (e.g.
worker)
--site SITE Target only pods whose site (WORKER_GROUP) matches the
given regex.
--pod-ids POD_IDS [POD_IDS ...]
Target only pods with the specified pod IDs.
--cfxql-query CFXQL_QUERY
Optional cfxql expression to further filter the
resolved pods
--wait WAIT_SECONDS Seconds to wait for responses from worker nodes
(default: 30)
--yes, -y Skip confirmation prompt
- Following is the syntax for pod-controller restart
The following 1 worker pod(s) will receive 'RESTART':
Pod ID Status Site Hostname Host VM Name Host VM IP
-------- -------- ----------- ------------ -------------- ------------
0b0e6e3d UP rda-site-01 3ac14075f1cd - -
Waiting up to 30s for 1 worker pod(s)...
Received responses from 1/1 worker node(s):
Pod ID Hostname Action Status Message
-------- ------------ -------- -------- -------------------
0b0e6e3d 3ac14075f1cd RESTART SUCCESS rda_worker: stopped
rda_worker: started
Sub Command: pod-logging
Following are the valid Sub-Commands for the pod-logging
Sub Commands |
Description |
|---|---|
| get | Get logging configuration of given pod |
| set | Update the logging level of a logging component for a given RDA Pod |
| handler-set | Update the logging level of a handler for a given RDA Pod |
| handler-get | Get all logging handlers and handler configuration for a given RDA Pod |
pod logging commands
Following are valid sub-commands for pod-logging:
get Get logging configuration of given pod
set Update the logging level of a logging component for a given RDA Pod
handler-set Update the logging level of a handler for a given RDA Pod
handler-get Get all logging handlers and handler configuration for a given RDA Pod
Sub Command: get
Description: Get logging configuration of given pod
usage: pod-logging [-h] --id POD_ID [--logger LOGGER_NAME]
optional arguments:
-h, --help show this help message and exit
--id POD_ID pod_id of the pod for which the logging level need to
be retrieved
--logger LOGGER_NAME Logging Name. By default it sets the root logger.
Sub Command: set
Description: Update the logging level of a logging component for a given RDA Pod
usage: pod-logging [-h] --id POD_ID --level LEVEL [--logger LOGGER_NAME]
optional arguments:
-h, --help show this help message and exit
--id POD_ID pod_id of the pod for which the logging level need to
be configured
--level LEVEL Logging level. Must be one of DEBUG INFO WARNING ERROR
CRITICAL
--logger LOGGER_NAME Logging Name. By default it sets the root logger.
- Following is the Syntax for pod-logging set
rdac set-pod-log-level --id 07a337e5 --level DEBUG
Successfully updated logging level for pod 07a337e5
Sub Command: handler-set
Description: Update the logging level of a handler for a given RDA Pod
usage: pod-logging [-h] --id POD_ID --level LEVEL [--handler HANDLER_NAME]
optional arguments:
-h, --help show this help message and exit
--id POD_ID pod_id of the pod for which the logging level need to
be configured
--level LEVEL Logging level. Must be one of DEBUG INFO WARNING ERROR
CRITICAL
--handler HANDLER_NAME
Logging Handler name. (e.g. console/file_handler) as
specified in logging configuration file. If not
specified, all the handlers will be set to the level
provided.
- Following is the Syntax for pod-logging handler-set
rdac pod-logging handler-set --id 07a337e5 --level DEBUG
Successfully updated logging level for pod 07a337e5
Sub Command: handler-get
Description: Get all logging handlers and handler configuration for a given RDA Pod
usage: pod-logging [-h] --id POD_ID
optional arguments:
-h, --help show this help message and exit
--id POD_ID pod_id of the pod for which the logging level need to be
retrieved
Sub Command: pod-logging-handler-set
Description: To change log levels for any required pod
usage: rdac [-h] --id POD_ID --level LEVEL [--handler HANDLER_NAME]
optional arguments:
-h, --help show this help message and exit
--id POD_ID pod_id of the pod for which the logging level need to
be configured
--level LEVEL Logging level. Must be one of DEBUG INFO WARNING ERROR
CRITICAL
--handler HANDLER_NAME
Logging Handler name. (e.g. console/file_handler) as
specified in logging configuration file. If not
specified, all the handlers will be set to the level
provided.
Sub Command: project
Following are the valid Sub-Commands for the project
Sub Commands |
Description |
|---|---|
| add | Add or update project |
| get | Get YAML data for a project |
| list | List all projects |
| delete | Delete a project |
| enable | Change the status of a project to 'enabled' |
| disable | Change the status of a project to 'disabled' |
Project management commands. Projects can be used to link different tenants / projects from this RDA Fabric or a remote RDA Fabric.
Following are valid sub-commands for project:
add Add or update project
get Get YAML data for a project
list List all projects
delete Delete a project
enable Change the status of a project to 'enabled'
disable Change the status of a project to 'disabled'
Sub Command: add
Description: Add or update project
usage: project [-h] --file INPUT_FILE [--overwrite] [--rda_config RDA_CONFIG]
optional arguments:
-h, --help show this help message and exit
--file INPUT_FILE YAML file containing project definition
--overwrite Overwrite even if a project already exists with the
specified name.
--rda_config RDA_CONFIG
JSON file containing RDA Credentials (if the project
belongs to a remote system)
- Following is the syntax for project add
Note
Create a project YAML file before adding a new project
name: "oia-2"
customerId: "3edd7c702f5d442982dfcd493d2fe7b3"
projectId: "3f9ef108-62b8-46d3-bc9e-caee1c53c174"
userId: "acme@cfx.com"
label: "ACME 2"
list
Description: List all projects
usage: project [-h] [--json]
optional arguments:
-h, --help show this help message and exit
--json Print detailed information in JSON format instead of tabular
format
name label enabled customerId projectId tenant_id nats_url minio_host saved_time
-- ------ ------------- --------- ------------ ----------- ----------- ---------- ------------ --------------------------
0 n-bank National Bank yes ae144f** c2b89a** 2022-09-28T05:50:06.285929
1 oia-2 ACME 2 no 3edd7c** 3f9ef1** 2023-01-23T05:11:28.716514
Sub Command: enable
Description: Change the status of a project to 'enabled'
usage: project [-h] --name PROJECT_NAME
optional arguments:
-h, --help show this help message and exit
--name PROJECT_NAME Name of the project
disable
Description: Change the status of a project to 'disabled'
usage: project [-h] --name PROJECT_NAME
optional arguments:
-h, --help show this help message and exit
--name PROJECT_NAME Name of the project
Sub Command: get
Description: Get YAML data for a project
usage: project [-h] --name PROJECT_NAME
optional arguments:
-h, --help show this help message and exit
--name PROJECT_NAME Name of the project
name: oia-2
customerId: 3edd7c702f5d442982dfcd493d2fe7b3
projectId: 3f9ef108-62b8-46d3-bc9e-caee1c53c174
userId: acme@cfx.com
label: ACME 2
saved_time: '2023-01-23T05:11:28.716514'
enabled: false
Sub Command: delete
Description: Delete a project
usage: project [-h] --name PROJECT_NAME
optional arguments:
-h, --help show this help message and exit
--name PROJECT_NAME Name of the project to delete
- Following is the syntax for project delete
Sub Command: pstream
Following are the valid Sub-Commands for the pstream
Sub Commands |
Description |
|---|---|
| list | List persistent streams |
| status | Status of the persistent streams |
| get | Get information about a persistent stream |
| metadata | Get metadata information about a persistent stream |
| add | Add a new persistent stream |
| delete | Delete a persistent stream |
| query | Query persistent stream data via collector |
| delete-by-query | Delete persistent stream data via CFXQL query |
| update-by-query | Update column(s) in persistent stream data via CFXQL query |
| add-column | Add column to the persistent stream records that don't have it and set a value via expression |
| tail | Query a persistent stream and continue to query for incremental data every few seconds |
| export | Query a persistent stream and export data to CSV or JSON file |
| export-chunks | Query a persistent stream and export data as minio chunks |
| migrate | Query a persistent stream and export to another stream with optional type conversion |
| load | Load data from a CSV file into a persistent stream with optional type conversion |
| ingest | Ingest data to persistent stream by directly adding data to Opensearch |
| evict | Evict ingestion Job |
| evict-export | Evict Export Chunks Job |
Persistent Stream management commands
Following are valid sub-commands for pstream:
list List persistent streams
status Status of the persistent streams
get Get information about a persistent stream
metadata Get metadata information about a persistent stream
add Add a new Persistent stream
delete Delete a persistent stream
query Query persistent stream data via collector
delete-by-query Delete persistent stream data via CFXQL query
update-by-query Update column(s) in persistent stream data via CFXQL query
add-column Add column to the persistent stream records that don't have it and set a value via expression
tail Query a persistent stream and continue to query for incremental data every few seconds
export Query a persistent stream and export data to CSV or JSON file
export-chunks Query a persistent stream and export data as minio chunks
migrate Query a persistent stream and export to another stream with optional type conversion
load Load data from a CSV file into a persistent stream with optional type conversion
ingest Ingest data to pstream by directly adding data to Open Search
evict Evict Ingestion Job
evict-export Evict Export Chunks Job
Sub Command: list
Description : List persistent streams
usage: pstream [-h] [--json]
optional arguments:
-h, --help show this help message and exit
--json Print detailed information in JSON format instead of tabular
format
- Following is the syntax for pstream list
Detected OS Name: Linux
Detected docker version: 20.10.12
name index_name saved_time retention_days
-- ----------------------------------------- ------------------------------------------------------------------------------------------ -------------------------- ----------------
0 rda_synthetic_metrics f92bc678629540f0bcaf7749177acccb-stream-03e632e0-rda_synthetic_metrics 2022-11-15T04:15:41.692800 31
1 oia-incidents-data-coll-stream f92bc678629540f0bcaf7749177acccb-stream-09c0c9b9-oia-incidents-data-coll-stream 2022-11-14T10:39:14.080246 7
2 rdaf_services_logs f92bc678629540f0bcaf7749177acccb-stream-rdaf_services_logs 2022-11-14T10:29:40.564683 15
3 dli-synthetic-logs-processed f92bc678629540f0bcaf7749177acccb-stream-10fe40a6-dli-synthetic-logs-processed 2022-11-14T15:33:16.490331 31
4 test_oia-incident-inserts-pstream f92bc678629540f0bcaf7749177acccb-stream-1eb8a4d3-test_oia-incident-inserts-pstream 2022-12-05T07:22:48.543676 7
5 oia-incidents-collaboration-stream f92bc678629540f0bcaf7749177acccb-stream-23f2f83a-oia-incidents-collaboration-stream 2022-11-14T10:36:52.070142 7
6 dli-log-stats f92bc678629540f0bcaf7749177acccb-stream-25235c4a-dli-log-stats 2022-11-14T15:33:16.356427 90
- Another example syntax for pstream list
{
"attrs": {
"unique_keys": [
"name"
],
"system_defined": "yes"
},
"datastore_type": "OS",
"index_name": "cf75a3efaa26491b9efea482d2ac981c-stream-01970753-rda_secrets_meta",
"name": "rda_secrets_meta",
"saved_time": "2023-11-08T07:45:44.541749",
"status": "Running"
},
Sub Command: status
Description : Status of the persistent streams
usage: pstream [-h] [--json]
optional arguments:
-h, --help show this help message and exit
--json Print detailed information in JSON format instead of tabular
format
- Following is the syntax for pstream status
Detected OS Name: Linux
Detected docker version: 20.10.12
name index_exists docs_count size_in_bytes shards_failed shards_successful shards_total status
-- ----------------------------------------- -------------- ------------ --------------- --------------- ------------------- -------------- --------
0 rda_synthetic_metrics True 100000 10929315 0 3 6 OK
1 oia-incidents-data-coll-stream True 0 690 0 3 6 OK
2 rdaf_services_logs True 17733976 8751155216 0 3 6 OK
3 dli-synthetic-logs-processed True 4964025 697988506 0 3 6 OK
4 test_oia-incident-inserts-pstream True 0 690 0 3 6 OK
5 oia-incidents-collaboration-stream True 0 690 0 3 6 OK
6 dli-log-stats True 1028976 77565766 0 3 6 OK
7 regression-aggregated-anomalies True 2529 731537 0 3 6 OK
8 oia-incidents-delta-stream True 0 690 0 3 6 OK
9 dli-synthetic-logs-dropped True 0 71681 0 3 6 OK
10 oia-alerts-kpi-stream True 44 26682 0 3 6 OK
- Another example syntax for pstream status
{
"status": "ok",
"reason": "",
"data": [
{
"name": "rda_secrets_meta",
"datastore_type": "OS",
"index_exists": true,
"docs_count": 0,
"size_in_bytes": 624,
"shards_total": 6,
"shards_successful": 3,
"shards_failed": 0,
"status": "OK"
},
Sub Command: get
Description : Get information about a persistent stream
usage: pstream [-h] --name NAME [--json]
optional arguments:
-h, --help show this help message and exit
--name NAME Persistent Stream name
--json Print in JSON format instead of text format
- Following is the syntax for pstream get
Detected OS Name: Linux
Detected docker version: 20.10.12
Stream Name: test_oia-incident-inserts-pstream
Index Name: f92bc678629540f0bcaf7749177acccb-stream-1eb8a4d3-test_oia-incident-inserts-pstream
Saved Time : 2022-12-05T07:22:48.543676
Attributes
retention_days: 7
unique_keys: ['project_id']
timestamp: timestamp
- Another example syntax for pstream get
{
"name": "oia-metrics-data",
"datastore_type": "OS",
"attrs": {
"case_insensitive": true,
"unique_keys": [
"asset_id",
"metric_id",
"metric_source",
"metric_timestamp"
],
"retention_days": "90"
},
"saved_time": "2023-11-08T09:10:06.755111",
"index_name": "cf75a3efaa26491b9efea482d2ac981c-stream-08d2fd46-oia-metrics-data",
"status": "Running"
}
Sub Command: metadata
Description : Get metadata information about a persistent stream
usage: pstream [-h] --name NAME [--json]
optional arguments:
-h, --help show this help message and exit
--name NAME Persistent Stream name
--json Print in JSON format instead of text format
- Following is the syntax for pstream metadata
Detected OS Name: Linux
Detected docker version: 20.10.12
columnId keywordColumn mappedType parent type
-- ------------------- ------------------- ------------ ----------- -------
0 component.keyword TEXT component keyword
1 component component.keyword TEXT text
2 count_ DOUBLE long
3 layer.keyword TEXT layer keyword
4 layer layer.keyword TEXT text
5 metric_name.keyword TEXT metric_name keyword
6 metric_name metric_name.keyword TEXT text
7 node_id.keyword TEXT node_id keyword
8 node_id node_id.keyword TEXT text
9 node_label.keyword TEXT node_label keyword
10 node_label node_label.keyword TEXT text
11 node_type.keyword TEXT node_type keyword
12 node_type node_type.keyword TEXT text
13 source_tool.keyword TEXT source_tool keyword
14 source_tool source_tool.keyword TEXT text
15 stack_name.keyword TEXT stack_name keyword
16 stack_name stack_name.keyword TEXT text
17 timestamp DATETIME date
18 unit.keyword TEXT unit keyword
19 unit unit.keyword TEXT text
20 value DOUBLE float
Sub Command: add
Description : Add a new Persistent stream
usage: pstream [-h] --name NAME [--index INDEX_NAME]
[--attr [ATTRS [ATTRS ...]]] [--retention_days RETENTION_DAYS]
[--unique_keys UNIQUE_KEYS] [--auto_expand AUTO_EXPAND]
[--drop DROP] [--computed COMPUTED] [--timestamp TIMESTAMP]
optional arguments:
-h, --help show this help message and exit
--name NAME Persistent Stream name
--index INDEX_NAME OpenSearch index name to store Persistent Stream
--attr [ATTRS [ATTRS ...]]
Optional name=value pairs to add to attributes of
persistent stream
--retention_days RETENTION_DAYS
Number of days to retain the data
--unique_keys UNIQUE_KEYS
Comma separated list of column names to make each row
unique
--auto_expand AUTO_EXPAND
Comma separated list of column names that should
parsed as JSON dicts and expanded
--drop DROP Comma separated list of column names that should be
dropped before persisting
--computed COMPUTED JSON fille containing computed column definition
--timestamp TIMESTAMP
Timestamp column name
- Following is the syntax for pstream add
rdac pstream add --name test_oia-incident-inserts-pstream --retention_days 7 --unique_keys project_id --timestamp timestamp
Detected OS Name: Linux
Detected docker version: 20.10.12
{
"retention_days": 7,
"unique_keys": [
"project_id"
],
"timestamp": "timestamp"
}
Persistent stream saved.
rdac pstream add --name oia-incidents-stream --attr 'retention_days=1' --auto_expand "resolved_at,created" --computed test.json
{
"retention_days": "1",
"auto_expand": [
"resolved_at",
"created"
],
"search_case_insensitive": true,
"computed_columns": {
"ttr_minutes": {
"expr": "(resolved_at - created)/(1000.0*60)",
"default": null
},
"created_iso": {
"expr": "ms_to_isoformat(created)"
},
"resolved_at_iso": {
"expr": "ms_to_isoformat(resolved_at)"
}
}
}
Persistent stream saved.
When a pstream is created, the corresponding Index name is automatically generated and created. Please run rdac pstream list to see the associated Index name.
Index name has below format.
<tenant_id>-stream-<random_id>-<pstream-name>
Below is an example of system generated Index name as part of pstream creation.
79cc72a1697b487fb2da7b99f0a0cc1a-stream-09c0c9b9-oia-incidents-data-coll-stream
pstream add also supports creating user defined Index name, however, the Index name should always be pre-fixed with tenant-id as shown above.
Organization ID can be found at RDAF UI portal --> Main Menu --> Configuration --> RDA Admin --> Network
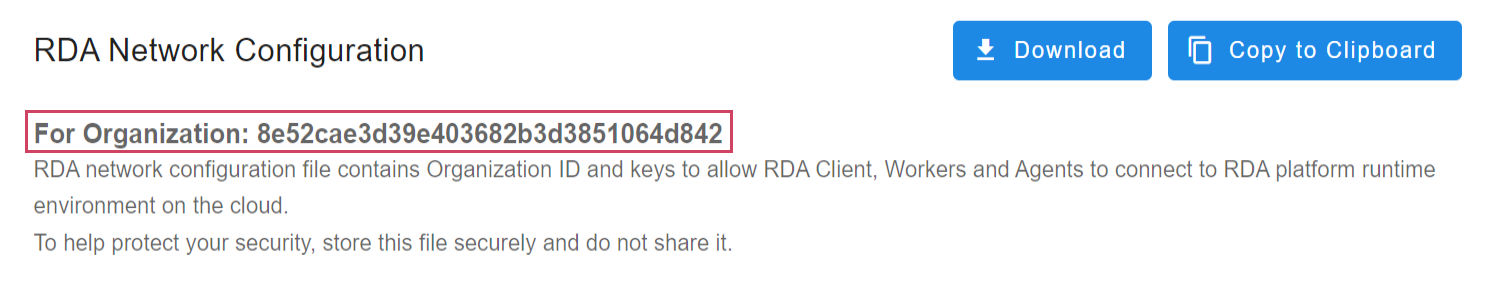
- Following is the syntax for pstream add with user specified Index name.
rdac pstream add --name server_cpu_metrics --retention_days 7 --timestamp timestamp --index 79cc72a1697b487fb2da7b99f0a0cc1a-stream-server_cpu_metrics
Warning
Index name always should start with Organization ID. If Organization id is not prefixed as part of user defined index name, the data ingestion into pstream will be failed with permission errors.
Sub Command: delete
Description : Delete a persistent stream
usage: pstream [-h] --name NAME [--delete_index]
optional arguments:
-h, --help show this help message and exit
--name NAME Persistent Stream name
--delete_index Delete all the data and metadata from open search
- Following is the syntax for pstream delete
By default, pstream delete will not delete the associated Index which contains the data. If associated Index also to be deleted along with the persistent steam, use --delete_index option.
Danger
Please be aware that --delete_index deletes the persistent stream's index permanently which contains the data.
Sub Command: query
Description : Query persistent stream data via collector
usage: pstream [-h] --name NAME [--max_rows MAX_ROWS] [--query CFXQL_QUERY]
[--aggs AGGS] [--groupby GROUPBY] [--sortby SORT_BY]
[--order SORT_ORDER] [--ts TS_COLUMN] [--json] [--no_sort]
optional arguments:
-h, --help show this help message and exit
--name NAME Persistent Stream name
--max_rows MAX_ROWS Max rows in output
--query CFXQL_QUERY CFXQL Query
--aggs AGGS Optional aggs, specified as 'sum:field_name'
--groupby GROUPBY Comma separated list of columns to groupby. Used only
when --aggs is used
--sortby SORT_BY Comma separated list of columns to sort by. Default is
timestamp column.
--order SORT_ORDER Sort oder. Must be one 'asc' or 'desc'. Default is
'desc'
--ts TS_COLUMN Timestamp column for sorting. Default is 'timestamp'
--json Print detailed information in JSON format instead of
tabular format
--no_sort Do not sort by timestamp field
- Following is the syntax for pstream query
Detected OS Name: Linux
Detected docker version: 20.10.12
metric_name
-- ------------------------------
0 host_cpu_usage
1 host_mem_usage
2 transaction_time
3 shared_svc_total_response_time
4 total_response_time
Query persistent stream with CFXQL filters, in this example, querying the data and get one of the data record within last 5 mins. Since @timestamp has special character, it need to be escaped as shown below.
rdac pstream query --name rdaf_services_logs --json --query '"\`@timestamp\`" is after -5min' --max_rows 1
[
{
"_id": "BjhB7oQBXeLk1V97kTCm",
"_index": "79cc72a1697b487fb2da7b99f0a0cc1a-stream-rdaf_services_logs",
"sort": [
1670444585275,
"BjhB7oQBXeLk1V97kTCm"
],
"_score": null,
"process_name": "systemd-networkd",
"log_message": "veth7809965: Gained IPv6LL",
"host": "10.95.101.175",
"service_category": "rda_infra_svcs",
"service_host": "rdaflogstream",
"hostname": "rdaflogstream",
"received_from": "10.95.101.175",
"log": "2022-12-07T20:23:05.275427+00:00 rdaflogstream systemd-networkd[1110]: veth7809965: Gained IPv6LL",
"log_severity": "UNKNOWN",
"service_name": "rda_os_syslog",
"@timestamp": "2022-12-07T20:23:05.275Z",
"@version": "1",
"fluentbit_timestamp": "2022-12-07T20:23:05.275Z",
"process_id": "1110"
}
]
Below is another example of CFXQL query when the column name service-category has a special character.
rdac pstream query --name rdaf_services_logs --json --query '"\`@timestamp\`" is after -5min and "\`service-category\`" = "rda_infra_svcs"' --max_rows 1
Tip
When using CFXQL, column names that has special characters such as @ -, need to be escaped as shown in the above examples.
Below is another example of aggs & groupby arguments when the column name is service_name.
rdac pstream query --name rdaf_services_logs --ts @timestamp --query '"\`@timestamp\`" is after -1d and log_severity = 'ERROR' get service_name,log' --aggs value_count:_id --groupby service_name
Detected OS Name: Linux
Detected docker version: 20.10.12
Series
* Label: _id_value_count
Values
* Value: 39,918
Group: rda_nats
* Label: _id_value_count
Values
* Value: 5,412
Group: rda_scheduler
* Label: _id_value_count
Values
* Value: 72
Group: rda_file_browser
* Label: _id_value_count
Values
* Value: 48
Group: rda_resource_manager
Below is another example of sum aggregation of the column name duration.
python3 rdac.py pstream query --name rda_microservice_traces --aggs sum:duration --groupby source --order asc
Detected OS Name: Linux
Detected docker version: 20.10.12
Series
* Label: duration_sum
Values
* Value: 270,762.0
Group: scheduler
* Label: duration_sum
Values
* Value: 166,608.0
Group: dataset-caas
* Label: duration_sum
Values
* Value: 44,937.0
Group: api-server
* Label: duration_sum
Values
* Value: 81,265.0
Group: cfxdimensions-app-file-browser
Below is another example of value count aggregation of the column name Maths.
Series
* Label: Maths_value_count
Values
* Value: 5
Group: A
* Label: Maths_value_count
Values
* Value: 5
Group: B
Below is another example of cardinality aggregation of the column name Maths.
Series
* Label: Maths_cardinality
Values
* Value: 5
Group: A
* Label: Maths_cardinality
Values
* Value: 4
Group: B
Maths.
Series
* Label: Maths_avg
Values
* Value: 57.6
Group: A
* Label: Maths_avg
Values
* Value: 77.8
Group: B
Below is another example of max aggregation of the column name Maths.
Series
* Label: Maths_max
Values
* Value: 87.0
Group: A
* Label: Maths_max
Values
* Value: 90.0
Group: B
Sub Command: delete-by-query
Description: Delete persistent stream data via CFXQL query
usage: pstream [-h] --name NAME --query CFXQL_QUERY [--timeout TIMEOUT]
optional arguments:
-h, --help show this help message and exit
--name NAME Persistent Stream name
--query CFXQL_QUERY CFXQL Query
--timeout TIMEOUT Timeout in seconds to wait for response. Default 60
- Following is the syntax for pstream delete-by-query
rdac pstream delete-by-query --name rda_logs_test --query 'artifact_name is "login_post" and operation = "LOGIN"'
Deleted all the data that matched the query
{'status': 'ok', 'reason': '', 'data': {'took': 14, 'timed_out': False, 'total': 4, 'deleted': 4, 'batches': 1, 'version_conflicts': 0, 'noops': 0, 'retries': {'bulk': 0, 'search': 0}, 'throttled_millis': 0, 'requests_per_second': -1.0, 'throttled_until_millis': 0}, 'now': '2023-11-09T08:23:39.800946'}
Warning
pstream delete-by-query deletes the records from persistent stream, please make sure the given CFXQL query is appropriate to filter and delete the intended records. As a pre-caution, use pstream query with CFXQL filter to validate the query results before running pstream delete-by-query command.
Sub Command: update-by-query
Description: Update column(s) in persistent stream data via CFXQL query
usage: pstream [-h] --name NAME --query CFXQL_QUERY --columns COLUMNS --values
VALUES [--timeout TIMEOUT]
optional arguments:
-h, --help show this help message and exit
--name NAME Persistent Stream name
--query CFXQL_QUERY CFXQL Query
--columns COLUMNS Comma separated list of column names that needs to be
updated for all the records that match the query.
Example: city,state,zipcode
--values VALUES Set the value to specified column or columns (comma
separated). The specified number of columns should
match 'columns' column(s). Example: San Jose,CA,12345
--timeout TIMEOUT Timeout in seconds to wait for response. Default 60
- Following is the syntax for pstream update-by-query
rdac pstream update-by-query --name rda_logs_test --query 'artifact_name is "login_post"' --columns artifact_name --values 'login_test1'
Updated all the data that matched the query
{'status': 'ok', 'reason': '', 'data': {'took': 578, 'timed_out': False, 'total': 2, 'updated': 2, 'deleted': 0, 'batches': 1, 'version_conflicts': 0, 'noops': 0, 'retries': {'bulk': 0, 'search': 0}, 'throttled_millis': 0, 'requests_per_second': -1.0, 'throttled_until_millis': 0, 'failures': []}, 'now': '2023-11-09T08:38:54.026199'}
columns
rdac pstream update-by-query --name sample-test-scores --query 'name is "tej"' --columns "Maths,english" --values "85,54"
Updated all the data that matched the query
{'status': 'ok', 'reason': '', 'data': {'took': 22, 'timed_out': False, 'total': 1, 'updated': 1, 'deleted': 0, 'batches': 1, 'version_conflicts': 0, 'noops': 0, 'retries': {'bulk': 0, 'search': 0}, 'throttled_millis': 0, 'requests_per_second': -1.0, 'throttled_until_millis': 0, 'failures': []}, 'now': '2023-11-20T05:54:21.625365'}
Sub Command: add-column
Description: Add column to the persistent stream records that don't have it and set a value via expression
usage: pstream [-h] --name NAME --column COLUMN --expression EXPRESSION
optional arguments:
-h, --help show this help message and exit
--name NAME Persistent Stream name
--column COLUMN Field name. Example: full_name
--expression EXPRESSION
Open Search painless script. Example:
"ctx._source['first_name'] + ' ' +
ctx._source['last_name']"
- Following is the syntax for pstream add-column
Run rdac command without arguments to enter into rdac command shell and followed by pstream add-column command as shown below.
pstream add-column --name rda_logs_test --column artifact add --expression "ctx._source['artifact_type'] + ' ' + ctx._source['artifact_name']"
Added column 'artifactadd' for all the records that don't have it
{'status': 'ok', 'reason': '', 'data': {'took': 111, 'timed_out': False, 'total': 33, 'updated': 33, 'deleted': 0, 'batches': 1, 'version_conflicts': 0, 'noops': 0, 'retries': {'bulk': 0, 'search': 0}, 'throttled_millis': 0, 'requests_per_second': -1.0, 'throttled_until_millis': 0, 'failures': []}, 'now': '2023-11-09T10:59:28.158594'}
Note
When adding a new column using the --expression option, it uses Opensearch painless scripted language which will have special characters. To prevent issues with these special characters, it is recommended to execute this command within the rdac shell.
Sub Command: tail
Description : Query a persistent stream and continue to query for incremental data every few seconds
usage: pstream [-h] --name NAME [--max_rows MAX_ROWS] [--query CFXQL_QUERY]
[--ts TS_COLUMN] [--format FORMAT] [--out_cols OUTPUT_COLUMNS]
[--json]
optional arguments:
-h, --help show this help message and exit
--name NAME Persistent Stream name
--max_rows MAX_ROWS Max rows in output for initial query
--query CFXQL_QUERY CFXQL Query
--ts TS_COLUMN Timestamp column for sorting. Default is 'timestamp'
--format FORMAT Format string in {field1:<8} {field2:,.2f} style
--out_cols OUTPUT_COLUMNS
Comma separated list of column names to be included in
output. If not specified, all columns will be included
--json Print detailed information in JSON format instead of
tabular format
--query supports CFXQL query. However it doesn't support get columns option.
--out_cols use this option to get specific attributes from the pstream as shown in the above example.
--json use this option to get the log output in JSON format. However, it doesn't support limiting the selective attributes listed under --out_cols option.
- Following is the syntax for pstream tail
Detected OS Name: Linux
Detected docker version: 20.10.12
7 3hSAeYQBuQsspbunzGjR 1 Application Component app_vm_mem_usage 10.95.134.101_Webserver fin-web01 Webserver AppDynamics Online_Banking_Stack 2022-11-15T04:05:13.584582 % 60.48
8 3xSAeYQBuQsspbunzGjR 1 Application Component total_response_time 10.95.134.101_Webserver fin-web01 Webserver ThousandEyes Online_Banking_Stack 2022-11-15T04:05:13.584582 ms 65.72
9 4BSAeYQBuQsspbunzGjR 1 Application Component app_vm_cpu_usage 10.95.134.101_Webserver fin-web01 Webserver AppDynamics Online_Banking_Stack 2022-11-15T04:05:13.584582 % 69.24
4 2xSAeYQBuQsspbunzGjR 1 Application Component total_response_time 10.95.134.101_Webserver fin-web01 Webserver ThousandEyes Online_Banking_Stack 2022-11-15T04:05:13.921674 ms 29.11
5 3BSAeYQBuQsspbunzGjR 1 Application Component app_vm_cpu_usage 10.95.134.101_Webserver fin-web01 Webserver AppDynamics Online_Banking_Stack 2022-11-15T04:05:13.921674 % 69.28
6 3RSAeYQBuQsspbunzGjR 1 Application Component app_vm_mem_usage 10.95.134.101_Webserver fin-web01 Webserver AppDynamics Online_Banking_Stack 2022-11-15T04:05:13.921674 % 60.75
3 2hSAeYQBuQsspbunzGjR 1 Shared Service shared_svc_total_response_time app.okta.com app.okta.com IdentityProvider ThousandEyes Online_Banking_Stack 2022-11-15T04:05:16.339953 ms 50.31
2 2RSAeYQBuQsspbunzGjR 1 Application Component transaction_time 10.95.134.102_Appserver fin-app01 Appserver AppDynamics Online_Banking_Stack 2022-11-15T04:05:18.318154 ms 4.35
0 1xSAeYQBuQsspbunzGjR 1 Host host_cpu_usage 10.95.158.194_esxi esxi-server-04 EsxiHost VROps Online_Banking_Stack 2022-11-15T04:05:23.190271 % 78.13
1 2BSAeYQBuQsspbunzGjR 1 Host host_mem_usage 10.95.158.194_esxi esxi-server-04 EsxiHost VROps Online_Banking_Stack 2022-11-15T04:05:23.190271 % 69.05
- Below is an example of
pstream tailwith CFXQL query to filter and tail selected output column(s) specified with--out_cols
rdac pstream tail --name rdaf_services_logs --ts @timestamp --query "service_name = 'rda_registry'" --out_cols 'log'
2022-12-07:20:50:53 [1] INFO nats_client Saving NATS certificate to file: /tmp/nats_cert_custom_461dedd908ef2d75e509377dfe35be02_1.pem
2022-12-07 20:50:51,245 [PID=9:TID=Thread-9:cfx.rda_messaging.nats_client:cb:1021] INFO - Sending request-reply to _INBOX.RZtDMglua05ndrDR200bGx.RZtDMglua05ndrDR200bJ8
2022-12-07 20:50:51,274 [PID=9:TID=Thread-10:cfx.rda_registry.registry_main:registry_requests:501] INFO - received registry request on subject tenants.79cc72a1697b487fb2da7b99f0a0cc1a.registry.auto: get-pods
2022-12-07 20:50:51,274 [PID=9:TID=Thread-10:cfx.rda_registry.registry_main:registry_requests:546] INFO - Returning 1 pods
2022-12-07 20:50:51,275 [PID=9:TID=Thread-10:cfx.rda_messaging.nats_client:cb:1021] INFO - Sending request-reply to _INBOX.AeVKdrtKiJGJtMSKQEfui2.AeVKdrtKiJGJtMSKQEfukt
...
...
Tip
When using CFXQL, column names that has special characters such as @ -, need to be escaped. Please refer pstream query section for reference examples.
Sub Command: export
Description : Query a persistent stream and export data to CSV or JSON file
usage: pstream [-h] --name NAME [--max_rows MAX_ROWS] [--limit LIMIT]
[--query CFXQL_QUERY] [--ts TS_COLUMN] --to_file TO_FILE
optional arguments:
-h, --help show this help message and exit
--name NAME Persistent Stream name
--max_rows MAX_ROWS Max rows in each batch
--limit LIMIT Total limit on downloaded rows
--query CFXQL_QUERY CFXQL Query
--ts TS_COLUMN Timestamp column for sorting. Default is 'timestamp'
--to_file TO_FILE Output filename (CSV or JSON)
- Following is the syntax for pstream export
rdac pstream export --name oia-alerts-stream --max_rows 100 --limit 100 --query "a_status is ACTIVE" --to_file ./test.csv
Detected OS Name: Linux
Detected docker version: 20.10.12
Fetching offset 0, totalResults=?, limit=100
Completed download of 100 rows
export-chunks
Description: Query a persistent stream and export data as minio chunks
usage: pstream [-h] --name NAME [--query CFXQL_QUERY] [--limit LIMIT]
[--ts TS_COLUMN]
optional arguments:
-h, --help show this help message and exit
--name NAME Persistent Stream name
--query CFXQL_QUERY CFXQL Query
--limit LIMIT Total limit exported rows
--ts TS_COLUMN Timestamp column for sorting. Default is 'timestamp'
"timestamp is after -2 days"
Check 'rda_system_collector_export_job_status' stream for updates for export job: rda_logs_test-6ebeeb88
Exiting out of LogRecordSocketReceiver. pid: 1. Socket file: /tmp/rdf_log_socket_2bef0dfa-8c71-466a-a592-25d33326b8c7
Sub Command: migrate
Description : Query a persistent stream and export to another stream with optional type conversion
usage: pstream [-h] --name NAME [--max_rows MAX_ROWS] [--limit LIMIT]
[--query CFXQL_QUERY] [--ts TS_COLUMN] --dest_stream
DEST_STREAM [--to_int TO_INT] [--to_float TO_FLOAT]
[--to_text TO_TEXT]
optional arguments:
-h, --help show this help message and exit
--name NAME Persistent Stream name
--max_rows MAX_ROWS Max rows in each batch
--limit LIMIT Total limit on downloaded rows
--query CFXQL_QUERY CFXQL Query
--ts TS_COLUMN Timestamp column for sorting. Default is 'timestamp'
--dest_stream DEST_STREAM
Output PStream name
--to_int TO_INT Comma separated list of columns to be converted to int
--to_float TO_FLOAT Comma separated list of columns to be converted to
float
--to_text TO_TEXT Comma separated list of columns to be converted to
- Following is the syntax for pstream migrate
rdac pstream migrate --name oia-incidents-stream --max_rows 100 --limit 100 --dest_stream test_pstream --to_int i_ttr_millis
Detected OS Name: Linux
Detected docker version: 20.10.12
Fetching offset 0, totalResults=?, limit=100
Completed migration of 100 rows, with 0 mapping errors
Sub Command: load
Description : Load data from a CSV file into a persistent stream with optional type conversion
usage: pstream [-h] --name NAME --data DATA_FILE [--limit LIMIT]
[--filter CFXQL_QUERY] [--to_ts TO_TS] [--timestamp TIMESTAMP]
[--to_int TO_INT] [--to_float TO_FLOAT] [--to_text TO_TEXT]
optional arguments:
-h, --help show this help message and exit
--name NAME Destination Persistent Stream name
--data DATA_FILE Input data file (CSV)
--limit LIMIT Total limit on published rows
--filter CFXQL_QUERY CFXQL Query to apply on loaded dataframe before
publishing
--to_ts TO_TS Comma separated list of timestamp columns (ISO format)
--timestamp TIMESTAMP
Create Timestamp column from a an existing column
--to_int TO_INT Comma separated list of columns to be converted to int
--to_float TO_FLOAT Comma separated list of columns to be converted to
float
--to_text TO_TEXT Comma separated list of columns to be converted to
text
- Following is the syntax for pstream load
Detected OS Name: Linux
Detected docker version: 20.10.12
Reading input data file...
Input data file has 12 Rows and 9 Columns
Publishing 12 rows..
Completed loading of 12 rows into stream rda_synthetic_metrics in 0.3 seconds
Sub Command: ingest
Description : Ingest data to pstream by directly adding data to Open Search
usage: pstream [-h] --name NAME [--minio_object_prefix MINIO_OBJECT_PREFIX]
[--local_directory LOCAL_DIRECTORY]
[--filename_pattern FILENAME_PATTERN] [--dataset DATASET]
[--num_rows NUM_ROWS] [--replace]
optional arguments:
-h, --help show this help message and exit
--name NAME Destination Persistent Stream name
--minio_object_prefix MINIO_OBJECT_PREFIX
Platform's minio object prefix. Example: /data/
--local_directory LOCAL_DIRECTORY
Local directory of input file.
--filename_pattern FILENAME_PATTERN
File criteria in regex format. Only files with csv
extension (or csv file compressesd as .gz file) are
supported. Applicable if 'minio_object_prefix' or
'local_directory' is provided
--dataset DATASET Dataset name
--num_rows NUM_ROWS Number of rows to fetch in each chunk
--replace Delete any existing data in the index and load new
data
- Following is the syntax for pstream ingest
rdac pstream ingest --name test_pstream --filename_pattern csv --dataset time_series_data_test --num_rows 100 --replace
Detected OS Name: Linux
Detected docker version: 20.10.12
Check 'rda_system_collector_ingestion_job_status' stream for updates for ingestion job: test_pstream-2115d970
- Following is the syntax for pstream ingest --minio_object_prefix
rdac pstream ingest --name demo-test --filename_pattern csv --dataset sample-test-scores --minio_object_prefix cfxdm-saved-data
Check 'rda_system_collector_ingestion_job_status' stream for updates for ingestion job: demo-test-3824eb70
Important
When executing rdac commands from the CLI, rdac launches a pre-configured Docker container and executes commands inside it. The tool takes the current working directory (cwd) from your host machine and maps it to the /home/ directory inside the container.
This means:
If you have a file sample.csv in /tmp/<directory>, relative paths like ./<directory> work because it maps to /home/<directory> in the container.
Fully qualified paths like /tmp/<directory> will fail because /tmp isn't mapped into the container.
To use fully qualified paths, you need to reference /home/<directory>, which maps to your current directory in the host.
For example, with current working directory (cwd) /tmp:
| Command | Result |
|---|---|
rdac pstream ingest --name delete_me --local ./<directory> --filename_pattern sample.csv |
Works |
rdac pstream ingest --name delete_me --local /tmp/<directory> --filename_pattern sample.csv |
Fails |
rdac pstream ingest --name delete_me --local /home/<directory> --filename_pattern sample.csv |
Works |
Sub Command: evict
Description : Evict Ingestion Job
usage: pstream [-h] --name NAME
optional arguments:
-h, --help show this help message and exit
--name NAME Ingestion Job name
Note
evict command will work only when the ingest job status is Ingesting. Ingestion job status is captured in rda_system_collector_ingestion_job_status persistent stream.
- Following is the syntax to check pstream ingestion status
Detected OS Name: Linux
Detected docker version: 20.10.12
count_ dataset ingest_job_name row_count status stream timestamp
-- -------- --------------------- ------------------------------ ----------- --------- --------------------- --------------------------
0 1 rda_synthetic_metrics test_pstream-9721ebd0 78900 Ingesting test_pstream 2022-12-07T05:45:18.348868
1 1 rda_synthetic_metrics test_pstream-618b8063 100000 Done test_pstream 2022-12-07T05:06:56.391054
2 1 rda_synthetic_metrics test_pstream-becb20a7 100000 Done test_pstream 2022-12-06T15:03:04.692909
3 1 rda_synthetic_metrics test_pstream-60b98c94 100000 Done test_pstream 2022-12-06T14:32:52.728035
Note
To evict the pstream ingestion job (when the status is Ingesting ) run the evict command to terminate the ingestion job
- Following is the syntax for pstream evict
Sub Command: evict-export
Description: Evict Export Chunks Job
- Following is the syntax for pstream evict-export
Sub Command: purge-outputs
Description: Purge outputs of completed jobs
Usage: purge-outputs [-h] --hours OLDER_THAN_HOURS
optional arguments:
-h, --help show this help message and exit
--hours OLDER_THAN_HOURS
Purge jobs older than specified number of hours. Must
be >= 1
Sub Command: read-stream
Description: Read messages from an RDA stream
Usage: read-stream [-h] --name STREAM_NAME [--group GROUP] [--delay DELAY]
[--show_rate]
optional arguments:
-h, --help show this help message and exit
--name STREAM_NAME Stream name to read from
--group GROUP Message consumer group name
--delay DELAY Simulate processing delay between each read message
--show_rate Do not print messages, just show rate per minute and
counts
Sub Command: run
Description: Run a pipeline on a worker pod
Usage: run [-h] --pipeline PIPELINE [--nowait] [--log LOGLEVEL]
[--group WORKER_GROUP] [--site WORKER_SITE]
[--lfilter LABEL_FILTER] [--rfilter RESOURCE_FILTER] [--dryrun]
[--save_jobid SAVE_JOBID]
optional arguments:
-h, --help show this help message and exit
--pipeline PIPELINE File containing pipeline information in JSON format
--nowait If specified, command does not wait for the completion
of the pipeline
--log LOGLEVEL Specify logging level as none,
DEBUG,INFO,WARNING,ERROR,CRITICAL
--group WORKER_GROUP Deprecated. Use --site option. Specify a worker site
name. If not specified, will use any available worker.
--site WORKER_SITE Specify a worker site name. If not specified, will use
any available worker.
--lfilter LABEL_FILTER
CFXQL style query to narrow down workers using their
labels
--rfilter RESOURCE_FILTER
CFXQL style query to narrow down workers using their
resources
--dryrun Do not run pipeline but show which worker nodes would
have been selected for run
--save_jobid SAVE_JOBID
Save the jobid to a specified file
Sub Command: run-get-output
Description: Run a pipeline on a worker, wait for the completion, get the final output
Usage: run-get-output [-h] [--config CONFIG] [--site SITE] [--pipeline PIPELINE]
[--max_rows MAX_ROWS] [--md] [--onerow] [--vault] [--tocsv TO_CSV]
optional arguments:
-h, --help show this help message and exit
--config CONFIG Additional configurations defined in a YAML or JSON
file
--site SITE Site name regex
--pipeline PIPELINE Plain text Pipeline filename. If not specified, will
read from STDIN.
--max_rows MAX_ROWS Max rows to print on screen.
--md Print in markdown format on screen instead of text
table format
--onerow Print fist row in a vertical format (in addition to
table)
--vault Use RDA Vault for credentials if not specified locally
in a JSON file
--tocsv TO_CSV Save the output to CSV formatted file
Sub Command: schedule-add
Description: Add a new schedule for pipeline execution
Usage: schedule-add [-h] --pipeline PIPELINE [--log LOGLEVEL] --name SCHEDULENAME
--type SCHEDULE_TYPE [--startdate STARTDATE]
[--starttime STARTTIME] [--enddate ENDDATE] [--weekdays WEEKDAYS]
[--freq FREQUENCY] [--tz TIMEZONE] --group GROUP
[--retries RETRIES] [--retry-intervals RETRYINTERVALS]
[--parallel-instances PARALLELINSTANCES]
optional arguments:
-h, --help show this help message and exit
--pipeline PIPELINE File containing pipeline contents
--log LOGLEVEL Specify logging level as none,
DEBUG,INFO,WARNING,ERROR,CRITICAL
--name SCHEDULENAME Schedule name to use
--type SCHEDULE_TYPE Schedule Type (Once, Minutes, Hourly, Daily, Weekly,
Always)
--startdate STARTDATE
Start date for schedule in YYYY-MM-DD format
--starttime STARTTIME
Start time for schedule in HH:MM format
--enddate ENDDATE End date for schedule in YYYY-MM-DD format
--weekdays WEEKDAYS Comma separated Day(s) of the week. Mandatory weekly
schedule type. Possible values:'MON',
'TUE','WED','THU','FRI','SAT','SUN'
--freq FREQUENCY Default 1 except for minutes, where it is 15 minutes
--tz TIMEZONE Timezone name
--group GROUP Worker group name
--retries RETRIES Maximum Retries
--retry-intervals RETRYINTERVALS
Retry intervals. Example 5,10,15. Delay time interval
in minutes between each retry
--parallel-instances PARALLELINSTANCES
Parallel instances number should range in between
1-10. Example 1,2,3
Sub Command: schedule-delete
Description: Delete an existing schedule
Usage: schedule-delete [-h] --scheduleId SCHEDULEID
optional arguments:
-h, --help show this help message and exit
--scheduleId SCHEDULEID
Schedule ID
Sub Command: schedule-edit
Description: Edit an existing schedule
Usage: schedule-edit [-h] --scheduleId SCHEDULEID --type SCHEDULE_TYPE
[--startdate STARTDATE] [--starttime STARTTIME]
[--enddate ENDDATE] [--weekdays WEEKDAYS] [--freq FREQUENCY]
[--tz TIMEZONE] [--group GROUP] [--retries RETRIES]
[--retry-intervals RETRYINTERVALS]
[--parallel-instances PARALLELINSTANCES]
optional arguments:
-h, --help show this help message and exit
--scheduleId SCHEDULEID
Schedule ID
--type SCHEDULE_TYPE Schedule Type (Once, Minutes, Hourly, Daily, Weekly,
Always)
--startdate STARTDATE
Start date for schedule in YYYY-MM-DD format
--starttime STARTTIME
Start time for schedule in HH:MM format
--enddate ENDDATE End Date for schedule in YYYY-MM-DD format
--weekdays WEEKDAYS Comma separated Day(s) of the week. Mandatory weekly
schedule type. Possible values:'MON',
'TUE','WED','THU','FRI','SAT','SUN'
--freq FREQUENCY Default 1 except for minutes, where it is 15 minutes
--tz TIMEZONE Timezone name
--group GROUP Worker group name
--retries RETRIES Maximum Retries
--retry-intervals RETRYINTERVALS
Retry intervals
--parallel-instances PARALLELINSTANCES
Parallel instances number should range in between 1-10
Sub Command: schedule-info
Description: Get details of a schedule
Usage: schedule-info [-h] --scheduleId SCHEDULEID [--json]
optional arguments:
-h, --help show this help message and exit
--scheduleId SCHEDULEID
Schedule ID
--json Print detailed information in JSON format instead of
tabular format
Sub Command: schedule-list
Description: List all schedules
Usage: schedule-list [-h] [--json]
optional arguments:
-h, --help show this help message and exit
--json Print detailed information in JSON format instead of tabular
format
Sub Command: schedule-update-status
Description: Update status of an existing schedule
Usage: schedule-update-status [-h] --scheduleId SCHEDULEID --status STATUS
optional arguments:
-h, --help show this help message and exit
--scheduleId SCHEDULEID
Schedule ID
--status STATUS Status
Sub Command: schema
**Following are the valid Sub-Commands for the schema **
Sub Commands |
Description |
|---|---|
| list | List schemas from the object store |
| get | Download a schema from the object store |
| add | Add a new schema to the object store |
| delete | Delete a schema from the object store |
Dataset Model Schema management commands
Following are valid sub-commands for schema:
list List schemas from the object store
get Download a schema from the object store
add Add a new schema to the object store
delete Delete a schema from the object store
Sub Command: list
Description: List schemas from the object store
Usage: schema-list [-h] [--json]
optional arguments:
-h, --help show this help message and exit
--json Print detailed information in JSON format instead of tabular
format
- Following is the syntax for schema-list
name num_columns saved_time title
-- -------------- ------------- -------------------------- -----------------------------
0 Example Schema 5 2023-01-05T04:52:38.182396 Example Schema
1 Schema-QA 6 2023-01-05T04:38:41.935552 QA Schema
2 Test 3 2023-01-05T04:39:03.106297 Pager Duty Urgency Enrichment
Sub Command: get
Description: Download a schema from the object store
Usage: schema-get [-h] --name NAME
optional arguments:
-h, --help show this help message and exit
--name NAME Schema name
- Following is the syntax for schema-get
{
"title": "Pager Duty Urgency Enrichment",
"properties": {
"rule": {
"type": "string"
},
"rule_id": {
"type": "string"
},
"urgency_id": {
"type": "string",
"default": "low",
"enum": [
"low",
"medium",
"high",
"critical",
"emergency"
]
}
},
"required": [
"rule",
"rule_id"
],
"name": "Test",
"date": "2023-01-05T04:39:03.106297"
}
Sub Command: add
Description: Add a new schema to the object store
Usage: schema-add [-h] --name NAME --file INPUT_FILE
optional arguments:
-h, --help show this help message and exit
--name NAME Schema name
--file INPUT_FILE File (or URL) containing the json schema as per
(https://json-schema.org/specification.html)
- Following is the syntax for schema-add
Successfully loaded schema Schematest and validated.
Unknown schema Schematest
Added/modified schema Schematest
Note
Before adding the schema, create a JSON input_file containing the json schema.
{
"title": "New Pager Duty Urgency Enrichment",
"properties": {
"rule": {
"type": "string"
},
"rule_id": {
"type": "string"
},
"urgency_id": {
"type": "string",
"default": "low",
"enum": [
"low",
"medium",
"high",
"critical",
"emergency"
]
}
},
"required": [
"rule",
"rule_id"
],
"name": "Test",
"date": "2023-01-24T04:39:03.106297"
}
Sub Command: delete
Description: Delete a schema from the object store
rdac schema delete --help
Usage: schema-delete [-h] --name NAME [--yes]
optional arguments:
-h, --help show this help message and exit
--name NAME Schema name
--yes Delete without prompting
- Following is the syntax for schema-delete
Sub Command: secret
Description: Credentials (Secrets) management commands
Following are the valid Sub-Commands for the secret
Sub Commands |
Description |
|---|---|
| types | List of all available secret types |
| add | Add a new secret to the vault |
| delete | Delete a secret from the vault |
| list | List names and types of all secrets in vault |
Credentials (Secrets) management commands
Following are valid sub-commands for secret:
types List of all available secret types
add Add a new secret to the vault
delete Delete a secret from the vault
list List names and types of all secrets in vault
types
Description: List of all available secret types
Usage: secret-types [-h] [--json]
optional arguments:
-h, --help show this help message and exit
--json Print detailed information in JSON format instead of tabular
format
+-----------------------+-----------------------------------------------------------------------------------------------------------------+
| Type | Description |
|-----------------------+-----------------------------------------------------------------------------------------------------------------|
| aiaexpress | CloudFabrix AIA Express |
| ansible | Ansible - Run Ansible playbook defined in the input dataset |
| appdynamics | AppDynamics - Inventory and Metrics collection from AppDynamics |
| arcsight | ArcSight - Get event details from ArcSight |
| arista-bigswitch | Arista Bigswitch Fabric Inventory Collection |
| aws | AWS EC2 |
| aws-cloudwatch | AWS CloudWatch - Logs and Metric collection from AWS Cloudwatch |
| aws-cloudwatch-v2 | AWS CloudWatch - Logs and Metric collection from AWS Cloudwatch |
| aws-kinesis | AWS Kinesis - Read and Write data on AWS Kinesis streams |
| aws-sqs | AWS SQS - Read and Write data to SQS stream |
| aws_v2 | AWS EC2 - Collect inventory details from EC2 instances |
| azure | Microsoft Azure - Collect inventory details from Microsoft Azure |
| azure-insights | Microsoft Azure Insights - Collect metrics and logs from Azure |
| blob_aws | Pull/Push blobs from AWS Cloud object stores |
| blob_azure | Pull/Push blobs from Azure Cloud object stores |
| blob_gcp | Pull/Push blobs from GCP Cloud object stores |
| cfxai_classification | CloudFabrix ML - Classification |
+-----------------------+-----------------------------------------------------------------------------------------------------------------+
Sub Command: add
Sub Command: secret-add
Description: Add a new secret to the vault
Usage: secret-add [-h] --type SECRET_TYPE
optional arguments:
-h, --help show this help message and exit
--type SECRET_TYPE Secret type (use secret-list command to see available
secret types)
Sub Command: list
Description: List names and types of all secrets in vault
Usage: secret-list [-h] [--json]
optional arguments:
-h, --help show this help message and exit
--json Print detailed information in JSON format instead of tabular
format
name type saved_time checksum
-- ------ ---------------- -------------------------- --------------------------------
0 cfxml cfxai_regression 2023-01-12T05:49:39.325308 def3259af30655a412beb39a8a99e53a
Sub command: set-pod-log-level
Description: Update the logging level for a given RDA Pod
usage: rdac [-h] --id POD_ID --level LEVEL [--logger LOGGER_NAME]
optional arguments:
-h, --help show this help message and exit
--id POD_ID pod_id of the pod for which the logging level need to
be configured
--level LEVEL Logging level. Must be one of DEBUG INFO WARNING ERROR
CRITICAL
--logger LOGGER_NAME Logging Name. By default it sets the root logger.
Note
This command is deprecated. It is recommended to use pod-logging instead
Sub Command: site-profile
Description: Site Profile management commands
Following are the valid Sub-Commands for the site-profile
Sub Commands |
Description |
|---|---|
| Following are valid sub-commands for site-profile: | |
| add | Add a new site profile |
| edit | Update a site profile |
| get | Get a site profile data |
| delete | Delete a site profile |
| list | List all site profiles |
Site Profile management commands
Following are valid sub-commands for site-profile:
add Add a new site profile
edit Update a site profile
get Get a site profile data
delete Delete a site profile
list List all site profiles
Sub Command: site-profile-add
Description: Add a new site profile
Usage: site-profile-add [-h] --name NAME --site SITE [--description DESCRIPTION]
[--sources SOURCES]
optional arguments:
-h, --help show this help message and exit
--name NAME Name of Site Profile
--site SITE Site name or a regular expression
--description DESCRIPTION
Description of Site Profile
--sources SOURCES Comma separated list of sources
Sub Command: site-profile-delete
Description: Delete a site profile
Usage: site-profile-delete [-h] --name NAME
optional arguments:
-h, --help show this help message and exit
--name NAME Name of the site profile to delete
Sub Command: site-profile-edit
Description: Update a site profile
Usage: site-profile-edit [-h] --name NAME [--site SITE] [--description DESCRIPTION]
[--sources SOURCES]
optional arguments:
-h, --help show this help message and exit
--name NAME Name of Site Profile
--site SITE Site name or a regular expression
--description DESCRIPTION
Description of Site Profile
--sources SOURCES Comma separated list of sources
Sub Command: site-profile-get
Description: Get a site profile data
Usage: site-profile-get [-h] --name NAME
optional arguments:
-h, --help show this help message and exit
--name NAME Name of the site profile to display
Sub Command: site-profile-list
Description: List all site profiles.
Usage: site-profile-list [-h] [--json]
optional arguments:
-h, --help show this help message and exit
--json Print detailed information in JSON format instead of tabular
format
name description site sources saved_time
-- ------- -------------------- ------ --------- --------------------------
0 default Default Site Profile .* cfxml 2023-01-12T05:49:39.425974
Sub Command: site-summary
Description: Show summary by Site and Overall
usage: rdac [-h] [--json]
optional arguments:
-h, --help show this help message and exit
--json Print detailed information in JSON format instead of tabular
format
Summary
Overall
Infra Pod Count: 25
Worker Count: 1
Worker Group Count: 4
Site Count: 4
Cpu Cores: 4
Memory Gb: 31.3
Active Jobs: 3
Total Jobs: 10
Agent Count: 3
Site Names: collabagent, mlagent, irmagent, rda-site-01
By Site
* Name: collabagent
Worker Count: 0
Cpu Cores: 0
Memory Gb: 0
Active Jobs: 0
Total Jobs: 0
Agent Count: 1
Agent Names: agent-collab
* Name: irmagent
Worker Count: 0
Cpu Cores: 0
Memory Gb: 0
Active Jobs: 0
Total Jobs: 0
Agent Count: 1
Agent Names: agent-irm
Sub Command: stack
Following are valid sub-commands for stack:
Sub Commands |
Description |
|---|---|
| cache-list | List cached stack entries from asset-dependency service |
| search | Search in a stack using asset-dependency service |
| search-json | Search in a stack using asset-dependency service, load search criteria from a JSON file |
| impact-distance | Find the impact distances in a stack using asset-dependency service, load search criteria from a JSON file |
Sub Command: cache-list
Description: List cached stack entries from asset-dependency service
usage: stack [-h] [--json]
optional arguments:
-h, --help show this help message and exit
--json Print results in JSON format
- Following is the syntax for stack cache-list
{ "status": "ok", "data": [], "now": "2023-01-23T07:04:25.597835" }
Sub Command: impact-distance
Description: Find the impact distances in a stack using asset-dependency service, load search criteria from a JSON file
usage: stack [-h] --name STACK_NAME --search_file SEARCH_FILE [--json]
optional arguments:
-h, --help show this help message and exit
--name STACK_NAME Stack name
--search_file SEARCH_FILE
Filename with JSON based search criteria
--json Print results in JSON format
node_id node_label layer node_type distance via
-- ------------------------------------------ ----------------------------------- -------------- ----------- ---------- ------------------------------------------
0 423306a6-f91e-ed00-c1dc-d5b3a004659a debian8.engr.cloudfabrix.com Virtualization VM -1 10.95.158.200
1 42330bd2-019b-3f22-c629-29824bc07ab7 AIA-Hari-PF80.engr.cloudfabrix.com Virtualization VM -1 10.95.158.200
2 42331120-6a91-ce70-f8f2-3bfe6620c4f1 macaw0vf1.0.0-Ch Virtualization VM -1 10.95.158.200
3 42333b86-240a-eddd-0b33-fadc6e242c25 MacawOVFPlatformPOC-v1.0.0 Virtualization VM -1 10.95.158.200
4 42336507-674d-0d86-d8a2-508518fdf9f8 SNMPSimulator-macaw-219 Virtualization VM -1 10.95.158.200
5 4233a553-8746-5ee6-02d8-87423d388ba1 oialatserv1.qa.engr.cloudfabrix.com Virtualization VM -1 10.95.158.200
6 4233ab94-559d-892d-7130-b0ec1d237d11 windows2008r2enterprise Virtualization VM -1 10.95.158.200
7 4233ee33-5cd3-2a90-0a11-65e2db7ce9dc platform-60.qa.engr.cloudfabrix.com Virtualization VM -1 10.95.158.200
8 4233f1eb-3ddc-7464-08f9-d536844c10e9 SNMPSimulator-238 Virtualization VM -1 10.95.158.200
9 4233f62f-7f59-fb80-31d3-a89ab6108df1 oialatpf.qa.engr.cloudfabrix.com Virtualization VM -1 10.95.158.200
10 4233f6a4-5870-48f4-9d61-af0a0f455593 Promotheus_windows_vm_testing Virtualization VM -1 10.95.158.200
11 4233ffd3-2061-59fd-fe2c-832097ccc1f6 oialatclam1.qa.engr.cloudfabrix.com Virtualization VM -1 10.95.158.200
12 564d3503-5fe7-d5a0-70b8-e1adf218ffaa pf150.qa.engr.cloudfabrix.com Virtualization VM -1 10.95.158.200
13 564d3c15-d2a9-e904-0c21-bf53301960f7 hari_elk7.4.engr.cloudfabrix.com Virtualization VM -1 10.95.158.200
14 564d4711-398f-34f1-7f3f-919d3b4eadcd SNMPSimulator-macaw-214 Virtualization VM -1 10.95.158.200
Sub Command: stack-search
Description: Search in a stack using asset-dependency service
Usage: stack-search [-h] --name STACK_NAME --values VALUES --attrs ATTRS --types TYPES
[--exclude EXCLUDE] [--depth DEPTH]
optional arguments:
-h, --help show this help message and exit
--name STACK_NAME Stack name
--values VALUES Attribute values to search for. Multiple values may be
specified separated by a comma
--attrs ATTRS Comma separated list of node attribute names
--types TYPES Comma separated list of node types to search
--exclude EXCLUDE Comma separated list of node types to exclude in search
--depth DEPTH Max depth
Sub Command: stack-search-json
Description: Search in a stack using asset-dependency service, load search criteria from a JSON file
Usage: stack-search-json [-h] --name STACK_NAME --search_file SEARCH_FILE
optional arguments:
-h, --help show this help message and exit
--name STACK_NAME Stack name
--search_file SEARCH_FILE
Filename with JSON based search criteria
Sub Command: staging-area-add
Description: Add or update staging area
Usage: staging-area-add [-h] --file INPUT_FILE [--overwrite]
optional arguments:
-h, --help show this help message and exit
--file INPUT_FILE YAML file containing staging area definition
--overwrite Overwrite even if a staging area already exists with a
name.
Sub Command: staging-area-delete
Description: Delete a staging area
Usage: staging-area-delete [-h] --name STAGING_AREA_NAME
optional arguments:
-h, --help show this help message and exit
--name STAGING_AREA_NAME
Name of the staging area to delete
Sub Command: staging-area-get
Description: Get YAML data for a staging area
Usage: staging-area-get [-h] --name STAGING_AREA_NAME
optional arguments:
-h, --help show this help message and exit
--name STAGING_AREA_NAME
Name of the staging area
Sub Command: staging-area-list
Description: List all staging areas.
Usage: staging-area-list [-h] [--json]
optional arguments:
-h, --help show this help message and exit
--json Print detailed information in JSON format instead of tabular
format
Sub Command: subscription
Description: Show current CloudFabrix RDA subscription details
Usage: subscription [-h] [--json] [--details]
optional arguments:
-h, --help show this help message and exit
--json Print detailed information in JSON format instead of tabular
format
--details Show full details when showing plain text format
Sub Command: synthetics
Description: Data synthesizing management commands
Following are the valid Sub-Commands for the synthetics
Sub Commands |
Description |
|---|---|
| add | Add or update Synthetic Profile |
| get | Get JSON data for a Synthetic Profile |
| list | List all Synthetic Profiles |
| delete | Delete a Synthetic Profile |
| enable | Change the status of a Synthetic Profile to 'enabled' |
| disable | Change the status of a Synthetic Profile to 'disabled' |
| status | List status of all active synthetic profiles |
| reset | Reset all active situations in a single synthetic profile |
| situation | Activate a specific situtation in a given synthetic profile |
| webhooks-list | List all Webhook Targets for Synthesizer |
| webhooks-update | Update Webhook Targets for Synthesizer |
| generate-ml-dataset | Generate ML dataset from input alerts & incidents stream and write to an output stream |
Data synthesizing management commands
Following are valid sub-commands for synthetics:
add Add or update Synthetic Profile
get Get JSON data for a Synthetic Profile
list List all Synthetic Profiles
delete Delete a Synthetic Profile
enable Change the status of a Synthetic Profile to 'enabled'
disable Change the status of a Synthetic Profile to 'disabled'
status List status of all active synthetic profiles
reset Reset all active situations in a single synthetic profile
situation Activate a specific situtation in a given synthetic profile
webhooks-list List all Webhook Targets for Synthesizer
webhooks-update Update Webhook Targets for Synthesizer
generate-ml-dataset Generate ML dataset from input alerts & incidents stream and write to an output stream
Sub Command: get
Description: Get JSON data for a Synthetic Profile
usage: synthetics [-h] --name SYNTHETIC_PROFILE_NAME
optional arguments:
-h, --help show this help message and exit
--name SYNTHETIC_PROFILE_NAME
Name of the synthetic_profile
{
"name": "Online_Banking_App_Profile",
"label": "Online Banking App Synthetics",
"enabled": true,
"version": "22.8.22.1",
"stack": "Online_Banking_Stack",
"metric_stream": "rda_synthetic_metrics",
"alert_stream": "rda_synthetic_alerts",
"diagnostics": [
{
"id": "db_storage",
"label": "Check Database Storage",
"rules": {
"tlog": {
"name": "Transaction Log Free Disk Space",
"check": "Ensure 100GB of free disk space",
"status": {
"NORMAL": "Available Disk space is 100GB oe more",
"WARNING": "Available disk space is between 75GB to 100GB",
"CRITICAL": "Available disk space is less than 50GB"
}
},
"backup": {
"name": "Backup Volume Free Disk Space",
"check": "Ensure 500GB of free disk space",
"status": {
Sub Command: list
Description: List all Synthetic Profiles
usage: synthetics [-h] [--json]
optional arguments:
-h, --help show this help message and exit
--json Print detailed information in JSON format instead of tabular
format
- Following is the syntax for synthetics list
name label enabled saved_time
-- -------------------------- ----------------------------- --------- --------------------------
0 Pet_Clinic_App_Profile1 Pet Clinic App Synthetics1 no 2022-10-04T23:01:52.860735
1 log-profile-example-1 ACME Log Synthetics yes 2023-01-23T22:13:48.183910
2 Pet_Clinic_App_Profile Pet Clinic App Synthetics no 2022-09-28T05:51:51.861521
3 Online_Banking_App_Profile Online Banking App Synthetics yes 2023-01-10T01:51:32.625109
Sub Command: status
Description: List status of all active synthetic profiles
usage: synthetics [-h] [--json]
optional arguments:
-h, --help show this help message and exit
--json Print detailed information in JSON format instead of tabular
format
- Following is the syntax for synthetics status
2023-02-10:09:59:38 [1] INFO nats_client Saving NATS certificate to file: /tmp/nats_cert_custom_461dedd908ef2d75e509377dfe35be02_1.pem
{
"status": "ok",
"data": [
{
"metrics": 0,
"alerts": 0,
"profile_name": "log-profile-example-1",
"stack": "Enterprise_Data_and_Analytics_Stack",
"active_situations": ""
},
{
"metrics": 26,
"alerts": 1,
"profile_name": "Online_Banking_App_Profile",
"stack": "Online_Banking_Stack",
"active_situations": ""
}
],
"now": "2023-02-10T09:59:38.147686"
}
Sub Command: enable
Description: Change the status of a Synthetic Profile to 'enabled'
usage: synthetics [-h] --name SYNTHETIC_PROFILE_NAME
optional arguments:
-h, --help show this help message and exit
--name SYNTHETIC_PROFILE_NAME
Name of the synthetic profile
- Following is the syntax for synthetics enable
2023-02-10:09:58:02 [1] INFO nats_client Creating new SharedPool ...
2023-02-10:09:58:02 [1] INFO nats_client Initiallzing PubMgr for pid=1
2023-02-10:09:58:02 [1] INFO nats_client Saving NATS certificate to file: /tmp/nats_cert_custom_461dedd908ef2d75e509377dfe35be02_1.pem
Changed status of Pet_Clinic_App_Profile1 to enabled
Sub Command: disable
Description: Change the status of a Synthetic Profile to 'disabled'
usage: synthetics [-h] --name SYNTHETIC_PROFILE_NAME
optional arguments:
-h, --help show this help message and exit
--name SYNTHETIC_PROFILE_NAME
Name of the synthetic profile
- Following is the syntax for synthetics disable
2023-02-10:09:58:45 [1] INFO nats_client Creating new SharedPool ...
2023-02-10:09:58:45 [1] INFO nats_client Initiallzing PubMgr for pid=1
2023-02-10:09:58:45 [1] INFO nats_client Saving NATS certificate to file: /tmp/nats_cert_custom_461dedd908ef2d75e509377dfe35be02_1.pem
Changed status of Pet_Clinic_App_Profile1 to disabled
Sub Command: verify-pipeline
Description: Verify the pipeline on a worker pod
Usage: verify-pipeline [-h] --pipeline PIPELINE [--group WORKER_GROUP]
[--site WORKER_SITE] [--lfilter LABEL_FILTER]
[--rfilter RESOURCE_FILTER] [--maxwait MAX_WAIT]
optional arguments:
-h, --help show this help message and exit
--pipeline PIPELINE File containing pipeline contents
--group WORKER_GROUP Deprecated. Use --site option. Specify a worker site
name. If not specified, will use any available worker.
--site WORKER_SITE Specify a worker site name. If not specified, will use
any available worker.
--lfilter LABEL_FILTER
CFXQL style query to narrow down workers using their
labels
--rfilter RESOURCE_FILTER
CFXQL style query to narrow down workers using their
resources
--maxwait MAX_WAIT Maximum wait time (seconds) for credential check to
complete.
- Following is the syntax for verify-pipeline
rdac verify-pipeline --pipeline jira.json --group aws-qa-102-200 --rfilter "cpu_count = 8" --lfilter "rda_messenger_version = '21.7.29.3'"
Initiating verify pipeline
{
"status": "started",
"reason": "",
"results": [],
"now": "2021-08-06T15:35:11.078751",
"status-subject": "tenants.d6152687e007482e99ed210bca1fbe9e.worker.group.f17ce69d60d8.direct.9729ad1e",
"jobid": "39e2cf7970b144fe911ec51f7a9f5a35"
}
Initializing:
Initializing:
Initializing:
Initializing:
Completed:
Sub Command: viz
Description: Visualize data from a file within the console (terminal)
Usage: viz [-h] --file INPUT_FILE [--format FILE_FORMAT]
optional arguments:
-h, --help show this help message and exit
--file INPUT_FILE CSV or parquet or JSON formatted file which will be
visualized
--format FILE_FORMAT Input file format (csv or parquet or json). 'auto'
means format will be derived from file extension
Sub Command: watch
Following are the valid Sub-Commands for the watch
Sub Commands |
Description |
|---|---|
| registry | Start watching updates published by the RDA pod registry |
| logs | Start watching logs produced by the pipelines |
| traces | Start watching traces produced by the pipelines |
Commands to watch various streams such sas trace, logs and change notifications by microservices
Following are valid sub-commands for watch:
registry Start watching updates published by the RDA pod registry
logs Start watching logs produced by the pipelines
traces Start watching traces produced by the pipelines
Sub Command: registry
Description: Start watching updates published by the RDA pod registry
usage: watch [-h] [--json]
optional arguments:
-h, --help show this help message and exit
--json Print detailed information in JSON format instead of tabular
format
- Following is the syntax for watch registry
Update Type Pod Type Pod ID Host Pod Started At
2023-02-01:13:39:54 [1] INFO nats_client Creating new SharedPool ...
2023-02-01:13:39:54 [1] INFO nats_client Initiallzing SubMgr for pid=1
2023-02-01:13:39:54 [1] INFO nats_client Saving NATS certificate to file: /tmp/nats_cert_custom_461dedd908ef2d75e509377dfe35be02_1.pem
2023-02-01:13:39:54 [1] INFO nats_client Creating thread-pool of size: 4, PID=1
Sub Command: logs
Description: Start watching logs produced by the pipelines
usage: watch [-h] [--json] [--attr ATTR]
optional arguments:
-h, --help show this help message and exit
--json Print detailed information in JSON format instead of tabular
format
--attr ATTR Filter for a specific attribute. Example: --attr
debug=MyDebugging1
- Following is the syntax for watch logs
2023-02-01:13:40:37 [1] INFO nats_client Creating new SharedPool ...
2023-02-01:13:40:37 [1] INFO nats_client Initiallzing SubMgr for pid=1
2023-02-01:13:40:37 [1] INFO nats_client Saving NATS certificate to file: /tmp/nats_cert_custom_461dedd908ef2d75e509377dfe35be02_1.pem
2023-02-01:13:40:37 [1] INFO nats_client Creating thread-pool of size: 4, PID=1
13:40:37.316 da9d9b28 INFO executor.py:599:send_to_stream [Job da9d9b28a0954327a19c941302ce7947] Status update pipeline=reg-predict-parent-pipeline, type=in-progress
13:40:37.337 da9d9b28 INFO executor.py:599:send_to_stream [Job da9d9b28a0954327a19c941302ce7947] Status update pipeline=reg-predict-parent-pipeline, type=in-progress
13:40:37.355 da9d9b28 INFO executor.py:599:send_to_stream [Job da9d9b28a0954327a19c941302ce7947] Status update pipeline=reg-predict-parent-pipeline, type=in-progress
13:40:38.376 da9d9b28 INFO executor.py:599:send_to_stream [Job da9d9b28a0954327a19c941302ce7947] Status update pipeline=reg-predict-parent-pipeline, type=in-progress
13:40:38.406 da9d9b28 INFO exec_source.py:277:update_data Executing inner pipeline 'reg-predict-child-pipeline', previous_pipelines = ['reg-predict-parent-pipeline']
13:40:38.407 da9d9b28 INFO plumbing_pipeline.py:627:execute_sequence Executing pipeline reg-predict-child-pipeline
13:40:38.408 da9d9b28 INFO plumbing_pipeline.py:661:execute_sequence Executing block reg-predict-child-pipelineb0
13:40:38.408 da9d9b28 INFO executor.py:599:send_to_stream [Job da9d9b28a0954327a19c941302ce7947] Status update pipeline=reg-predict-parent-pipeline, type=in-progress
13:40:38.429 da9d9b28 INFO executor.py:599:send_to_stream [Job da9d9b28a0954327a19c941302ce7947] Status update pipeline=reg-predict-parent-pipeline, type=in-progress
Sub Command: traces
Description: Start watching traces produced by the pipelines
usage: watch [-h] [--json] [--ts] [--attr ATTR]
optional arguments:
-h, --help show this help message and exit
--json Print detailed information in JSON format instead of tabular
format
--ts Show timestamp when printing traces in plain text format
--attr ATTR Filter for a specific attribute. Example: --attr
debug=MyDebugging1
Host Pipeline JobID Seq Status Bot Dataframe Error Message
2023-02-01:13:41:38 [1] INFO nats_client Creating new SharedPool ...
2023-02-01:13:41:38 [1] INFO nats_client Initiallzing SubMgr for pid=1
2023-02-01:13:41:38 [1] INFO nats_client Saving NATS certificate to file: /tmp/nats_cert_custom_461dedd908ef2d75e509377dfe35be02_1.pem
2023-02-01:13:41:38 [1] INFO nats_client Creating thread-pool of size: 4, PID=1
05969789d903 reg-predict-child-pipeline da9d9b28 605 in-progress @dm:enrich 0x12
05969789d903 reg-predict-child-pipeline da9d9b28 605 in-progress @dm:add-missing-columns 0x12
05969789d903 reg-predict-child-pipeline da9d9b28 605 in-progress @dm:eval 0x14
05969789d903 reg-predict-child-pipeline da9d9b28 605 in-progress @dm:eval 0x15
05969789d903 reg-predict-child-pipeline da9d9b28 605 in-progress @dm:eval 0x16
05969789d903 reg-predict-child-pipeline da9d9b28 605 in-progress @dm:eval 0x17
05969789d903 reg-predict-child-pipeline da9d9b28 605 in-progress @dm:eval 0x18
05969789d903 reg-predict-child-pipeline da9d9b28 605 in-progress @dm:change-time-format 0x18
05969789d903 reg-predict-child-pipeline da9d9b28 605 in-progress @rn:write-stream 0x18
05969789d903 reg-predict-child-pipeline da9d9b28 605 in-progress @dm:empty 0x0
05969789d903 reg-predict-child-pipeline da9d9b28 605 in-progress @dm:addrow 0x0
05969789d903 reg-predict-child-pipeline da9d9b28 605 in-progress #dm:query-persistent-stre 1x2
05969789d903 reg-predict-child-pipeline da9d9b28 605 in-progress @dm:save 0x0
05969789d903 reg-predict-child-pipeline da9d9b28 605 in-progress @dm:recall 0x0
05969789d903 reg-predict-child-pipeline da9d9b28 605 in-progress *dm:filter 10x12
- Following is the syntax for watch traces
2023-02-10:07:51:23 [1] INFO nats_client Creating new SharedPool ...
2023-02-10:07:51:23 [1] INFO nats_client Initiallzing SubMgr for pid=1
2023-02-10:07:51:23 [1] INFO nats_client Saving NATS certificate to file: /tmp/nats_cert_custom_461dedd908ef2d75e509377dfe35be02_1.pem
2023-02-10:07:51:24 [1] INFO nats_client Creating thread-pool of size: 4, PID=1
{
"msg_version": "rda:1",
"proc_id": "57",
"proc_info": {
"hostname": "05969789d903",
"cpu_percent": 0.0,
"memory_percent": 1.21,
"mem_mb": 486.3,
"create_time": 1675792948.18,
"cpu_time_user": 111524.55,
"cpu_time_system": 10933.69,
"system_cpu_percents": [
100.0,
33.3,
66.7,
66.7
]
},
"tenant_id": "ae144f67d2a24034ad6920ace6809763",
"pod_id": "d08072c8",
"pod_group": "rda-site-01",
"group_id": "f4a56ba6388c",
Sub Command: worker-obj-info
Description: List all worker pods with their current Object Store configuration
- Following is the syntax for worker-obj-info
Client is configured with following object store
Host : 10.95.122.127:9443
Config Cheksum: b469ce79
2023-02-01:08:49:34 [1] INFO nats_client Saving NATS certificate to file: /tmp/nats_cert_custom_461dedd908ef2d75e509377dfe35be02_1.pem
+--------------+----------+-------------+--------------------+--------------------------------+
| Host | ID | Group | Object Store | Object Store Config Checksum |
|--------------+----------+-------------+--------------------+--------------------------------|
| 05969789d903 | a92cd27b | rda-site-01 | 10.95.122.127:9443 | b469ce79 |
+--------------+----------+-------------+--------------------+--------------------------------+
Sub Command: write-stream
Description: Write data to the specified stream
Usage: write-stream [-h] --name STREAM_NAME --data DATA [--delay DELAY] [--compress]
optional arguments:
-h, --help show this help message and exit
--name STREAM_NAME Stream name to write to
--data DATA File containing either single JSON dict or a list
--delay DELAY Delay between each publish message
--compress Enable compression of the data