Note
The username/password has not been provided in this documentation. If you need access credentials, please reach out to the Support Team at (support@fabrix.ai)
Guide to RDAF Start, Stop Operations
This section explains how to safely start and stop the RDAF infrastructure, platform, application and worker services.
1. Starting RDAF Services
Login into RDAF platform VM using SSH client as rdauser for CLI access and start the below RDAF services in sequence.
- Infrastructure Services
- Platform Services
- Worker Services
- Application Services
Starting RDAF infrastructure services:
Verify RDAF infrastructure services status and make sure all of them are up & running.
+----------------+-----------------+---------------+--------------+------------------------------+
| Name           | Host            | Status        | Container Id | Tag                          |
+----------------+-----------------+---------------+--------------+------------------------------+
| haproxy        | 192.168.125.143 | Up 41 seconds | b68f8335d8ff | 1.0.4                        |
| haproxy        | 192.168.125.144 | Up 41 seconds | 9df14432767c | 1.0.4                        |
| keepalived     | 192.168.125.143 | active        | N/A          | N/A                          |
| keepalived     | 192.168.125.144 | active        | N/A          | N/A                          |
| nats           | 192.168.125.143 | Up 38 seconds | 4f1413239096 | 1.0.4                        |
| nats           | 192.168.125.144 | Up 38 seconds | 0762f5ef3d5e | 1.0.4                        |
| minio          | 192.168.125.143 | Up 37 seconds | c93731b02f95 | RELEASE.2024-12-18T13-15-44Z |
| minio          | 192.168.125.144 | Up 37 seconds | 1b2b545cbd4a | RELEASE.2024-12-18T13-15-44Z |
| minio          | 192.168.125.145 | Up 37 seconds | 289f96a2832e | RELEASE.2024-12-18T13-15-44Z |
| minio          | 192.168.125.146 | Up 36 seconds | f6571bd5e000 | RELEASE.2024-12-18T13-15-44Z |
| mariadb        | 192.168.125.143 | Up 36 seconds | 4e5ca8860c87 | 1.0.4                        |
| mariadb        | 192.168.125.144 | Up 35 seconds | 2c5a4986a6c1 | 1.0.4                        |
| mariadb        | 192.168.125.145 | Up 35 seconds | cf6656241efa | 1.0.4                        |
| opensearch     | 192.168.125.143 | Up 34 seconds | b04ece438490 | 1.0.4                        |
| opensearch     | 192.168.125.144 | Up 34 seconds | ab53cf0abf6d | 1.0.4                        |
| opensearch     | 192.168.125.145 | Up 34 seconds | 7c75c0cffe4a | 1.0.4                        |
| kafka          | 192.168.125.143 | Up 11 seconds | 0278470dd416 | 1.0.4                        |
| kafka          | 192.168.125.144 | Up 12 seconds | ab3e888056a7 | 1.0.4                        |
| kafka          | 192.168.125.145 | Up 30 seconds | 972b78f159c3 | 1.0.4                        |
+----------------+-----------------+---------------+--------------+------------------------------+
Info
Note: Please wait for 60 seconds before starting RDAF platform services
Starting RDAF platform services:
Verify RDAF platform services status and make sure all of them are up & running.
+--------------------------+-----------------+---------------+--------------+--------+
| Name                     | Host            | Status        | Container Id | Tag    |
+--------------------------+-----------------+---------------+--------------+--------+
| cfx-rda-access-manager   | 192.168.125.141 | Up 42 seconds | e4f20012a888 | 8.2.1  |
| cfx-rda-resource-manager | 192.168.125.141 | Up 41 seconds | 52bd03970a53 | 8.2.1  |
| cfx-rda-user-preferences | 192.168.125.141 | Up 41 seconds | 289e90b70b85 | 8.2.1  |
| portal-backend           | 192.168.125.141 | Up 41 seconds | 1887eb44d63d | 8.2.1  |
| portal-frontend          | 192.168.125.141 | Up 40 seconds | 75fd3f691ad8 | 8.2.1  |
| rda_api_server           | 192.168.125.141 | Up 39 seconds | fcbbca53641f | 8.2.1  |
| rda_asm                  | 192.168.125.141 | Up 38 seconds | f931d1e748ae | 8.2.1  |
| rda_asset_dependency     | 192.168.125.141 | Up 37 seconds | e68e03eabe78 | 8.2.1  |
| rda_collector            | 192.168.125.141 | Up 36 seconds | 3c65bad1e013 | 8.2.1  |
| rda_identity             | 192.168.125.141 | Up 35 seconds | 94d67dcb82b9 | 8.2.1  |
| rda_registry             | 192.168.125.141 | Up 34 seconds | 752a0d8dd352 | 8.2.1  |
| rda_sched_admin          | 192.168.125.141 | Up 33 seconds | eabc9a908afb | 8.2.1  |
| rda_scheduler            | 192.168.125.141 | Up 32 seconds | 1b136bac290f | 8.2.1  |
+--------------------------+-----------------+---------------+--------------+--------+
Info
Note: Please wait for 60 seconds before starting RDAF worker services
Starting RDAF worker services:
Verify RDAF worker services status and make sure all of them are up & running.
+------------+-----------------+--------------+--------------+--------+
| Name       | Host            | Status       | Container Id | Tag    |
+------------+-----------------+--------------+--------------+--------+
| rda_worker | 192.168.125.149 | Up 30 seconds | 8a933d1b82df | 8.2.1 |
| rda_worker | 192.168.125.150 | Up 35 seconds | 2a934r1b52dw | 8.2.1 |
+------------+-----------------+---------------+--------------+-------+
Starting RDAF application services:
To start OIA application services
Verify RDAF application services status and make sure all of them are up & running.
+--------------------------+-----------------+---------------+--------------+--------+
| Name                     | Host            | Status        | Container Id | Tag    |
+--------------------------+-----------------+---------------+--------------+--------+
| all-alerts-cfx-rda-      | 192.168.125.146 | Up 40 seconds | d9aed36ddf4b | 8.2.1  |
| dataset-caas             |                 |               |              |        |
| cfx-rda-alert-ingester   | 192.168.125.146 | Up 39 seconds | ef4f031a7b45 | 8.2.1  |
| cfx-rda-alert-processor  | 192.168.125.146 | Up 38 seconds | de9de2959dce | 8.2.1  |
| cfx-rda-app-builder      | 192.168.125.146 | Up 38 seconds | 438b53f06c61 | 8.2.1  |
| cfx-rda-app-controller   | 192.168.125.146 | Up 37 seconds | 2cb10582f881 | 8.2.1  |
| cfx-rda-collaboration    | 192.168.125.146 | Up 36 seconds | 407055e4b862 | 8.2.1  |
| cfx-rda-configuration-   | 192.168.125.146 | Up 35 seconds | b7b08bcb923e | 8.2.1  |
| service                  |                 |               |              |        |
| cfx-rda-event-consumer   | 192.168.125.146 | Up 35 seconds | 73ef798cf0bf | 8.2.1  |
| cfx-rda-file-browser     | 192.168.125.146 | Up 34 seconds | 12135eeccb2d | 8.2.1  |
| cfx-rda-ingestion-       | 192.168.125.146 | Up 33 seconds | a2010475d060 | 8.2.1  |
| tracker                  |                 |               |              |        |
| cfx-rda-irm-service      | 192.168.125.146 | Up 32 seconds | 0e969df37ad0 | 8.2.1  |
| cfx-rda-ml-config        | 192.168.125.146 | Up 31 seconds | c907949bff1d | 8.2.1  |
| cfx-rda-notification-    | 192.168.125.146 | Up 31 seconds | 215c67affb68 | 8.2.1  |
| service                  |                 |               |              |        |
| cfx-rda-reports-registry | 192.168.125.146 | Up 30 seconds | 21828b867a03 | 8.2.1  |
| cfx-rda-smtp-server      | 192.168.125.146 | Up 29 seconds | ee6c90d25afe | 8.2.1  |
| cfx-rda-webhook-server   | 192.168.125.146 | Up 28 seconds | 4659fe639e3c | 8.2.1  |
| current-alerts-cfx-rda-  | 192.168.125.146 | Up 27 seconds | 9c6d30851fe3 | 8.2.1  |
| dataset-caas             |                 |               |              |        |
+--------------------------+-----------------+---------------+--------------+--------+
2. Stopping RDAF Services
Login into RDAF platform VM using SSH client as rdauser for CLI access and stop the below RDAF services in sequence.
- Application Services
- Worker Services
- Platform Services
- Infrastructure Services
To stop RDAF OIA application services, run the below command. Wait until all of the services are stopped.
To stop RDAF worker services, run the below command. Wait until all of the services are stopped.
To stop RDAF platform services, run the below command. Wait until all of the services are stopped.
To stop RDAF infrastructure services, run the below command. Wait until all of the services are stopped.
3. MariaDB Cluster Service
MariaDB is a relational database service that is used to store RDAF platform's user configuration, platform & application service configuration and it's data. RDAF applications such as OIA uses MariaDB to store alerts, incidents, asset inventory data etc. MariaDB supports high availability natively and it can be deployed as Master/Slave or Master/Master configuration using the Galera clustering feature. Within the RDAF platform, MariaDB is deployed as Master/Master (Galera cluster) node configuration. MariaDB service is containerized and configured in a specific way to be compatible with RDAF platform and its application services.
For detailed general documentation, please refer to About MariaDB and About Galera Cluster
MariaDB database mount point on each cluster node:
-
Data mount point:
/var/mysql -
DB service logs path:
/opt/rdaf/logs/mariadb/mariadb.log
MariaDB Galera Cluster graceful start & stop sequence:
Run the below RDAF CLI command from the VM it was installed to start 3 node MariaDB cluster service.
The above command brings up each MariaDB Node in sequential order. It brings up rda-mariadb-mariadb-galera-0 first to bootstrap the cluster and starts the rda-mariadb-mariadb-galera-1 & rda-mariadb-mariadb-galera-2 subsequently to join the MariaDB Galera cluster.
Run the below RDAF CLI command to check mariadb service's UP status.
| mariadb        | 192.168.125.143 | Up 4 weeks | ebcc659a4e07 | 1.0.4   |
| mariadb        | 192.168.125.144 | Up 4 weeks | 89607a3feb76 | 1.0.4   |
| mariadb        | 192.168.125.145 | Up 4 weeks | 482cb9c1e3b3 | 1.0.4   |
Please run the below command and wait till all of the mariadb pods are in Running state and Ready status is 1/1
Run the below commands to check the status of the mariadb cluster. Please verify that the cluster state is in Synced state.
MARIADB_HOST=`cat /opt/rdaf/rdaf.cfg | grep -A3 mariadb | grep datadir | awk '{print $3}' | cut -f1 -d'/'`

MARIADB_USER=`cat /opt/rdaf/rdaf.cfg | grep -A3 mariadb | grep user | awk '{print $3}' | base64 -d`

MARIADB_PASSWORD=`cat /opt/rdaf/rdaf.cfg | grep -A3 mariadb | grep password | awk '{print $3}' | base64 -d`

mysql -u$MARIADB_USER -p$MARIADB_PASSWORD -h $MARIADB_HOST -P3307 -e "show status like 'wsrep_local_state_comment';"
+---------------------------+--------+
| Variable_name             | Value  |
+---------------------------+--------+
| wsrep_local_state_comment | Synced |
+---------------------------+--------+
Run the below commands to check the cluster size of the mariadb cluster. Please verify that the cluster size is 3.
mysql -u$MARIADB_USER -p$MARIADB_PASSWORD -h $MARIADB_HOST -P3307 -e "SHOW GLOBAL STATUS LIKE 'wsrep_cluster_size'";
+--------------------+-------+
| Variable_name      | Value |
+--------------------+-------+
| wsrep_cluster_size | 3     |
+--------------------+-------+
Note
Once the MariaDB Galera cluster is functionally up and running, the determination of the bootstrap node next time to start the cluster depends on the shutdown sequence of the cluster nodes. The cluster node which was stopped last will be used to bootstrap the MariaDB Galera cluster next time.
Run the below rdaf CLI command to stop the MariaDB cluster service on 3 nodes gracefully.
The above command stops the rda-mariadb-mariadb-galera-2 first, rda-mariadb-mariadb-galera-1 next, and finally the rda-mariadb-mariadb-galera-0. In this sequence, since rda-mariadb-mariadb-galera-0 is stopped last, rda-mariadb-mariadb-galera-0 always becomes the bootstrap node to start and initializes the Galera cluster appropriately.
Info
Three node MariaDB Galera cluster provides high availability with a tolerance of 1 node failure.
Run the below RDAF CLI command from the VM it was installed to start 3 node MariaDB cluster service.
Run the below RDAF CLI command to check mariadb service's UP status.
| mariadb        | 192.168.125.143 | Up 4 weeks | ebcc659a4e07 | 1.0.4 |
| mariadb        | 192.168.125.144 | Up 4 weeks | 89607a3feb76 | 1.0.4 |
| mariadb        | 192.168.125.145 | Up 4 weeks | 482cb9c1e3b3 | 1.0.4 |
Run the below RDAF CLI command to check mariadb service's functional health check status.
2022-10-28 20:52:31,926 [rdaf.cmd.infra] INFO     - Running Health Check on mariadb on host 192.168.125.143
2022-10-28 20:52:32,313 [rdaf.cmd.infra] INFO     - Running Health Check on mariadb on host 192.168.125.144
2022-10-28 20:52:32,657 [rdaf.cmd.infra] INFO     - Running Health Check on mariadb on host 192.168.125.145
| mariadb        | Port Connection | OK     | N/A             | 192.168.125.143 | ebcc659a4e07 |
| mariadb        | Service Status  | OK     | N/A             | 192.168.125.143 | ebcc659a4e07 |
| mariadb        | Firewall Port   | OK     | N/A             | 192.168.125.143 | ebcc659a4e07 |
| mariadb        | Port Connection | OK     | N/A             | 192.168.125.144 | 89607a3feb76 |
| mariadb        | Service Status  | OK     | N/A             | 192.168.125.144 | 89607a3feb76 |
| mariadb        | Firewall Port   | OK     | N/A             | 192.168.125.144 | 89607a3feb76 |
| mariadb        | Port Connection | OK     | N/A             | 192.168.125.145 | 482cb9c1e3b3 |
| mariadb        | Service Status  | OK     | N/A             | 192.168.125.145 | 482cb9c1e3b3 |
| mariadb        | Firewall Port   | OK     | N/A             | 192.168.125.145 | 482cb9c1e3b3 |
The above command brings up each MariaDB Node in sequential order. It brings up Node01 first to bootstrap the cluster and starts the Node02 & Node03 subsequently to join the MariaDB Galera cluster.
When Node01 is started first to bootstrap the MariaDB galera cluster, it starts with the below highlighted parameter MARIADB_GALERA_CLUSTER_BOOTSTRAP is set to yes inside the MariaDB docker-compose YAML file. (/opt/rdaf/deployment-scripts/cluster-node-ip/infra.yaml)
  mariadb:
    image: 192.168.125.140:5000/rda-platform-mariadb:1.0.4
    restart: 'no'
    network_mode: host
    mem_limit: 8G
    memswap_limit: 8G
    oom_kill_disable: false
    volumes:
    - /var/mysql:/bitnami/mariadb/data/
    - /opt/rdaf/config/mariadb:/opt/bitnami/mariadb/conf/bitnami/
    - /opt/rdaf/logs/mariadb:/opt/rdaf/log/
    logging:
      driver: json-file
      options:
        max-size: 10m
        max-file: '5'
    environment:
    - MARIADB_GALERA_MARIABACKUP_USER=rdaf_backup
    ...
    ...
    ...
    - MARIADB_GALERA_CLUSTER_ADDRESS=gcomm://192.168.125.143,192.168.125.144,192.168.125.145
    - MARIADB_GALERA_CLUSTER_BOOTSTRAP=yes
Note
Once the MariaDB Galera cluster is functionally up and running, the determination of the bootstrap node next time to start the cluster depends on the shutdown sequence of the cluster nodes. The cluster node which was stopped last should be used to bootstrap the MariaDB Galera cluster next time.
Run the below rdaf CLI command to stop the MariaDB cluster service on 3 nodes gracefully.
The above command stops the Node03 first, Node02 next, and finally the Node01. In this sequence, since Node01 is stopped last, Node01 always becomes the bootstrap node to start and initializes the Galera cluster appropriately.
Info
Three node MariaDB Galera cluster provides high availability with a tolerance of 1 node failure.
3.1 MariaDB Galera cluster multi-node recovery on power failure or a full crash
If the MariaDB Galera cluster nodes are crashed because of power failure on all servers or because of some other server hardware failure, the cluster needs to be brought up carefully to avoid any data loss.
Warning
Below steps are only needed if the MariaDB cluster nodes are not able to come up and keep crash-looping while coming up.
Run the below command to get the MariaDB root user password from Kubernetes secrets vault.
kubectl get secret --namespace rda-fabric rda-mariadb-mariadb-galera -o jsonpath="{.data.mariadb-root-password}" | base64 -d
Run the below command to get the MariaDB mariabackup user password from Kubernetes secrets vault.
- For Kubernetes cluster environment, please follow the below steps.
Run the below command to bring down the MariaDB cluster nodes.
Run the below kubectl command to verify all of the MariaDB pods are terminated and deleted.
Run the below command to delete the MariaDB stateful-set configuration.
Danger
-
If you get empty password for either of the above commands, please do not proceed further and contact CloudFabrix support for further assistance.
-
Please make sure to capture both MariaDB root user's and mariabackup user's passwords appropriately as these two are critical while bringing up the MariaDB cluster nodes.
Run the below command to bootstrap the cluster and bring up all of the MariaDB galera cluster nodes.
Note
-
Copy & paste the MariaDB root user's and mariabackup user's passwords that you extracted from the Kubernetes secret vault from the above steps.
-
Get the MariaDB service's tag version from the
rdafk8s infra status | grep mariadbcommand output.
helm -n rda-fabric install rda-mariadb -f /opt/rdaf/deployment-scripts/mariadb-values.yaml /opt/rdaf/deployment-scripts/helm/rda-mariadb/ \
  --set rootUser.password=<root user password> \
  --set galera.mariabackup.password=<mariabackup user password> \
  --set galera.bootstrap.forceBootstrap=true \
  --set galera.bootstrap.bootstrapFromNode=1 \
  --set galera.bootstrap.forceSafeToBootstrap=true \
  --set podManagementPolicy=Parallel \
  --set image.tag=<tag_version>
helm -n rda-fabric install rda-mariadb -f /opt/rdaf/deployment-scripts/mariadb-values.yaml /opt/rdaf/deployment-scripts/helm/rda-mariadb/ \
  --set rootUser.password=YIKy7pm2 \
  --set galera.mariabackup.password=YIKy7pm2 \
  --set galera.bootstrap.forceBootstrap=true \
  --set galera.bootstrap.bootstrapFromNode=1 \
  --set galera.bootstrap.forceSafeToBootstrap=true \
  --set podManagementPolicy=Parallel \
  --set image.tag=1.0.2
Run the below command to monitor the progress of MariaDB Galera cluster nodes recovery.
Wait until all of the MariaDB Galera nodes are fully up and Ready state is in 1/1 state.
Depends on the size of the MariaDB database size and the performance of the system, the recovery may take from few minutes to 30 or more minutes.
Danger
If MariaDB Galera cluster nodes are not able to recover and keep crash-looping, please contact CloudFabrix support for further assistance.
Once MariaDB Galera cluster nodes are fully up and running, please run the below commands to verify if all of the nodes are in Synced state.
MARIADB_HOST=`cat /opt/rdaf/rdaf.cfg | grep -A3 mariadb | grep datadir | awk '{print $3}' | cut -f1 -d'/'`

MARIADB_USER=`cat /opt/rdaf/rdaf.cfg | grep -A3 mariadb | grep user | awk '{print $3}' | base64 -d`

MARIADB_PASSWORD=`cat /opt/rdaf/rdaf.cfg | grep -A3 mariadb | grep password | awk '{print $3}' | base64 -d`

mysql -u$MARIADB_USER -p$MARIADB_PASSWORD -h $MARIADB_HOST -P3307 -e "show status like 'wsrep_local_state_comment';"
+---------------------------+--------+
| Variable_name             | Value  |
+---------------------------+--------+
| wsrep_local_state_comment | Synced |
+---------------------------+--------+
Once the MariaDB Galera cluster nodes force bootstrapped, please run the below command to clear the force bootstrap setting so that cluster nodes can be restarted gracefully next time.
Note
-
Copy & paste the MariaDB root user's and mariabackup user's passwords that you extracted from the Kubernetes secret vault from the above steps.
-
Get the MariaDB service's tag version from the
rdafk8s infra status | grep mariadbcommand output.
helm -n rda-fabric upgrade rda-mariadb -f /opt/rdaf/deployment-scripts/mariadb-values.yaml /opt/rdaf/deployment-scripts/helm/rda-mariadb/ \
  --set rootUser.password=<root user's password> \
  --set galera.mariabackup.password=<mariabackup user's password> \
  --set podManagementPolicy=Parallel \
  --set image.tag=<tag_version>
helm -n rda-fabric upgrade rda-mariadb -f /opt/rdaf/deployment-scripts/mariadb-values.yaml /opt/rdaf/deployment-scripts/helm/rda-mariadb/ \
  --set rootUser.password=YIKy7pm2 \
  --set galera.mariabackup.password=YIKy7pm2 \
  --set podManagementPolicy=Parallel \
  --set image.tag=1.0.2
Run the below command to monitor the progress of MariaDB Galera cluster nodes restart.
Wait until all of the MariaDB Galera nodes are fully up and Ready state is in 1/1 state.
Once MariaDB Galera cluster nodes are fully up and running, please run the below commands to verify if all of the nodes are in Synced state.
MARIADB_HOST=`cat /opt/rdaf/rdaf.cfg | grep -A3 mariadb | grep datadir | awk '{print $3}' | cut -f1 -d'/'`

MARIADB_USER=`cat /opt/rdaf/rdaf.cfg | grep -A3 mariadb | grep user | awk '{print $3}' | base64 -d`

MARIADB_PASSWORD=`cat /opt/rdaf/rdaf.cfg | grep -A3 mariadb | grep password | awk '{print $3}' | base64 -d`

mysql -u$MARIADB_USER -p$MARIADB_PASSWORD -h $MARIADB_HOST -P3307 -e "show status like 'wsrep_local_state_comment';"
+---------------------------+--------+
| Variable_name             | Value  |
+---------------------------+--------+
| wsrep_local_state_comment | Synced |
+---------------------------+--------+
Run the below commands to check the cluster size of the mariadb cluster. Please verify that the cluster size is 3.
mysql -u$MARIADB_USER -p$MARIADB_PASSWORD -h $MARIADB_HOST -P3307 -e "SHOW GLOBAL STATUS LIKE 'wsrep_cluster_size'";
+--------------------+-------+
| Variable_name      | Value |
+--------------------+-------+
| wsrep_cluster_size | 3     |
+--------------------+-------+
Reset POD Management Policy to OrderedReady:
Note
These steps are optional, but handy incase if the POD Management policy need to be changed from Paralell to OrderedReady
During the MariaDB Galera cluster nodes force recovery, the POD Management policy is set to Parallel from the initial setting of OrderedReady.
Below steps can be followed to change the POD Management policy back to OrderedReady
Run the below commands in sequence to bring down each MariaDB Galera cluster nodes.
Bring down node rda-mariadb-mariadb-galera-2
Verify the node rda-mariadb-mariadb-galera-2 is terminated and deleted.
Bring down node rda-mariadb-mariadb-galera-1
Verify the node rda-mariadb-mariadb-galera-1 is terminated and deleted.
Bring down node rda-mariadb-mariadb-galera-0
Verify the node rda-mariadb-mariadb-galera-0 is terminated and deleted.
Edit MariaDB service's /opt/rdaf/deployment-scripts/mariadb-values.yaml configuration file and add the parameter to set the POD Management policy to OrderedReady
image:
  registry: 192.168.125.140:5000
  repository: rda-platform-mariadb
  tag: 1.0.4
  pullPolicy: IfNotPresent
  pullSecrets:
    - cfxregistry-cred
podLabels:
  app: rda-fabric-services
  app_category: rdaf-infra
  app_component: rda-mariadb
podManagementPolicy: OrderedReady
resources:
  requests: {}
  limits:
    memory: 8Gi
....
....
Run the below command to delete the MariaDB stateful-set configuration.
Re-deploy the MariaDB Galera cluster service using the below command.
Warning
Please make sure to use the same tag version using which initial MariaDB Galera cluster service was deployed. You can get the tag version running the below command.
Run the below command to monitor the progress of MariaDB Galera cluster nodes configuration upgrade status.
Wait until all of the MariaDB Galera nodes are fully up and Ready state is in 1/1 state.
Once MariaDB Galera cluster nodes are fully up and running, please run the below commands to verify if all of the nodes are in Synced state.
MARIADB_HOST=`cat /opt/rdaf/rdaf.cfg | grep -A3 mariadb | grep datadir | awk '{print $3}' | cut -f1 -d'/'`

MARIADB_USER=`cat /opt/rdaf/rdaf.cfg | grep -A3 mariadb | grep user | awk '{print $3}' | base64 -d`

MARIADB_PASSWORD=`cat /opt/rdaf/rdaf.cfg | grep -A3 mariadb | grep password | awk '{print $3}' | base64 -d`

mysql -u$MARIADB_USER -p$MARIADB_PASSWORD -h $MARIADB_HOST -P3307 -e "show status like 'wsrep_local_state_comment';"
+---------------------------+--------+
| Variable_name             | Value  |
+---------------------------+--------+
| wsrep_local_state_comment | Synced |
+---------------------------+--------+
Run the below commands to check the cluster size of the mariadb cluster. Please verify that the cluster size is 3.
mysql -u$MARIADB_USER -p$MARIADB_PASSWORD -h $MARIADB_HOST -P3307 -e "SHOW GLOBAL STATUS LIKE 'wsrep_cluster_size'";
If the MariaDB Galera cluster nodes are crashed because of power failure on all servers or because of some other server hardware failure, the cluster needs to be brought up carefully in a particular order to avoid any data loss.
First, we need to identify which node is eligible to bootstrap the MariaDB Galera cluster. For that, below are the two available methods.
- Identify the node which has highest seqno value.
Tip
A cluster node will only have positive highest seqno value when atleast one of the node was able to gracefully shutdown. This is the node that needs to be started first to bootstrap the MariaDB Galera cluster.
OR
- Identify the node which has recorded the last committed transaction.
Login into MariaDB cluster Node03 using SSH client to access the CLI. (username: rdauser)
Following shows the content of grastate.dat in Node03. In this example, this node has negative seqno and no group ID (uuid). This is the case when a node crashes during Data Definition Language (DDL) processing:
# GALERA saved state
version: 2.1
uuid: 886dd8da-3d07-11e8-a109-8a3c80cebab4
seqno: -1
safe_to_bootstrap: 0
Following is the content of grastate.dat on Node01 with the highest seqno value:
# GALERA saved state
version: 2.1
uuid: 886dd8da-3d07-11e8-a109-8a3c80cebab4
seqno: 31929
safe_to_bootstrap: 1
Note
If all of the 3 cluster nodes contain the value of -1 for seqno and 0 for safe_to_bootstrap, that is an indication that a full cluster crash has occurred. Go to the Next Section of this document (Recover MariaDB Galera cluster using a Node that has committed the last transaction)
The MariaDB node with the highest seqno value is an appropriate Node to bootstrap the MariaDB Galera cluster.
Follow the below steps to bootstrap and bring up the MariaDB cluster:
Step-1: Login into the MariaDB bootstrap node using an SSH client as a rdauser user. (bootstrap node is identified using one of the above-mentioned procedures)
Step-2: Stop the mariadb service.
Change the directory to /opt/rdaf/deployment-scripts/<node_ip_address> and execute the below command.
Step-3: Change the directory to /opt/rdaf/deployment-scripts/<node_ip_address>. Edit infra.yaml docker-compose file and configure the environment variable as highlighted below to enable boot-strapping the mariadb cluster.
mariadb:
    image: 192.168.125.140:5000/rda-platform-mariadb:1.0.4
    restart: 'no'
    network_mode: host
    mem_limit: 8G
    memswap_limit: 8G
    oom_kill_disable: false
    volumes:
    - /var/mysql:/bitnami/mariadb/data/
    - /opt/rdaf/config/mariadb:/opt/bitnami/mariadb/conf/bitnami/
    - /opt/rdaf/logs/mariadb:/opt/rdaf/log/
    logging:
    driver: json-file
    options:
        max-size: 10m
        max-file: '5'
    environment:
    - MARIADB_GALERA_MARIABACKUP_USER=rdaf_backup
    ...
    ...
    ...
    - MARIADB_GALERA_CLUSTER_ADDRESS=gcomm://192.168.125.143,192.168.125.144,192.168.125.145
    - MARIADB_GALERA_CLUSTER_BOOTSTRAP=yes
Step-4: Edit /var/mysql/grastate.dat file and make sure safe_to_bootstrap value is set to 1 and save the file.
Step-5: Start the MariaDB container using the below command.
After starting the MariaDB container, watch the log messages @ the below log file
/opt/rdaf/logs/mariadb/mariadb.log
and look for the below log message which confirms the Node is completely up and in the synced state.
WSREP: Server status change joined -> synced
Additionally, run the below command to verify the MariaDB cluster bootstrap node is completely up in the synced state.
mysql -u <username> -p<password> -h <node-ip> -P 3306 -e "show status like 'wsrep_local_state_comment';"
+---------------------------+--------+
| Variable_name             | Value  |
+---------------------------+--------+
| wsrep_local_state_comment | Synced |
+---------------------------+--------+
Once the MariaDB bootstrap cluster node is up, continue the below steps to bring up the rest of the 2 Nodes.
Step-5: Login into the MariaDB rest of the nodes (no specific order) using SSH client as rdauser.
Step-6: Change the directory to /opt/rdaf/deployment-scripts/<node_ip_address>. Edit infra.yaml docker-compose file and make sure the below highlighted parameter MARIADB_GALERA_CLUSTER_BOOTSTRAP doesn't exist, if yes, just remove it to disable boot-strapping the mariadb cluster.
mariadb:
    image: 192.168.125.140:5000/rda-platform-mariadb:1.0.4
    restart: 'no'
    network_mode: host
    mem_limit: 8G
    memswap_limit: 8G
    oom_kill_disable: false
    volumes:
    - /var/mysql:/bitnami/mariadb/data/
    - /opt/rdaf/config/mariadb:/opt/bitnami/mariadb/conf/bitnami/
    - /opt/rdaf/logs/mariadb:/opt/rdaf/log/
    logging:
    driver: json-file
    options:
        max-size: 10m
        max-file: '5'
    environment:
    - MARIADB_GALERA_MARIABACKUP_USER=rdaf_backup
    ...
    ...
    ...
    - MARIADB_GALERA_CLUSTER_ADDRESS=gcomm://192.168.125.143,192.168.125.144,192.168.125.145
    - MARIADB_GALERA_CLUSTER_BOOTSTRAP=yes
Note
The above parameter is applicable only on the MariaDB cluster's bootstrap node which initializes the Galera cluster.
Step-7: Start the MariaDB container using the below command.
After starting the MariaDB container, watch the log messages @ the below log file
/opt/rdaf/logs/mariadb/mariadb.log
and look for the below log message which confirms the Node is completely up and in the synced state.
WSREP: Server status change joined -> synced
Additionally, run the below command to verify the MariaDB cluster bootstrap node is completely up in the synced state.
mysql -u <username> -p<password> -h <node-ip> -P 3306 -e "show status like 'wsrep_local_state_comment';"
+---------------------------+--------+
| Variable_name             | Value  |
+---------------------------+--------+
| wsrep_local_state_comment | Synced |
+---------------------------+--------+
Note
When second or third nodes are coming up after the crash and syncing up with the Cluster's bootstrap node, it may take few minutes or a little longer to be completely up and synced state.
Step-8: On the last MariaDB node, please follow the procedure listed in Step-6 and Step-7
Step-9: Once the MariaDB cluster nodes are completely up and functional, login into Node01 and edit the MariaDB docker-compose file infra.yaml and make sure to add the highlighted parameter MARIADB_GALERA_CLUSTER_BOOTSTRAP as environment variable and save it. (Configuration file location: /opt/rdaf/deployment-scripts/<node-ip-address>/infra.yaml)
mariadb:
    image: 192.168.125.140:5000/rda-platform-mariadb:1.0.4
    restart: 'no'
    network_mode: host
    mem_limit: 8G
    memswap_limit: 8G
    oom_kill_disable: false
    volumes:
    - /var/mysql:/bitnami/mariadb/data/
    - /opt/rdaf/config/mariadb:/opt/bitnami/mariadb/conf/bitnami/
    - /opt/rdaf/logs/mariadb:/opt/rdaf/log/
    logging:
    driver: json-file
    options:
        max-size: 10m
        max-file: '5'
    environment:
    - MARIADB_GALERA_MARIABACKUP_USER=rdaf_backup
    ...
    ...
    ...
    - MARIADB_GALERA_CLUSTER_ADDRESS=gcomm://192.168.125.143,192.168.125.144,192.168.125.145
    - MARIADB_GALERA_CLUSTER_BOOTSTRAP=yes
On Node2 & Node03, edit the MariaDB docker-compose file infra.yaml and make sure the above environment variable is not set. This is to make sure rdaf CLI starts the Node01 as cluster bootstrap node first when it is executed manually to bring up the MariaDB cluster nodes.
- To bring down the MariaDB service, please use the command given below
- To upgrade the MariaDB service to Tag 1.0.4, use the following command
Note
MariaDB Galera cluster node order (i.e Node01, Node02 & Node03) is determined based on the order of comma-separated IP address list provided during the rdaf setup command which configures initial configuration of the RDAF platform.
Step-1: Login into MariaDB cluster Node01 using SSH client to access the CLI. (username: rdauser)
Step-2: Run the below command to find the Mariadb container ID
Note
Please make sure the MariaDB container is in a stopped state or run the below command to stop the MariaDB container.
Step-3: Take a backup of the MariaDB configuration file.
Change the directory to /opt/rdaf/deployment-scripts/<node_ip_address>. Edit infra.yaml docker-compose file and configure the environment variable as highlighted below to disable boot-strapping the mariadb cluster.
mariadb:
    image: 192.168.125.140:5000/rda-platform-mariadb:1.0.4
    restart: 'no'
    network_mode: host
    mem_limit: 8G
    memswap_limit: 8G
    oom_kill_disable: false
    volumes:
    - /var/mysql:/bitnami/mariadb/data/
    - /opt/rdaf/config/mariadb:/opt/bitnami/mariadb/conf/bitnami/
    - /opt/rdaf/logs/mariadb:/opt/rdaf/log/
    logging:
    driver: json-file
    options:
        max-size: 10m
        max-file: '5'
    environment:
    - MARIADB_GALERA_MARIABACKUP_USER=rdaf_backup
    ...
    ...
    ...
    - MARIADB_GALERA_CLUSTER_ADDRESS=gcomm://192.168.125.143,192.168.125.144,192.168.125.145
    - MARIADB_GALERA_CLUSTER_BOOTSTRAP=no
Note
The above environment variable MARIADB_GALERA_CLUSTER_BOOTSTRAP is applicable only on the MariaDB cluster's bootstrap node which initializes the Galera cluster.
If MARIADB_GALERA_CLUSTER_BOOTSTRAP is modified in infra.yml file, please run the below commands to stop the MariaDB service.
Step-4: Edit the MariaDB configuration file and add the below specified option. (Configuration file location: /opt/rdaf/config/mariadb/my_custom.cnf)
Step-5: Start the MariaDB service and wait for 2 to 3 minutes to allow it to be completely up.
Step-6: Tail mariadb service log and look for similar to the below message. (/opt/rdaf/logs/mariadb/mariadb.log)
From the 'Recovered position' output above, note down the numeric value at the end (e.g., 397159) and follow the same steps from Step-4 through Step-6 for Node02 & Node03.
The MariaDB node with the latest data will have the highest value and that is an appropriate Node to bootstrap the MariaDB Galera cluster.
Follow the below steps to bring up the MariaDB Galera cluster:
Step-1: Login into the MariaDB that was identified as a bootstrap node (node that has the highest recovered position value) using an SSH client as a rdauser user.
Note
If all nodes have same recovered position value, pick any one of the node.
Step-2: Change the directory to /opt/rdaf/deployment-scripts/<node_ip_address>. Edit infra.yaml docker-compose file and configure the environment variable as highlighted below to enable boot-strapping the mariadb cluster.
mariadb:
    image: 192.168.125.140:5000/rda-platform-mariadb:1.0.4
    restart: 'no'
    network_mode: host
    mem_limit: 8G
    memswap_limit: 8G
    oom_kill_disable: false
    volumes:
    - /var/mysql:/bitnami/mariadb/data/
    - /opt/rdaf/config/mariadb:/opt/bitnami/mariadb/conf/bitnami/
    - /opt/rdaf/logs/mariadb:/opt/rdaf/log/
    logging:
    driver: json-file
    options:
        max-size: 10m
        max-file: '5'
    environment:
    - MARIADB_GALERA_MARIABACKUP_USER=rdaf_backup
    ...
    ...
    ...
    - MARIADB_GALERA_CLUSTER_ADDRESS=gcomm://192.168.125.143,192.168.125.144,192.168.125.145
    - MARIADB_GALERA_CLUSTER_BOOTSTRAP=yes
Edit my_custom.cnf configuration file and make sure the below parameter is removed and save it. (Configuration file location: /opt/rdaf/config/mariadb/my_custom.cnf)
Step-3: Edit /var/mysql/grastate.dat file and set safe_to_bootstrap value as 1 and save the file.
Step-4: Stop the MariaDB container using the below command. (infra.yaml file is under /opt/rdaf/deployment-scripts/<node_ip_address>)
Step-5: Start the MariaDB service using the below command.
After starting the MariaDB service, watch the log messages @ the below log file
and look for the below log message which confirms the Node is completely up and in the synced state.
Additionally, run the below command to verify the MariaDB cluster bootstrap node is completely up in the synced state.
mysql -u <username> -p<password> -h <node-ip> -P 3306 -e "show status like 'wsrep_local_state_comment';"
+---------------------------+--------+
| Variable_name             | Value  |
+---------------------------+--------+
| wsrep_local_state_comment | Synced |
+---------------------------+--------+
Once the MariaDB bootstrap cluster node is up, continue the below steps to bring up the rest of the 2 Nodes.
Step-5: Login into the MariaDB rest of the nodes (no specific order) using SSH client as rdauser.
Step-6: Change the directory to /opt/rdaf/deployment-scripts/<node_ip_address>. Edit infra.yaml docker-compose file and make sure the below highlighted parameter MARIADB_GALERA_CLUSTER_BOOTSTRAP doesn't exist, if yes, just remove it to disable boot-strapping the mariadb cluster.
mariadb:
    image: 192.168.125.140:5000/rda-platform-mariadb:1.0.4
    restart: 'no'
    network_mode: host
    mem_limit: 8G
    memswap_limit: 8G
    oom_kill_disable: false
    volumes:
    - /var/mysql:/bitnami/mariadb/data/
    - /opt/rdaf/config/mariadb:/opt/bitnami/mariadb/conf/bitnami/
    - /opt/rdaf/logs/mariadb:/opt/rdaf/log/
    logging:
    driver: json-file
    options:
        max-size: 10m
        max-file: '5'
    environment:
    - MARIADB_GALERA_MARIABACKUP_USER=rdaf_backup
    ...
    ...
    ...
    - MARIADB_GALERA_CLUSTER_ADDRESS=gcomm://192.168.125.143,192.168.125.144,192.168.125.145
    - MARIADB_GALERA_CLUSTER_BOOTSTRAP=yes
Note
The above environment variable MARIADB_GALERA_CLUSTER_BOOTSTRAP is applicable only on the MariaDB cluster's bootstrap node which initializes the Galera cluster.
Step-7: Edit my_custom.cnf configuration file and make sure the below parameter doesn't exist, if yes, just remove it. (Configuration file location: /opt/rdaf/config/mariadb/my_custom.cnf)
Step-8: Start the MariaDB container using the below command. Change the directory to /opt/rdaf/deployment-scripts/<node_ip_address>
After starting the MariaDB container, watch the log messages @ the below log file
and look for the below log message which confirms the Node is completely up and in the synced state.
Additionally, run the below command to verify the MariaDB cluster bootstrap node is completely up in the synced state.
mysql -u <username> -p<password> -h <node-ip> -P 3306 -e "show status like 'wsrep_local_state_comment';"
+---------------------------+--------+
| Variable_name             | Value  |
+---------------------------+--------+
| wsrep_local_state_comment | Synced |
+---------------------------+--------+
Note
When second or third nodes are coming up after the crash and syncing up with the Cluster's bootstrap node, it may take few minutes or a little longer to be completely up and in synced state.
Step-9: On the last MariaDB node, please follow the procedure listed in Step-6
Step-10: Once the MariaDB cluster nodes are completely up and functional, login into Node01 and edit the MariaDB docker-compose file infra.yaml and make sure to add the highlighted parameter MARIADB_GALERA_CLUSTER_BOOTSTRAP as environment variable and save it. (Configuration file location: /opt/rdaf/deployment-scripts/<node-ip-address>/infra.yaml)
mariadb:
    image: 192.168.125.140:5000/rda-platform-mariadb:1.0.4
    restart: 'no'
    network_mode: host
    mem_limit: 8G
    memswap_limit: 8G
    oom_kill_disable: false
    volumes:
    - /var/mysql:/bitnami/mariadb/data/
    - /opt/rdaf/config/mariadb:/opt/bitnami/mariadb/conf/bitnami/
    - /opt/rdaf/logs/mariadb:/opt/rdaf/log/
    logging:
    driver: json-file
    options:
        max-size: 10m
        max-file: '5'
    environment:
    - MARIADB_GALERA_MARIABACKUP_USER=rdaf_backup
    ...
    ...
    ...
    - MARIADB_GALERA_CLUSTER_ADDRESS=gcomm://192.168.125.143,192.168.125.144,192.168.125.145
    - MARIADB_GALERA_CLUSTER_BOOTSTRAP=yes
On Node2 & Node03, edit the MariaDB docker-compose file infra.yaml and make sure the above environment variable is not set or removed. This is to make sure rdaf CLI starts the Node01 as cluster bootstrap node first when it is executed manually to bring up the MariaDB cluster nodes.
Note
MariaDB Galera cluster node order (i.e Node01, Node02 & Node03) is determined based on the order of comma-separated IP address list provided during the rdaf setup command which configures initial configuration of the RDAF platform.
4. Install & Configure RDAF Log Streaming
RDAF is built on cloud native and distributed microservices architecture. When it is deployed, it installs below services.
- Infrastructure Services
- Core Platform Services
- Application Services
- Worker Services
All of these services generate log events which reflects the operational health of the RDAF platform in realtime.
As RDAF platform has many microservices, it becomes difficult to monitor and analyze all of the microservices logs for any operational analysis or troubleshooting when needed.
To address the above mentioned challenge, RDAF provides below log streaming services which helps to stream the logs of all RDAF platform's microservices and ingest them into RDAF pstreams in realtime.
- Logstash: It is a service which processes incoming log stream from Fluentbit, normalizes different log formats of RDAF service logs into a common data model and ingest them into RDAF's Opensearch index store. Additionally, it supports forwarding the processed logs to external log management tools such as Splunk, Elasticsearch, IBM Qradar etc..
- Fluentbit: It is a very light weight log shipping agent which monitors the RDAF service logs and forward them to Logstash service in realtime.
Once the RDAF platform service's logs are ingested into pstreams, they can be visualized and analyzed using RDAF's composable dashboards or use rdac pstream query or rdac pstream tail CLI options to access the logs in realtime.
The following section provides you the instructions on how to install and configure both Logstash and Fluentbit log streaming services.
4.1 Logstash Installation & Configuration
Important
Pre-requisites:
- Install Logstash on where RDAF CLI was installed and the rdaf setup was run.
- Access to /opt/rdaf/rdaf.cfg configuration file
- Access to /opt/rdaf/config/network_config/config.json configuration file
- Access to /opt/rdaf/cert/ca/ca.crt certificate file
- rdac CLI was installed, please refer RDAC CLI Installation
Tip
To use rdac.py as a regular command, follow the below steps
Step-1:
Run the below command to create and save the docker login session into CloudFabrix's secure docker repository.
Run the below sequence of commands to create the required directory structure and set the permissions.
sudo mkdir -p /opt/logstash/config
sudo mkdir -p /opt/logstash/config/cert
sudo mkdir -p /opt/logstash/pipeline
sudo mkdir -p /opt/logstash/templates
sudo mkdir -p /opt/logstash/data
sudo mkdir -p /opt/logstash/logs
sudo chown -R `id -u`:`id -g` /opt/logstash
Step-2:
Copy the CA certificate to Logstash configuration folder
Step-3:
Enable the required firewall ports for Logstash to receive the log events from Fluentbit
Step-4:
Create the required RDAF pstreams to ingest the RDAF service logs.
tenant_id=`cat /opt/rdaf/config/network_config/config.json | grep tenant_id | awk '{print $2}' | cut -f2 -d"\""`

rdac pstream add --name rdaf_services_logs --index $tenant_id-stream-rdaf_services_logs --retention_days 15 --timestamp @timestamp
Step-5:
Run the below command to view and verify the above RDAF pstreams are created.
Step-6:
Create the docker-compose file as shown below, install and bring the service up.
cd /opt/logstash

cat > logstash-docker-compose.yml <<'EOF'
version: '3'

services:
  logstash:
    image: "cfxregistry.cloudfabrix.io/rda-platform-logstash:1.0.2"
    container_name: rda_logstash
    hostname: rda_logstash
    network_mode: host
    restart: always
    oom_kill_disable: false
    user: root
    mem_limit: 6G
    memswap_limit: 6G
    logging:
      driver: "json-file"
      options:
        max-size: "25m"
        max-file: "5"
    volumes:
      - /opt/logstash/config:/usr/share/logstash/config
      - /opt/logstash/pipeline:/usr/share/logstash/pipeline
      - /opt/logstash/templates:/usr/share/logstash/templates
      - /opt/logstash/data:/usr/share/logstash/data
      - /opt/logstash/logs:/usr/share/logstash/logs
    environment:
      LS_JAVA_OPTS: -Xmx4g -Xms4g
    command: logstash

EOF
Step-7:
Configure the Logstash service and restart it.
tenant_id=`cat /opt/rdaf/config/network_config/config.json | grep tenant_id | awk '{print $2}' | cut -f2 -d"\""`
opensearch_host=`cat /opt/rdaf/rdaf.cfg | grep -A3 "\[opensearch\]" | grep datadir | awk '{print $3}' | cut -f1 -d"/"`
opensearch_user=`cat /opt/rdaf/rdaf.cfg | grep -A3 "\[opensearch\]" | grep user | awk '{print $3}' | base64 -d`
opensearch_password=`cat /opt/rdaf/rdaf.cfg | grep -A3 "\[opensearch\]" | grep password | awk '{print $3}' | base64 -d`

sed -i "s/TENANT_ID/$tenant_id/g" /opt/logstash/pipeline/rda_services.conf
sed -i "s/localhost/$opensearch_host/g" /opt/logstash/pipeline/rda_services.conf
sed -i "s/OS_USERNAME/$opensearch_user/g" /opt/logstash/pipeline/rda_services.conf
sed -i "s/OS_PASSWORD/$opensearch_password/g" /opt/logstash/pipeline/rda_services.conf

sed -i "s/TENANT_ID/$tenant_id/g" /opt/logstash/pipeline/rda_minio.conf
sed -i "s/localhost/$opensearch_host/g" /opt/logstash/pipeline/rda_minio.conf
sed -i "s/OS_USERNAME/$opensearch_user/g" /opt/logstash/pipeline/rda_minio.conf
sed -i "s/OS_PASSWORD/$opensearch_password/g" /opt/logstash/pipeline/rda_minio.conf

logstash_container_id=`docker ps -a | grep rda-platform-logstash | awk '{print $1}'`

docker restart $logstash_container_id
4.2 Fluentbit Installation & Configuration
Important
Pre-requisites:
- Logstash service was installed, please refer above section for installing the Logstash service.
- Firewall ports 5045 & 5046 are open on Logstash host.
Install & configure Fluentbit log shipping agent on all of the RDAF infrastructure, platform, application and worker service VMs.
Step-1:
Run the below command to create and save the docker login session into CloudFabrix's secure docker repository.
Run the below sequence of commands to create the required directory structure and set the permissions.
sudo mkdir -p /opt/fluent-bit/config
sudo mkdir -p /opt/fluent-bit/logs
sudo mkdir -p /opt/fluent-bit/data
sudo chown -R `id -u`:`id -g` /opt/fluent-bit
Step-2:
Create the docker-compose file as shown below, install and bring the service up.
cd /opt/fluent-bit

cat > fluentbit-docker-compose.yml <<'EOF'
version: "3"
services:
  fluentbit:
    container_name: rda-platform-fluentbit
    image: cfxregistry.cloudfabrix.io/rda-platform-fluent-bit:1.0.2
    restart: always
    network_mode: host
    oom_kill_disable: false
    mem_limit: 4G
    memswap_limit: 4G
    logging:
      driver: "json-file"
      options:
        max-size: "25m"
        max-file: "5"
    volumes:
      - /opt/fluent-bit/config:/fluent-bit/config
      - /opt/fluent-bit/logs:/fluent-bit/logs
      - /opt/fluent-bit/data:/fluent-bit/data
      - /opt/rdaf/logs:/applogs
      - /var/log:/syslog:ro
    entrypoint: ["/fluent-bit/bin/docker-entry-point.sh"]

EOF
Step-3:
Configure the Fluentbit log shipping agent and restart it.
Set the Logstash IP Address for below variable.
Warning
Please make sure to set the correct Logstash host's IP address to above variable before running the below commands.
sed -i "s/localhost/$logstash_ip/g" /opt/fluent-bit/config/fluent-bit-output.conf

fluentbit_container_id=`docker ps -a | grep rda-platform-fluent-bit | awk '{print $1}'`

docker restart $fluentbit_container_id
4.3 Enabling Minio service logs
Minio object storage service does not write the server and audit log messages to disk, instead, it provides an option to configure a webhook endpoint to push the server and audit log events.
Follow the below steps to enable and stream the Minio logs to Logstash service.
Important
- Run the below commands where
rdaf setupwas run - Access to
/opt/rdaf/rdaf.cfg mcCLI (Minio Client)
Run the below commands to configure Minio service to push the server and audit logs to Logstash service.
- Configure Minio service access settings using
mcCLI (Minio Client)
minio_host=`cat /opt/rdaf/rdaf.cfg | grep -A3 "\[minio\]" | grep datadir | awk '{print $3}' | cut -f1 -d"/"`
minio_user=`cat /opt/rdaf/rdaf.cfg | grep -A3 "\[minio\]" | grep user | awk '{print $3}' | base64 -d`
minio_password=`cat /opt/rdaf/rdaf.cfg | grep -A4 "\[minio\]" | grep password | awk '{print $3}' | base64 -d`

mc alias set myminio http://$minio_host:9000 $minio_user $minio_password
- Set the Logstash IP Address for below variable.
Warning
Please make sure to set the correct Logstash host's IP address to above variable before running the below commands.
- Configure the Minio service to forward both server and audit logs to Logstash service.
mc admin config set myminio/ logger_webhook:"rdaf_log_streaming" endpoint="http://$logstash_ip:5046"
mc admin config set myminio/ audit_webhook:"rdaf_log_streaming" endpoint="http://$logstash_ip:5046"
4.4 Search and Query RDAF service logs from pstreams
RDAF service logs are ingested into the below pstream which can be queried or tailed using rdac CLI
PStream Name:
- rdaf_services_logs: It indexes the RDAF service logs from below
- OS syslog / messages
- MariaDB
- NATs
- Kafka
- Zookeeper
- Opensearch
- Minio
- HAProxy Supervisor
- RDA core platform services
- OIA application services
- RDA Portal backend service
- RDA Portal frontend service
- RDA HAProxy Access Logs
Below are the extracted / enriched / normalized attributes which can be used to query the logs from the above pstreams.
Attribute Name |
Attribute Value |
|---|---|
service_name |
rda_access_managerrda_alert_ingesterrda_alert_processorrda_all_alerts_caasrda_api_serverrda_app_builderrda_app_controllerrda_asset_dependencyrda_collaborationrda_collectorrda_config_servicerda_current_alerts_caasrda_event_consumerrda_file_browserrda_haproxyrda_identityrda_ingestion_trackerrda_irm_servicerda_kafkarda_mariadbrda_miniorda_ml_configrda_natsrda_notification_servicerda_opensearchrda_os_syslogrda_portal_backendrda_portal_frontendrda_registryrda_reports_registryrda_resource_managerrda_schedule_adminrda_schedulerrda_smtp_serverrda_user_preferencesrda_webhook_serverrda_worker |
service_category |
rda_app_svcsrda_pfm_svcsrda_infra_svcs |
service_host |
Hostname of RDAF VM. Ex: rda-platform-vm01 |
log_severity |
INFOWARNINGERRORDEBUGTRACE |
log_message |
Extracted log message. Ex: pod age greater than 60 pod_id: 1091635f, pod_type:cfxdimensions-app-access-manager, inactive_pods: {'d0a17813', '1091635f', '766cbf82'} |
process_name |
RDAF platform or app service's internal process name captured within the log message. Ex: rda_messaging.nats_client |
process_function |
RDAF platform or app service's internal process function name captured within the log message. Ex: health_check |
thread_id |
RDAF platform or app service's internal thread ID captured within the log message. Ex: Thread-9 |
log |
Full raw log message. Ex: 2022-09-22 01:47:59,611 [PID=8:TID=Thread-9:rda_messaging.nats_client:health_check:435] INFO - Sef health check successfull |
host |
RDAF VM host's IP Address. Ex: 192.168.10.11 |
Tail logs from pstream:
Run the below command to tail pstream rdaf_services_logs for RDAF platform registry service.
rdac pstream tail --name rdaf_services_logs --ts @timestamp --query "service_name = 'rda_registry'" --out_cols 'log'
--query supports CFXQL query. However it doesn't support get columns option.
--out_cols use this option to get specific attributes from the pstream as shown in the above example.
--json use this option to get the log output in JSON format. However, it doesn't support limiting the selective attributes listed under --out_cols option.
Run the below command to tail only ERROR messages across all RDAF platform and application services.
rdac pstream tail --name rdaf_services_logs --ts @timestamp --query "log_severity = 'ERROR'" --out_cols 'service_name,log'
Query logs from pstream:
Run the below command to query the pstream rdaf_services_logs for ERROR messages from all services within last 24 hours.
rdac pstream query --name rdaf_services_logs --ts @timestamp --query '"\`@timestamp\`" is after -1d and log_severity = 'ERROR' get service_name,log' --json
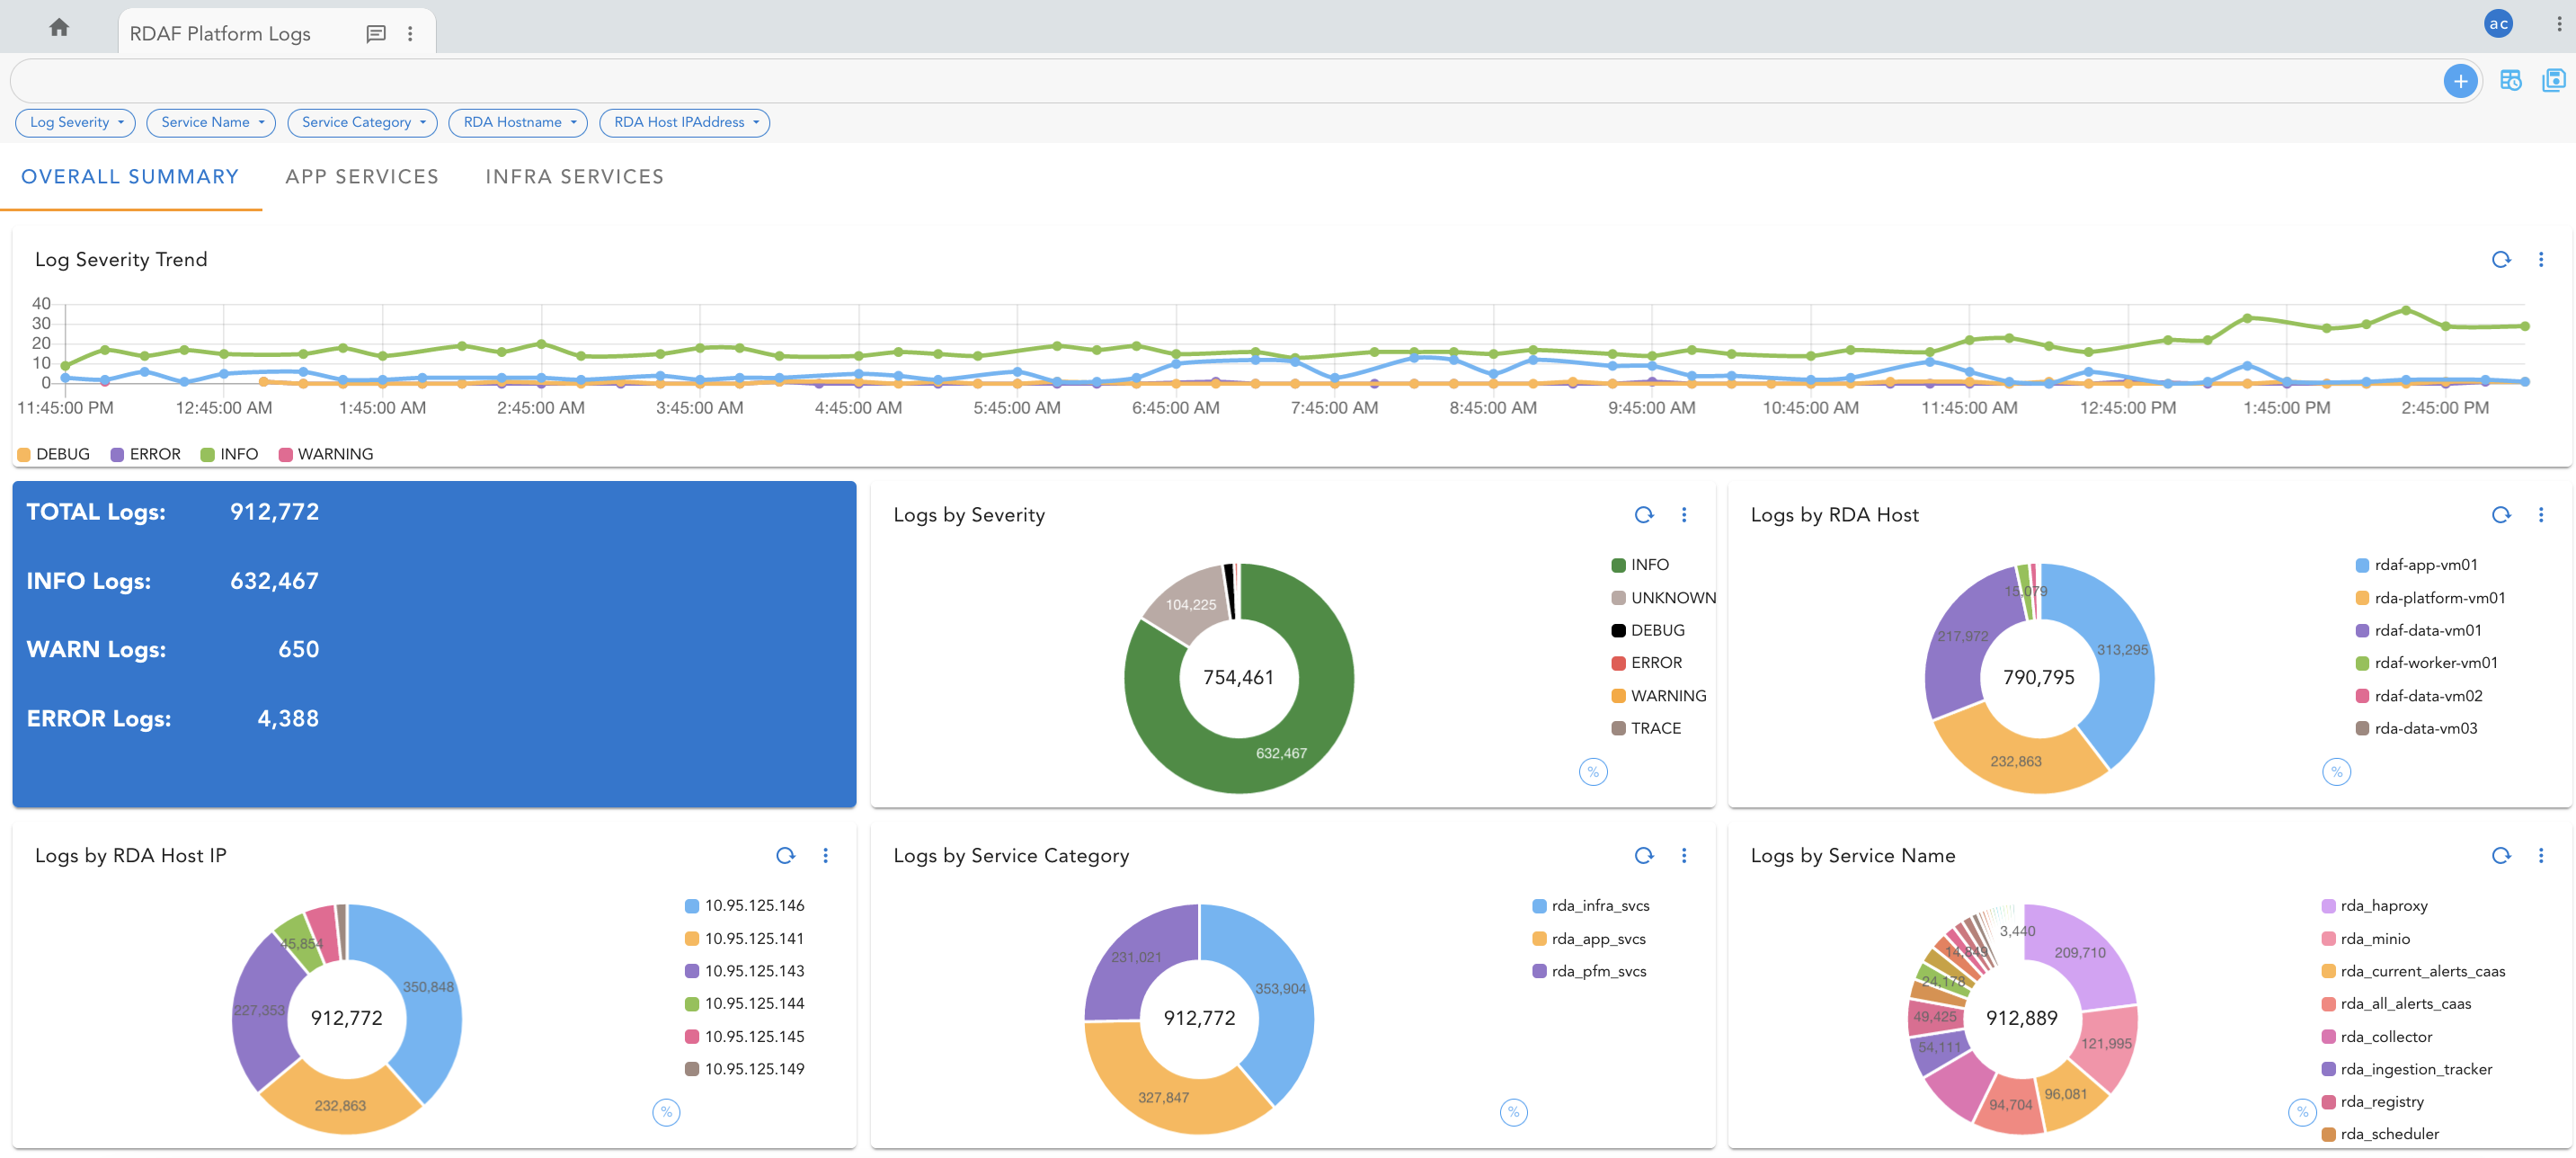
4.5 Add RDAF Log Analytics Dashboard to the portal
Login into RDAF portal as a tenant admin user.
Go to Configuration menu and click on Artifacts
Under Dashboards section, click on View Details
Click on Add YAML button to add a new RDAF Log Analytics dashboard.
Copy and Paste the below content to it and click on Save
{
"name": "rdaf-platform-log-analytics",
"label": "RDAF Platform Logs",
"description": "RDAF Platform service's log analysis dashboard",
"version": "22.9.22.1",
"enabled": true,
"dashboard_style": "tabbed",
"custom_context": {
"rda-dashboard-live-edit": true
},
"status_poller": {
"stream": "rdaf_services_logs",
"frequency": 15,
"columns": [
"@timestamp"
],
"sorting": [
{
"@timestamp": "desc"
}
],
"query": "`@timestamp` is after '${timestamp}'",
"defaults": {
"@timestamp": "$UTCNOW"
},
"action": "refresh"
},
"dashboard_filters": {
"time_filter": true,
"columns_filter": [
{
"id": "@timestamp",
"label": "Timestamp",
"type": "DATETIME"
},
{
"id": "service_name",
"label": "Service Name",
"type": "TEXT"
},
{
"id": "service_category",
"label": "Service Category",
"type": "TEXT"
},
{
"id": "log_severity",
"label": "Log Severity",
"type": "TEXT"
},
{
"id": "log",
"label": "Log Message",
"type": "TEXT"
},
{
"id": "process_name",
"label": "Process Name",
"type": "TEXT"
},
{
"id": "process_function",
"label": "Process Function",
"type": "TEXT"
},
{
"id": "thread_id",
"label": "Thread ID",
"type": "TEXT"
},
{
"id": "service_host",
"label": "Hostname",
"type": "TEXT"
},
{
"id": "host",
"label": "IP Address",
"type": "TEXT"
}
],
"group_filters": [
{
"stream": "rdaf_services_logs",
"title": "Log Severity",
"group_by": [
"log_severity"
],
"ts_column": "@timestamp",
"agg": "value_count",
"column": "_id",
"type": "int"
},
{
"stream": "rdaf_services_logs",
"title": "Service Name",
"group_by": [
"service_name"
],
"ts_column": "@timestamp",
"agg": "value_count",
"column": "_id",
"type": "int"
},
{
"stream": "rdaf_services_logs",
"title": "Service Category",
"group_by": [
"service_category"
],
"ts_column": "@timestamp",
"agg": "value_count",
"column": "_id",
"type": "int"
},
{
"stream": "rdaf_services_logs",
"title": "RDA Host IPAddress",
"group_by": [
"service_host"
],
"ts_column": "@timestamp",
"agg": "value_count",
"column": "_id",
"type": "int"
}
]
},
"dashboard_sections": [
{
"title": "Overall Summary",
"show_filter": true,
"widgets": [
{
"title": "Log Severity Trend",
"widget_type": "timeseries",
"stream": "rdaf_services_logs",
"ts_column": "@timestamp",
"max_width": 12,
"height": 5,
"min_width": 12,
"chartProperties": {
"yAxisLabel": "Count",
"xAxisLabel": null,
"legendLocation": "bottom"
},
"interval": "15Min",
"group_by": [
"log_severity"
],
"series_spec": [
{
"column": "log_severity",
"agg": "value_count",
"type": "int"
}
],
"widget_id": "06413884"
},
{
"widget_type": "pie_chart",
"title": "Logs by Severity",
"stream": "rdaf_services_logs",
"ts_column": "@timestamp",
"column": "_id",
"agg": "value_count",
"group_by": [
"log_severity"
],
"type": "str",
"style": {
"color-map": {
"ERROR": [
"#ef5350",
"#ffffff"
],
"WARNING": [
"#FFA726",
"#ffffff"
],
"INFO": [
"#388e3c",
"#ffffff"
],
"DEBUG": [
"#000000",
"#ffffff"
],
"UNKNOWN": [
"#bcaaa4",
"#ffffff"
]
}
},
"min_width": 3,
"height": 4,
"max_width": 3,
"widget_id": "b2ffa8e9"
},
{
"widget_type": "pie_chart",
"title": "Logs by RDA Host",
"stream": "rdaf_services_logs",
"ts_column": "@timestamp",
"column": "_id",
"agg": "value_count",
"group_by": [
"host_ip"
],
"type": "str",
"min_width": 3,
"height": 4,
"max_width": 3,
"widget_id": "79355cb8"
},
{
"widget_type": "pie_chart",
"title": "Logs by Service Category",
"stream": "rdaf_services_logs",
"ts_column": "@timestamp",
"column": "_id",
"agg": "value_count",
"group_by": [
"service_category"
],
"type": "str",
"min_width": 3,
"height": 4,
"max_width": 3,
"widget_id": "89ac5ce9"
},
{
"widget_type": "pie_chart",
"title": "Logs by Service Name",
"stream": "rdaf_services_logs",
"ts_column": "@timestamp",
"column": "_id",
"agg": "value_count",
"group_by": [
"service_name"
],
"type": "str",
"min_width": 3,
"height": 4,
"max_width": 3,
"widget_id": "4b267fce"
}
]
},
{
"title": "App Services",
"show_filter": true,
"widgets": [
{
"widget_type": "tabular",
"title": "Log Messages",
"stream": "rdaf_services_logs",
"extra_filter": "service_category in ['rda_app_svcs', 'rda_pfm_svcs']",
"ts_column": "@timestamp",
"sorting": [
{
"@timestamp": "desc"
}
],
"columns": {
"@timestamp": {
"title": "Timestamp",
"type": "DATETIME"
},
"state_color2": {
"type": "COLOR-MAP",
"source-column": "log_severity",
"color-map": {
"INFO": "#388e3c",
"ERROR": "#ef5350",
"WARNING": "#ffa726",
"DEBUG": "#000000"
}
},
"log_severity": {
"title": "Severity",
"htmlTemplateForRow": "<span class='badge' style='background-color: {{ row.state_color2 }}' > {{ row.log_severity }} </span>"
},
"service_name": "Service Name",
"process_name": "Process Name",
"process_function": "Process Function",
"log": "Message"
},
"widget_id": "6895c8f0"
}
]
},
{
"title": "Infra Services",
"show_filter": true,
"widgets": [
{
"widget_type": "tabular",
"title": "Log Messages",
"stream": "rdaf_services_logs",
"extra_filter": "service_category in ['rda_infra_svcs']",
"ts_column": "@timestamp",
"sorting": [
{
"@timestamp": "desc"
}
],
"columns": {
"@timestamp": {
"title": "Timestamp",
"type": "DATETIME"
},
"log_severity": {
"title": "Severity",
"htmlTemplateForRow": "<span class='badge' style='background-color: {{ row.state_color2 }}' > {{ row.log_severity }} </span>"
},
"state_color2": {
"type": "COLOR-MAP",
"source-column": "log_severity",
"color-map": {
"INFO": "#388e3c",
"ERROR": "#ef5350",
"WARNING": "#ffa726",
"DEBUG": "#000000",
"UNKNOWN": "#bcaaa4"
}
},
"service_name": "Service Name",
"process_name": "Process Name",
"log": "Message",
"minio_object": "Minio Object"
},
"widget_id": "98f10587"
}
]
}
],
"saved_time": "2025-05-20T14:25:25.688407"
}
Click on the added dashboard rdaf-platform-log-analytics to visualize the logs.
4.6 Un-installing Logstash and Fluentbit
Follow the below steps to un-install both Logstash and Fluentbit services.
Un-installing Logstash service:
-
Login into RDAF host as rdauser (using SSH client) on which Logstash service was installed
-
Stop the Logstash service and remove the container
- Remove the Logstash docker image
- Remove the Logstash service configuration
Danger
Below steps will remove all of the existing Logstash configuration data.
Un-installing Fluentbit service:
-
Login into RDAF host as rdauser (using SSH client) on which Fluentbit service was installed
-
Stop the Fluentbit service and remove the container
- Remove the Fluentbit docker image
- Remove the Fluentbit service configuration
Danger
Below steps will remove all of the existing Fluentbit configuration data.
5. RDAF-Cli Backup and Restore
RDAF Infra/Platform holds data, operational configuration via following components. These components need to be backed up periodically so that in case of any issues or problems, the RDAF Infra/Platform as part of the RDA Fabric can be recreated by restoring a stable snapshot from the backup.
-
Maria DB
-
Minio
-
Opensearch
-
All configs
-
Certs
-
Deployment-yamls
To avoid user mistakes while taking backups, RDAF framework provides backup support via the RDAF CLI on the platform instance. Below are the steps
5.1 Prerequisites
-
Destination directory for backup should be a shared directory among cli, and all infra vms.
-
For Non k8s setups, Opensearch data backup directory should be a shared directory among cli, and all infra vms. This directory is referenced in the
/opt/rdaf/deployment-scripts/values.yaml file. By default, the value mentioned for Opensearch data backup in the above file is/opt/opensearch-backup. This backup location can be changed to the required shared directory, in case if infra services are already deployed before this change. -
For Non k8s setups users can use 'rdaf infra upgrade --tag
--service opensearch' to upgrade the directory-path. By default, users can input the required shared directory path in values.yamland then, deploy infra components install. -
For k8s setups, Opensearch backup PV uses the path
/opt/backup/opensearch. This path should be mounted in all Opensearch vms. -
To add mount points on CLI and infrastructure VMs, follow the steps below:
Where are the backup files stored?
Backup files are saved in nfs mounted volume that is shared between the cli vm and all the vms having infra containers.
Note
This nfs mounted volume should have rdauser user permissions.
- NFS Client Mount Procedure
Execute on all infrastructure VMs, including all MinIO VMs in HA setups (4 total), and the CLI VM.
Install the NFS client packages using the appropriate package manager.
Use this command for Ubuntu based systems
Create the /<create backup directory> directory for backup storage using below given command
Please use this command to connect the NFS server
sudo mount -t nfs <nfs-server-ip>:/opt/<path of the folder which user created in nfs-server>/ /<path of the folder where users are going to take backup>
Create an empty file with a name within the /cfx-backup directory to check if the file is getting created or not
Modify sudo vi /etc/fstab with the provided entry, customizing mount points to users requirements."
<nfs-server-ip>:/opt/<path of the folder which we created in nfs-server>/ /<path of the folder where we are going to take backup > nfs defaults 0 0
This below given command provides information to determine whether the mount point is correctly mounted or not
5.2 Backup Command Details
-
--dest-dirshould be nfs mounted volume to store backup. -
--serviceis optional. If not used, it takes backup of all operational config files, certs, mariadb, minio, opensearch data. This option can contain any infra service. For mariadb/minio/opensearch, it collects the databases/buckets/indices data along with their configs. Users can give all the infra component names or ‘config’ keyword under --service option -
--create-taroption creates tar file of the backed-up content in the destination directory (along with regular backed-up content inside destination directory as shown below).
[rdauser@svc1-133-94 ~]$ ls /cfx-backup/2022-11-13-1668409114.741395
cert  config  data  deployment-scripts  rdaf-backup-2022-11-13-1668409114.741395.tar.gz  rdaf-backup.cfg  rdaf.cfg
[rdauser@svc1-133-94 ~]$
Note
RDAF backup CLI will not take backup of service logs
5.3 Backed Up Data Structure
Inside the selected backup directory, another folder is created with date, for example:- 2021-07-17-1626586567.934014 for each backup triggered. Following captures sample folder structure of this directory:
[rdauser@svc1-133-94 2022-11-08-1667898481.39201]$ ls
cert config data deployment-scripts rdaf-backup.cfg rdaf.cfg
-
For full backup or for backing up mariadb/minio/nats, the mariadb/minio/nats data gets stored under the ‘data’ folder. For other components, data folder will be an empty folder.
-
Config section has the backup from
/opt/rdaf/config directory, from all the vms of the setup. -
Cert has certs from
/opt/rdaf/cert dir -
Deployment-scripts has backup from
/opt/rdaf/deployment-scripts directory, from all the vms of the setup. -
rdaf-backup.cfgContains the cli version,components, opensearch snapshot-id, useful during restore. -
For Opensearch data in non k8s setups, the backup will be stored in the directory that was mentioned in the
/opt/rdaf/deployment-scripts/values.yamlfile for Opensearch. This should be a shared directory among cli, and all Opensearch vms. -
For k8s setups, data will be stored in
/opt/backup/opensearch(This path should be mounted across all opensearch vms).
5.4 Periodic Collection of Backup
To collect backups in regular intervals, we need to add/place the backup command in crontab. Sample line that needs to be placed in crontab is captured below:-
Dest-Dir is the nfs mounted volume dedicated for storing backups.
Required-log-file is the log file along with the path, where users want the backup log to be written to.
5.5 Rdaf restore
RDAF cli supports restoring data for the below components from the backups collected by the rdaf backup command.
-
Mariadb
-
Minio
-
Opensearch
-
Operational configuration (and other necessary files)
-
Any other infra component (All required configuration files will be copied here. Except mariadb, minio, opensearch, nats, there is separate data section for other infra components)
CLI to restore Mysql, Minio, Opensearch, Operational configuration is as given below.
Tip
We can use --from-tar instead of --from-dir, if we have used --create-tar while taking backup. To restore use the tar.gz file
Note
We don't restore any service logs
5.6 Full Restore
--service option is optional, if not used, it will restore all the Operational configs, mariadb data, minio buckets, Opensearch indices, nats data.
5.7 CloudFabrix Certified Restore Procedures
RDAF Restore – Platform/Service VMs are in-tact, All Services are also healthy. The purpose is just to roll back to an earlier snapshot
or
Upgrade is done to the app/platform, and if the upgrade fails, and if we want to revert to the previous snapshot taken before starting upgrade.
Below are the steps to achieve the above.
- Take a full backup.
Note
This is to make sure we have a latest snapshot
- Verify RDAF OIA (AIOps) application services status by running the Below Command
+-------------------------------+--------------+-------------------+--------------+--------+
| Name                          | Host         | Status            | Container Id | Tag    |
+-------------------------------+--------------+-------------------+--------------+--------+
| rda-alert-ingester            | 111.92.12.42 | Up 2 Weeks ago    | 447c7dab089d | 8.2.1  |
|                               |              |                   |              |        |
| rda-alert-ingester            | 111.92.12.42 | Up 2 Weeks ago    | 750a0d229eb8 | 8.2.1  |
|                               |              |                   |              |        |
| rda-alert-processor           | 111.92.12.42 | Up 15 Minutes ago | 6bf8bad1cf25 | 8.2.1  |
|                               |              |                   |              |        |
| rda-alert-processor           | 111.92.12.42 | Up 1 Minutes ago  | c953c4c94fd8 | 8.2.1  |
|                               |              |                   |              |        |
| rda-alert-processor-companion | 111.92.12.42 | Up 2 Weeks ago    | ccc85377da0d | 8.2.1  |
|                               |              |                   |              |        |
| rda-alert-processor-companion | 111.92.12.42 | Up 1 Days ago     | bd1b23a15fb2 | 8.2.1  |
|                               |              |                   |              |        |
| rda-app-controller            | 111.92.12.42 | Up 2 Weeks ago    | 363536fa5086 | 8.2.1  |
|                               |              |                   |              |        |
| rda-app-controller            | 111.92.12.42 | Up 2 Weeks ago    | f18ea5bee53e | 8.2.1  |
+-------------------------------+--------------+-------------------+--------------+--------+
- Down RDAF Application services (OIA) and verify that all services are down
- Verify RDAF Worker services status by running the Below Command
+------------+--------------+----------------+--------------+-------+
| Name       | Host         | Status         | Container Id | Tag   |
+------------+--------------+----------------+--------------+-------+
| rda-worker | 111.92.12.43 | Up 1 Weeks ago | c3bcc73eefa4 | 8.2.1 |
|            |              |                |              |       |
| rda-worker | 111.92.12.43 | Up 6 Days ago  | 31a649221da4 | 8.2.1 |
|            |              |                |              |       |
+------------+--------------+----------------+--------------+-------+
- Down RDAF Worker services and verify that Worker services are down
- Down log monitoring services and verify that log monitoring services are down
- Verify RDAF Platform services status by running the Below Command
+----------------------+--------------+----------------+--------------+--------+
| Name                 | Host         | Status         | Container Id | Tag    |
+----------------------+--------------+----------------+--------------+--------+
| rda-api-server       | 111.92.12.41 | Up 2 Weeks ago | fd2f23dd546c | 8.2.1  |
| rda-api-server       | 111.92.12.41 | Up 2 Weeks ago | 3a8ef8f95c6b | 8.2.1  |
| rda-registry         | 111.92.12.41 | Up 2 Weeks ago | bf034c853eb4 | 8.2.1  |
| rda-registry         | 111.92.12.41 | Up 2 Weeks ago | b66fc19c90bb | 8.2.1  |
| rda-identity         | 111.92.12.41 | Up 2 Weeks ago | d6909f3295b3 | 8.2.1  |
| rda-identity         | 111.92.12.41 | Up 2 Weeks ago | bc3813d4350a | 8.2.1  |
| rda-fsm              | 111.92.12.41 | Up 2 Weeks ago | 14af867823c7 | 8.2.1  |
| rda-fsm              | 111.92.12.41 | Up 2 Weeks ago | 5fe613b3025b | 8.2.1  |
| rda-chat-helper      | 111.92.12.41 | Up 2 Weeks ago | e4ac9b2ee0ca | 8.2.1  |
+----------------------+--------------+----------------+--------------+--------+
- Down RDAF platform services and verify that Worker services are down
- To down the mariadb
Down all services except minio, opensearch services
- Now Execute the Restore Steps
Note
Mariadb pods should be down, Minio , Nats and Opensearch pods should be running while running restore.
rdafk8s restore --debug --from-dir <nfs-mounted-volume/required-backup-folder> --no-prompt >>restore.log (for redirecting logs to a file)
Note
1.In the above command the required-backup folder is different from the backup folder which we created as part of backup creation earlier. It should be the directory, to which we want the data to be restored to.
2.We have to use --from-tar instead of --from-dir if we have backup as tar.gz file.
3.Make sure no errors are ignored during the restore operation.
- For starting mariadb , follow the below steps
Now start the infra
Please check if all infra pods are up using
Please check if all infra containers are up and no containers are restarting using
+-------------------+--------------+-----------------+--------------+------------------------------+
| Name              | Host         | Status          | Container Id | Tag                          |
+-------------------+--------------+-----------------+--------------+------------------------------+
| haproxy           | 192.168.131.41 | Up 3 months     | fd008d37d1e0 | 1.0.4                      |
|                   |              |                 |              |                              |
| haproxy           | 192.168.131.42 | Up 3 months     | 098f770bec0e | 1.0.4                      |
|                   |              |                 |              |                              |
| keepalived        | 192.168.131.41 | active          | N/A          | N/A                        |
|                   |              |                 |              |                              |
| keepalived        | 192.168.131.42 | active          | N/A          | N/A                        |
|                   |              |                 |              |                              |
| rda-nats          | 192.168.131.41 | Up 25 Weeks ago | ace867e71b4c | 1.0.4                      |
|                   |              |                 |              |                              |
| rda-nats          | 192.168.131.42 | Up 11 Weeks ago | 914c738aaa5b | 1.0.4                      |
+-------------------+--------------+-----------------+--------------+------------------------------+
Now, start the platform again.
Run the following Commands and all are healthy/without any errors.
Now, start the worker
Run the following Commands
Start the log_monitoring services
Verify that log_monitoring services are up using the below Commands
Now start the app
Check using these Commands+-------+----------------------------------------+-------------+----------------+----------+-------------+-------------------+--------+--------------+---------------+--------------+
| Cat | Pod-Type | Pod-Ready | Host | ID | Site | Age | CPUs | Memory(GB) | Active Jobs | Total Jobs |
|-------+----------------------------------------+-------------+----------------+----------+-------------+-------------------+--------+--------------+---------------+--------------|
| App | alert-ingester | True | rda-alert-inge | c089c592 | | 17 days, 20:14:00 | 8 | 31.33 | | |
| App | alert-ingester | True | rda-alert-inge | 1d3782ca | | 17 days, 20:13:52 | 8 | 31.33 | | |
| App | alert-processor | True | rda-alert-proc | 6f194a11 | | 0:12:31 | 8 | 31.33 | | |
| App | alert-processor | True | rda-alert-proc | 8bf388b9 | | 0:08:49 | 8 | 31.33 | | |
| App | alert-processor-companion | True | rda-alert-proc | af40d4d9 | | 19 days, 6:09:53 | 8 | 31.33 | | |
| App | alert-processor-companion | True | rda-alert-proc | e4ebf974 | | 2 days, 3:23:07 | 8 | 31.33 | | |
| App | asset-dependency | True | rda-asset-depe | 50d810be | | 19 days, 6:30:21 | 8 | 31.33 | | |
| App | asset-dependency | True | rda-asset-depe | 326c4f86 | | 19 days, 6:30:21 | 8 | 31.33 | | |
| App | authenticator | True | rda-identity-7 | 9d251ca9 | | 19 days, 6:30:18 | 8 | 31.33 | | |
| App | authenticator | True | rda-identity-7 | 6cff78a4 | | 19 days, 6:30:21 | 8 | 31.33 | | |
+-------+----------------------------------------+-------------+----------------+----------+-------------+-------------------+--------+--------------+---------------+--------------+
+-----------+----------------------------------------+--------------+----------+-------------+-----------------------------------------------------+----------+-----------------------------------------------------------------------------------------------------------------------------------------------------------------------------------------------------------------------------------------------------------------------------------------+
| Cat       | Pod-Type                               | Host         | ID       | Site        | Health Parameter                                    | Status   | Message                                                                                                                                                                                                                                                                                 |
|-----------+----------------------------------------+--------------+----------+-------------+-----------------------------------------------------+----------+-----------------------------------------------------------------------------------------------------------------------------------------------------------------------------------------------------------------------------------------------------------------------------------------|
| rda_app   | alert-ingester                         | rda-alert-in | 1d3782ca |             | service-status                                      | ok       |                                                                                                                                                                                                                                                                                         |
| rda_app   | alert-ingester                         | rda-alert-in | 1d3782ca |             | minio-connectivity                                  | ok       |                                                                                                                                                                                                                                                                                         |
| rda_app   | alert-ingester                         | rda-alert-in | 1d3782ca |             | service-dependency:configuration-service            | ok       | 2 pod(s) found for configuration-service                                                                                                                                                                                                                                                |
| rda_app   | alert-ingester                         | rda-alert-in | 1d3782ca |             | service-initialization-status                       | ok       |                                                                                                                                                                                                                                                                                         |
| rda_app   | alert-ingester                         | rda-alert-in | 1d3782ca |             | kafka-connectivity                                  | ok       | Cluster=nzyeX9qkR-ChWXC0fRvSyQ, Broker=0, Brokers=[0, 2, 1]                                                                                                                                                                                                                             |
| rda_app   | alert-ingester                         | rda-alert-in | c089c592 |             | service-status                                      | ok       |                                                                                                                                                                                                                                                                                         |
| rda_app   | alert-ingester                         | rda-alert-in | c089c592 |             | minio-connectivity                                  | ok       |                                                                                                                                                                                                                                                                                         |
| rda_app   | alert-ingester                         | rda-alert-in | c089c592 |             | service-dependency:configuration-service            | ok       | 2 pod(s) found for configuration-service                                                                                                                                                                                                                                                |
| rda_app   | alert-ingester                         | rda-alert-in | c089c592 |             | service-initialization-status                       | ok       |                                                                                                                                                                                                                                                                                         |
| rda_app   | alert-ingester                         | rda-alert-in | c089c592 |             | kafka-connectivity                                  | ok       | Cluster=nzyeX9qkR-ChWXC0fRvSyQ, Broker=0, Brokers=[0, 2, 1]                                                                                                                                                                                                                             |
+-----------+----------------------------------------+--------------+----------+-------------+-----------------------------------------------------+----------+-----------------------------------------------------------------------------------------------------------------------------------------------------------------------------------------------------------------------------------------------------------------------------------------+
RDAF Restore – Platform/Service VMs are in-tact, All Services are also healthy. The purpose is just to roll back to an earlier snapshot
or
Upgrade is done to the app/platform, and if the upgrade fails, and if we want to revert to the previous snapshot taken before starting upgrade.
Below are the steps to achieve the above.
- Take a full backup.
Note
This is to make sure we have a latest snapshot
- Verify RDAF OIA (AIOps) application services status by running the Below Command
+-----------------------------------+----------------+------------+--------------+--------+
| Name                              | Host           | Status     | Container Id | Tag    |
+-----------------------------------+----------------+------------+--------------+--------+
| cfx-rda-app-controller            | 192.168.107.67 | Up 3 hours | 399c4de2e5f9 | 8.2.1  |
| cfx-rda-app-controller            | 192.168.107.66 | Up 3 hours | f8928bea6837 | 8.2.1  |
| cfx-rda-reports-registry          | 192.168.107.67 | Up 3 hours | c4d6ab852b9e | 8.2.1  |
| cfx-rda-reports-registry          | 192.168.107.66 | Up 3 hours | 5816845142b2 | 8.2.1  |
| cfx-rda-notification-service      | 192.168.107.67 | Up 3 hours | 202e4282eca4 | 8.2.1  |
| cfx-rda-notification-service      | 192.168.107.66 | Up 3 hours | efbb103f54ec | 8.2.1  |
| cfx-rda-file-browser              | 192.168.107.67 | Up 3 hours | cdb24f11a38b | 8.2.1  |
| cfx-rda-file-browser              | 192.168.107.66 | Up 3 hours | db8ccb256595 | 8.2.1  |
| cfx-rda-configuration-service     | 192.168.107.67 | Up 3 hours | ddc7075e0da8 | 8.2.1  |
| cfx-rda-configuration-service     | 192.168.107.66 | Up 3 hours | 946b7e1c098f | 8.2.1  |
| cfx-rda-alert-ingester            | 192.168.107.67 | Up 3 hours | 3901e1cee9dd | 8.2.1  |
+-----------------------------------+----------------+------------+--------------+--------+
- Bring down RDAF Application services (OIA) and verify that all services are down
- Verify RDAF Worker services status by running the Below Command
+------------+----------------+-------------+--------------+-----------+
| Name       | Host           | Status      | Container Id | Tag       |
+------------+----------------+-------------+--------------+-----------+
| rda_worker | 192.168.131.46 | Up 3 hours  | 6e6c190df92f | 8.2.1     |
|            |                |             |              |           |
| rda_worker | 192.168.131.47 | Up 3 hours  | 0f8350735ee8 | 8.2.1     |
|            |                |             |              |           |
| rda_worker | 192.168.131.46 | Up 31 hours | 16db3960ab64 | 8.2.1     |
|            |                |             |              |           |
+------------+----------------+-------------+--------------+-----------+
- Bring down RDAF Worker services and verify that Worker services are down
- Verify RDAF Platform services status by running the Below Command
+--------------------------+----------------+------------------+--------------+--------+
| Name                     | Host           | Status           | Container Id | Tag    |
+--------------------------+----------------+------------------+--------------+--------+
| rda_api_server           | 192.168.107.61 | Up About an hour | 5b924dddc5cf | 8.2.1  |
| rda_api_server           | 192.168.107.62 | Up About an hour | 2919b3d6d505 | 8.2.1  |
| rda_registry             | 192.168.107.61 | Up About an hour | 1571eb62ab3e | 8.2.1  |
| rda_registry             | 192.168.107.62 | Up About an hour | 0b64dafc8d28 | 8.2.1  |
| rda_scheduler            | 192.168.107.61 | Up About an hour | 4d0786562537 | 8.2.1  |
| rda_scheduler            | 192.168.107.62 | Up About an hour | ddad47f50fb2 | 8.2.1  |
| rda_collector            | 192.168.107.61 | Up About an hour | 3e71a7308ab3 | 8.2.1  |
| rda_collector            | 192.168.107.62 | Up About an hour | c16a93539535 | 8.2.1  |
+--------------------------+----------------+------------------+--------------+--------+
- Bring down RDAF platform services and verify that Worker services are down
- Verify RDAF Infra services status by running the Below Command
+----------------------+----------------+------------------+--------------+------------------------------+
| Name                 | Host           | Status           | Container Id | Tag                          |
+----------------------+----------------+------------------+--------------+------------------------------+
| haproxy              | 192.168.107.63 | Up About an hour | cf89a08204ac | 1.0.4                        |
|                      |                |                  |              |                              |
| haproxy              | 192.168.107.64 | Up About an hour | d920531f9b0f | 1.0.4                        |
|                      |                |                  |              |                              |
| keepalived           | 192.168.107.63 | active           | N/A          | N/A                          |
|                      |                |                  |              |                              |
| keepalived           | 192.168.107.64 | active           | N/A          | N/A                          |
|                      |                |                  |              |                              |
| nats                 | 192.168.107.63 | Up About an hour | 0e2c38762d71 | 1.0.4                        |
|                      |                |                  |              |                              |
| nats                 | 192.168.107.63 | Up About an hour | 8d21ff09ce3b | 1.0.4                        |
|                      |                |                  |              |                              |
| minio                | 192.168.107.64 | Up About an hour | f3b29b36ec85 | RELEASE.2024-12-18T13-15-44Z |
|                      |                |                  |              |                              |
| minio                | 192.168.107.63 | Up About an hour | f0448e7b7f66 | RELEASE.2024-12-18T13-15-44Z |
|                      |                |                  |              |                              |
| minio                | 192.168.107.64 | Up About an hour | 9ec7ea77e539 | RELEASE.2024-12-18T13-15-44Z |
|                      |                |                  |              |                              |
| minio                | 192.168.107.63 | Up About an hour | 8aee1d166684 | RELEASE.2024-12-18T13-15-44Z |
+----------------------+----------------+------------------+--------------+------------------------------+
Bring down all services except minio, opensearch services
- Now Execute the Restore Steps
Note
Mariadb containers should be exited, Minio and Opensearch containers should be running while running restore.
Note
-
In the above command the required-backup folder is different from the backup folder which we created as part of backup creation earlier. It should be the directory, to which we want the data to be restored to.
-
Make sure no errors are ignored during the restore operation.
Now start the infra components
Please check if all infra containers are up and no containers are in restarting status using below command
and+----------------+-----------------+--------+----------------------+----------------+--------------+
| Name | Check | Status | Reason | Host | Container Id |
+----------------+-----------------+--------+----------------------+----------------+--------------+
| haproxy | Port Connection | OK | N/A | 192.168.107.63 | fdb5a96537b8 |
| haproxy | Service Status | OK | N/A | 192.168.107.63 | fdb5a96537b8 |
| haproxy | Firewall Port | OK | N/A | 192.168.107.64 | fdb5a96537b8 |
| haproxy | Port Connection | OK | N/A | 192.168.107.63 | f370fcb66b13 |
| haproxy | Service Status | OK | N/A | 192.168.107.63 | f370fcb66b13 |
| haproxy | Firewall Port | OK | N/A | 192.168.107.63 | f370fcb66b13 |
| keepalived | Service Status | OK | N/A | 192.168.107.63 | N/A |
| keepalived | Service Status | OK | N/A | 192.168.107.64 | N/A |
| nats | Port Connection | OK | N/A | 192.168.107.63 | 129efa5b015c |
| nats | Service Status | OK | N/A | 192.168.107.63 | 129efa5b015c |
| nats | Firewall Port | OK | N/A | 192.168.107.64 | 129efa5b015c |
| nats | Port Connection | OK | N/A | 192.168.107.63 | fe5f190108b0 |
| nats | Service Status | OK | N/A | 192.168.107.63 | fe5f190108b0 |
| nats | Firewall Port | OK | N/A | 192.168.107.63 | fe5f190108b0 |
| minio | Port Connection | OK | N/A | 192.168.107.64 | 19ccfdeab789 |
+----------------+-----------------+--------+----------------------+----------------+--------------+
Now, start the platform services
Run below Commands
Now, start the worker
Now, start the app services
6. CFX Self Monitor Service
6.1 What is CFX Self Monitor
CFX Self Monitor is an application service to monitor RDAF deployments to automatically ensure that the setups are healthy and functioning properly. It can be used to monitor RDAF deployments e.g.,
-
Production deployments
-
Demo deployments
-
Longevity testing
-
Basic sanity checks for new deployments
-
Pre / Post upgrade verification of existing deployments
6.2 Examples of Health and Functionality Checks
Below are some of the health checks it performs, but not limited to:
-
Ensure all the RDA Fabric pods are up and running and have not restarted
-
Ensure there are some alerts received and incidents created in last 24 hours
-
Ensure users are able to login
-
Ensure basic UI functionality is working
-
Others...
6.3 What CFX Self Monitor service is "NOT"
The purpose of CFX Self Service is not to:
-
Replace general infrastructure monitoring applications like prometheus, zabbix etc.
-
Monitor kubernetes deployment & pods
-
Develop tests / system tests
The idea is to check the health and basic functionality of RDAF overall. It is not a complete end-to-end testing framework to test every feature.
6.4 Features
-
Sanity test cases are written using yaml
-
Automatically perform checks and send notifications with the results. Currently, notifications are supported via Slack and Webex Teams, with email support available as well.
-
Customize deployment specific parameters (API username / password etc.)
-
Ability to customize the test suites that come out of the box (e.g Expected RDA pods that need to be present)
-
Enable / Disable test suites
-
Add new deployment specific test suites in yaml without having to change source code or commit them to source code management systems
-
Current framework supports writing test cases for the output of rdac commands and API responses
6.5 Getting Started
CFX Self Monitor service is deployed as a docker container. Please follow the below steps configuring and bringing it up.
1. Create a new user (e.g., monitoring@cfx.com) with MSP Read Only User role in RDAF portal UI.
Tip
Please refer RDAF Platform Administration for more information on creating a new user and assigning MSP Read Only User role
2: Login into RDAF UI portal with new user account to update the default password changeme
Important
From version 8.2.1 onwards, the system generates a random password for every newly created user instead of using the default password changeme.
Note
Please skip the below step, if config.json file already exists in the below mentioned path with appropriate RDAF network configuration.
- Run the following command to initiate the RDAF self-monitoring setup
- Once the setup begins, user will be prompted to enter configuration details for the self-monitoring service, such as host IP, deployment name, portal credentials, and alert integration preferences (e.g., Slack).
What is the host on which you want the self_monitoring to be installed?
Self Monitoring host(s)[192.168.108.51]: 192.168.108.56,192.168.108.58
What is the deployment name for the self monitoring tool
Self Monitoring deployment name[]: CFX
What is the portal username for the self monitoring tool
Self Monitoring portal username[admin@cfx.com]: monitoring@cfx.com
What is the portal password for the self monitoring tool
Self Monitoring portal password[]: monitoring
Do you want self_monitoring tool to send messages to Slack? [yes/No]: yes
Please specify slack token
Slack token[]: xxxxx-xxxxxxxxx-xxxxxxxxxx-xxxxxxxxxxxxxxxxxxxxxxx
Please specify the name slack channel
Slack channel name[]: xxxxxxxxxx
Please specify the id of the slack channel
Slack channel id[]: xxxxxxxxx
Please specify name of the slack members
Slack member names[]: xxxxxx
Please specify id of the slack members
Slack member ids[]: xxxxxxxxx
Do you want self_monitoring tool to send messages to Webex? [yes/No]: yes
Please specify webex token
Webex token[]: xxxxxxxxxxxxxxxxxxxxxxxx
Please specify webex room_id
Webex room_id?[]: xxxxxx
Do you want self_monitoring tool to send messages to Email? [yes/No]: yes
Please specify SMTP Server
SMTP Server[smtp.gmail.com]:smtp.gmail.com
Please specify SMTP port
SMTP Port[587]:587
Please specify Sender Email
Sender Email[]: xxxxxxxxxxx@cloudfabrix.com
Please specify sender password
Sender password?[]:
Re-enter Sender password?[]:
Please specify Recipient Email
Recipient Email[]: xxxxxxxxxxxx@cloudfabrix.com
WARNING! Using --password via the CLI is insecure. Use --password-stdin.
WARNING! Your password will be stored unencrypted in /home/rdauser/.docker/config.json.
Configure a credential helper to remove this warning. See
https://docs.docker.com/engine/reference/commandline/login/#credential-stores

Login Succeeded
2025-07-11 11:24:33,381 [rdaf.component.self_monitoring] INFO     - Generating settings for self-monitor...
2025-07-11 11:24:34,318 [rdaf.component.self_monitoring] INFO     - Created /opt/rdaf/config/cfx_self_monitor/resources/settings.json on 192.168.108.56
2025-07-11 11:24:34,543 [rdaf.component.self_monitoring] INFO     - Created /tmp/portal_pwd on 192.168.108.56
2025-07-11 11:24:34,725 [rdaf.component.self_monitoring] INFO     - Setup completed successfully
- Run the following command to install the RDAF Self Monitoring component
rdauser@aiaperf-sv10851:~$ rdaf self_monitoring install --tag 8.2.1
2025-07-11 11:26:33,341 [rdaf.component.self_monitoring] INFO     - Installing self_monitoring on host 192.168.108.56
[+] Running 29/2952,074 [rdaf.component] INFO     -
 ⠿ cfx_self_monitor Pulled                                                11.6s
   ⠿ 898c46f3b1a1 Already exists                                           0.0s
   ⠿ 63366dfa0a50 Already exists                                           0.0s
   ⠿ 041d4cd74a92 Already exists                                           0.0s
   ⠿ 6e1bee0f8701 Already exists                                           0.0s
   ⠿ 7d47e9253561 Already exists                                           0.0s
   ⠿ a18f29e2e09e Already exists                                           0.0s
   ⠿ 8111474d7ab8 Already exists                                           0.0s
   ⠿ fd290ed133ee Already exists                                           0.0s
   ⠿ e5f9fe660e16 Already exists                                           0.0s
   ⠿ f22913b86f73 Already exists                                           0.0s
   ⠿ f1acc4f4fd34 Already exists                                           0.0s
   ⠿ 0a9322a82247 Already exists                                           0.0s
   ⠿ 3bcd77b78b62 Pull complete                                            0.4s
   ⠿ 5ebe1b803e09 Pull complete                                            1.9s
   ⠿ 521070f75b8d Pull complete                                            2.7s
   ⠿ 6a052958d5a2 Pull complete                                            3.4s
   ⠿ 1e8e31752218 Pull complete                                            4.6s
   ⠿ 4f26d29161fa Pull complete                                            9.6s
   ⠿ b8144e4837a9 Pull complete                                            9.9s
   ⠿ 3024f87e4e8d Pull complete                                           10.0s
   ⠿ b854a91f8d15 Pull complete                                           10.2s
   ⠿ 18803e5cd585 Pull complete                                           10.3s
   ⠿ 3e9cc594319c Pull complete                                           10.4s
   ⠿ 164243e28c35 Pull complete                                           10.5s
   ⠿ 92b1a44c6d11 Pull complete                                           10.6s
   ⠿ 93d3f62fcd1c Pull complete                                           10.8s
   ⠿ 288cc3cab9f5 Pull complete                                           10.9s
   ⠿ 9cb3e5005cd3 Pull complete                                           11.0s
[+] Running 2/2
 ⠿ Network self_monitoring_default               Created                   0.3s
 ⠿ Container self_monitoring-cfx_self_monitor-1  Started                   5.0s
- Use the command below to check the current status of the Self Monitoring setup
+------------------+-----------------+---------------+--------------+-------+
| Name             | Host            | Status        | Container Id | Tag   |
+------------------+-----------------+---------------+--------------+-------+
| cfx_self_monitor | 192.168.108.56  | Up 14 seconds | 3fd98e2abb9e | 8.2.1 |
+------------------+-----------------+---------------+--------------+-------+
6.6 Customization
There are several customizations provided in CFX Self Monitor service.
6.6.1 Customizing Deployment Specific Parameters
Note
Below are the links to fetch the slack channel id and user id
-
channel_id: ID of the Slack channel https://help.socialintents.com/article/148-how-to-find-your-slack-team-id-and-slack-channel-id
-
team: Information about the support team for this deployment.
-
critical: List of user IDs to be @mentioned for each severity (e.g.,
Critical, Warning, Info etc.). https://www.workast.com/help/article/how-to-find-a-slack-user-id/
6.6.2 Integrations For Messaging
6.6.2.1 Webex
-
Create a webex bot:https://developer.webex.com/my-apps/new/bot
-
Once the user creates the bot, it displays a token ID. Copy that token ID. This is the token you enter in settings.json-> webex-> token
-
Go to webex spaces application, and create a space. Add the above bot as a member of the space.
-
Get the list of rooms by executing the API from this URL:https://developer.webex.com/docs/api/v1/rooms/list-rooms
-
Find out the space the user created above and copy the roomId. This is the roomId user should enter in settings.json-> webex-> roomId
6.6.2.2 Slack
Please refer Configure Slack to receive notifications over a Webhook
6.6.3 Enable/Disable Test Suites
By default, all the test suites bundled are executed. In order to disable a particular test suite, add the following in the settings.json
6.6.4 Customize Test Parameters
Each test suite has certain parameters that can be customized. User can see these parameters by opening the test suite yaml file.
The user can see below an example of customising a test parameter, This example changes the name mandatory applications to be returned with getMenu api call
{
    ...
    "suites": {
        "test_get_menu": { "variables": {"mandatory_apps": ["Administration", "User Dashboards"]}}
    }
}
6.6.5 Create New Test Suites (Advanced Usage)
If a user wants to add new test suites in addition to the ones bundled with the application, the user can create the test suite as an yaml file and place it under (/opt/rdaf_self_monitor/tests/api or /cfx_self_monitor/tests/rdac). This directory corresponds to /opt/rdaf_self_monitor/tests on the host machine in the given docker-compose yaml file
In order to write test cases, the user must possess the following expertise.
1. jsonpath
a) https://pypi.org/project/jsonpath-ng/
b) https://blogboard.io/blog/knowledge/jsonpath-python/
2. jinja templating
a) https://jinja.palletsprojects.com/en/3.1.x/
b) http://jinja.quantprogramming.com/
7. Monitor RDAF Platform using Telegraf Agent
What is Telegraf Agent
Telegraf is an open-source agent for collecting metrics and data on the system it's running on or from other services. Below are some of the key capabilities of Telegraf agent.
Data Collection: Telegraf collects metrics from configured sources. It can gather CPU, memory, disk, and I/O metrics, as well as data from a host of services and APIs.
Intermediate Processing: Telegraf has the ability to process and transform the data it collects. This can include aggregating metrics, converting values, or filtering out unnecessary data points before they are sent to the database.
Data Output: Telegraf can send the collected data to various destinations, utilizing its output plugins. This includes time series databases like InfluxDB, other databases like MongoDB, or services like Kafka, AWS CloudWatch, among others.
Lightweight & Efficient: It uses minimal system memory and CPU resources.
Flexibility: It can operate in different modes, acting either as an agent on a host gathering various system and application metrics or in a more decentralized way to collect metrics from remote sources over the network.
7.1 Installation
The Telegraf agent needs to be installed on all the virtual machines in the RDA Fabric platform to collect metrics from configured resources such as CPU, memory, disk, and network of both the host OS and containers.
Log into each RDA Fabric platform virtual machine as rdauser using an SSH client such as PuTTY
Run the commands below to create the directory structure for the Telegraf agent and assign appropriate user permissions.
sudo mkdir -p /opt/rdaf_telegraf/conf.d
sudo mkdir -p /opt/rdaf_telegraf/templates
sudo mkdir -p /opt/rdaf_telegraf/certs
sudo mkdir -p /opt/rdaf_telegraf/logs
sudo chown -R rdauser:rdauser /opt/rdaf_telegraf
Create docker compose configuration file for Telegraf agent as shown below.
cd /opt/rdaf_telegraf

cat > telegraf-docker-compose.yml <<EOF
version: '3.6'
services:
  telegraf:
    image: cfxregistry.cloudfabrix.io/rda-platform-telegraf:1.0.4
    container_name: rda-telegraf
    restart: always
    network_mode: host
    mem_limit: 6G
    memswap_limit: 6G
    shm_size: 1gb
    ulimits:
      memlock: 514688
    logging:
      driver: "json-file"
      options:
        max-size: "25m"
        max-file: "5"
    environment:
    - HOST_PROC=/host/proc
    - HOST_SYS=/host/sys
    - HOST_MOUNT_PREFIX=/host/rootfs
    - HOST_ETC=/host/etc
    volumes:
      - /opt/rdaf_telegraf:/etc/telegraf/
      - /opt/rdaf_telegraf/conf.d:/etc/telegraf/conf.d
      - /opt/rdaf_telegraf/templates:/etc/telegraf/templates
      - /opt/rdaf_telegraf/certs:/etc/telegraf/certs
      - /opt/rdaf_telegraf/logs:/opt/rdaf/logs/telegraf/
      - /var/run/docker.sock:/var/run/docker.sock:ro
      - /proc:/host/proc:ro
      - /sys:/host/sys:ro
      - /dev:/dev:ro
      - /etc:/host/etc:ro
      - /var/run/utmp:/var/run/utmp:ro
      - /:/host/rootfs:ro
      - /var/log:/host/log:ro
      - /opt/rdaf/logs:/host/rdaf/logs:ro


EOF
7.2 Configuration
Install SSL Certificates for Docker Daemon:
Execute the following commands to copy the Host OS SSL certificates into the Telegraf configuration directory. This will enable Telegraf to collect metrics from the RDAF platform's container services.
sudo cp /etc/tlscerts/server/server.pem /opt/rdaf_telegraf/certs/server.pem
sudo cp /etc/tlscerts/server/server.key /opt/rdaf_telegraf/certs/server.key
sudo cp /etc/tlscerts/ca/ca.pem /opt/rdaf_telegraf/certs/server_ca.pem
Update the Docker service's TLS configuration with the following command:
Restart the Docker daemon service to apply the changes.
Install SSL Certificates for RDAF Platform's Kafka:
Telegraf agent sends collected metrics to the target RDAF platform's Kafka cluster services. The SSL certificates of target RDAF platform can be found under /opt/rdaf/cert folder.
Copy the CA certificate from /opt/rdaf/cert/ca/ca.pem to /opt/rdaf_telegraf/certs/rdaf_ca.pem
Copy the RDAF Platform's server certificate from /opt/rdaf/cert/rdaf/rdaf.pem to /opt/rdaf_telegraf/certs/rdaf.pem
Copy the RDAF Platform's server certificate key from /opt/rdaf/cert/rdaf/rdaf.key to /opt/rdaf_telegraf/certs/rdaf.key
Configure Telegraf for Docker Metric Collection:
Run the below commands to create Docker containers metric collection configuration file.
cd /opt/rdaf_telegraf/conf.d

cat > docker.conf <<EOF
[[inputs.docker]]
  interval = "120s"
  endpoint = "unix:///var/run/docker.sock"
  gather_services = false
  source_tag = true
  container_name_include = []
  container_name_exclude = []
  container_state_include = ["created", "restarting", "running", "removing", "paused", "exited", "dead"]
  container_state_exclude = []
  storage_objects = []
  timeout = "5s"
  perdevice = false
  #perdevice_include = ["cpu","blkio","network"]
  total = true
  total_include = ["cpu", "blkio", "network"]
  docker_label_include = []
  docker_label_exclude = ["DOCKERFILE", "author", "com.docker.compose.config-hash", "com.docker.compose.container-number", "com.docker.compose.depends_on", "com.docker.compose.image", "com.docker.compose.oneoff", "com.docker.compose.project.working_dir", "com.docker.compose.version", "io.macaw.buildtime", "io.macaw.builtby", "io.macaw.os", "io.macaw.os.buildtime", "org.opencontainers.image.base.name", "org.opencontainers.image.created", "org.opencontainers.image.description", "org.opencontainers.image.licenses", "org.opencontainers.image.ref.name", "org.opencontainers.image.title", "org.opencontainers.image.version", "org.opencontainers.image.vendor", "org.opencontainers.image.url", "org.opencontainers.image.source", "org.opencontainers.image.revision", "org.opencontainers.image.ref", "org.opencontainers.image.documentation", "org.opencontainers.image.authors", "org.opencontainers", "org.label-schema.version", "org.label-schema.vendor", "org.label-schema.vcs-url", "org.label-schema.url", "org.label-schema.schema-version", "org.label-schema.name", "org.label-schema.license", "org.label-schema.description", "org.label-schema.build-date", "org.label-schema", "org", "com.vmware.cp.artifact.flavor", "com.vmware.cp.artifact", "io.buildah.version", "io.k8s.description", "io.k8s.display-name", "io.openshift.expose-services", "io.openshift.tags", "vendor", "version", "description", "summary", "distribution-scope", "maintainer", "url", "vcs-ref", "vcs-type", "com", "com.redhat", "com.redhat.component", "com.redhat.license_terms"]
  #tls_ca = "/etc/telegraf/certs/server_ca.pem"
  #tls_cert = "/etc/telegraf/certs/server.pem"
  #tls_key = "/etc/telegraf/certs/server.key"
  #insecure_skip_verify = true
  tags = {category = "docker_metrics"}
  fieldexclude = ["container_id"]

EOF
Configure Telegraf to send Metrics to RDAF Kafka:
Configure the Telegraf to post the metrics to RDAF Platform's Kafka cluster by creating and configuring the below configuration file kafka_out.conf
cd /opt/rdaf_telegraf/conf.d

cat > kafka_output.conf <<EOF

# Host OS Metrics
[[outputs.kafka]]
brokers = ["192.168.10.10:9093", "192.168.10.11:9093", 192.168.10.12:9093]
topic = "<rdaf_tenant_id>.external.host_os_metrics"
data_format = "json"
json_timestamp_units = "1ns"
json_timestamp_format = "2006-01-02T15:04:05.000000Z"
enable_tls = true

# Copy from RDAF Platform CA Cert file @ /opt/rdaf/cert/ca/ca.pem
tls_ca = "/etc/telegraf/certs/rdaf_ca.pem"

# Copy from RDAF Platform Server Cert file @ /opt/rdaf/cert/rdaf/rdaf.pem
tls_cert = "/etc/telegraf/certs/rdaf.pem"

# Copy from RDAF Platform Server Cert Key file @ /opt/rdaf/cert/rdaf/rdaf.key
tls_key = "/etc/telegraf/certs/rdaf.key"

insecure_skip_verify = true
sasl_username = "<username>"
sasl_password = "<password>"
sasl_mechanism = "SCRAM-SHA-256"

[outputs.kafka.tagpass]
category = ["host_os_metrics"]

################################################################################

# Docker Metrics
[[outputs.kafka]]
brokers = ["192.168.10.10:9093", "192.168.10.11:9093", 192.168.10.12:9093]
topic = "<rdaf_tenant_id>.external.docker_metrics"
data_format = "json"
json_timestamp_units = "1ns"
json_timestamp_format = "2006-01-02T15:04:05.000000Z"
enable_tls = true

# Copy from RDAF Platform CA Cert file @ /opt/rdaf/cert/ca/ca.pem
tls_ca = "/etc/telegraf/certs/rdaf_ca.pem"

# Copy from RDAF Platform Server Cert file @ /opt/rdaf/cert/rdaf/rdaf.pem
tls_cert = "/etc/telegraf/certs/rdaf.pem"

# Copy from RDAF Platform Server Cert Key file @ /opt/rdaf/cert/rdaf/rdaf.key
tls_key = "/etc/telegraf/certs/rdaf.key"

insecure_skip_verify = true
sasl_username = "<username>"
sasl_password = "<password>"
sasl_mechanism = "SCRAM-SHA-256"

[outputs.kafka.tagpass]
category = ["docker_metrics"]

EOF
Please update the above highlighted parameters by getting RDAF platform's Kafka service settings from /opt/rdaf/rdaf.cfg configuration file.
Below is the sample Kafka configuration settings from /opt/rdaf/rdaf.cfg configuration file.
...
[kafka]
datadir = 192.168.121.84/kafka-logs+/kafka-controller
host = 192.168.121.84
kraft_cluster_id = MzBlZjkwYTRkY2M0MTFlZW
external_user = 20da0f30ed3442e88a93d205e0fa6f36.external
external_password = dFFrRDRIcDlKRQ==
...
host is Kafka's IP address, please update brokers parameter with it.
external_user is Kafka's username, please update sasl_username parameter with it. The username also has RDAF platform's tenant id. In the above example, 20da0f30ed3442e88a93d205e0fa6f36 is the tenant id. Please update topic parameter with it as a prefix to the Kafka topic.
external_password is Kafka's password, please update sasl_password parameter with it.
Note
Kafka's password is in base64 encoded format, please run the below command to decode it. Below mentioned encoded format is for a reference only.
Run the below commands to start the Telegraf agent service.
cd /opt/rdaf_telegraf

docker-compose -f telegraf-docker-compose.yml pull
docker-compose -f telegraf-docker-compose.yml up -d
Once Telegraf agent container service is up and running, please wait for 60 seconds run the below command.
HOST_IP=`hostname -I | awk '{print $1}'`
sed -i "s/host_ip = \"\"/host_ip = \"$HOST_IP\"/g" /opt/rdaf_telegraf/telegraf.conf
Edit /opt/rdaf_telegraf/telegraf.conf file and update the below highlighted parameter to tag the monitored RDAF platform environment. These configured global tags will be included in all of the metric payload for analytics and reporting.
Also, comment out the last 3 highlighted lines as shown below.
[global_tags]
host_ip = "192.168.10.10"
deployment = "Production_AIOps"

....
#[[outputs.discard]]
#[outputs.discard.tagpass]
#category = ["host_os_metrics", "docker_metrics", "opensearch_metrics"]
Restart the Telegraf agent container service.
8.1.1 Pstream settings
Once the Telegraf agents are installed and configured to collect metrics, a Pstream must be created on the target RDAF platform to process and store the incoming data from both Host OS and Docker container metrics.
Log into RDAF platform to which the Metrics are ingested and go to Main Menu --> Configuration --> RDA Administration --> Persistent Streams --> Click on Add
Create Pstream for Host OS Metrics:
Create the Pstream for Host OS metrics using the below settings.
Pstream Name: host_os_metrics
{
    "retention_days": 7,
    "search_case_insensitive": true,
    "messaging_platform_settings": {
        "platform": "kafka-external",
        "kafka-params": {
            "topics": [
                "host_os_metrics"
            ],
            "auto.offset.reset": "latest",
            "consumer_poll_timeout": 1.0,
            "batch_max_size": 1000,
            "batch_max_time_seconds": 2
        }
    },
    "auto_expand": [
        "tags",
        "fields"
    ],
    "_settings": {
        "number_of_shards": 3,
        "number_of_replicas": 1,
        "refresh_interval": "30s"
    }
}
batch_max_size| It is count of messages. |
|batch_max_time_seconds| is the maximum number of seconds to wait before processing the batch. A batch is processed when batch_max_time_seconds reached or batch_max_size reached, whichever is earlier. You can set batch_max_time_seconds to be < 1 as well.|
Note
consumer_poll_timeoutis deprecated. it can ignored
Create Pstream for Docker Container Metrics:
Create the Pstream for Docker container metrics using the below settings.
Pstream Name: docker_metrics
{
    "retention_days": 7,
    "search_case_insensitive": true,
    "messaging_platform_settings": {
        "platform": "kafka-external",
        "kafka-params": {
            "topics": [
                "docker_metrics"
            ],
            "auto.offset.reset": "latest",
            "consumer_poll_timeout": 1.0,
            "batch_max_size": 1000,
            "batch_max_time_seconds": 2
        }
    },
    "auto_expand": [
        "tags",
        "fields"
    ],
    "_settings": {
        "number_of_shards": 3,
        "number_of_replicas": 1,
        "refresh_interval": "30s"
    }
}