Performance & Fault Management (Metrics, Logs and Traps)
Introduction
The CloudFabrix RDAF platform provides performance & fault management for IT environments by monitoring and optimizing the performance of systems, applications, and infrastructure. This is essential for ensuring operational efficiency and meeting organizational goals. Performance & fault management involves collecting, analyzing and detecting health rule violations from various data sources:
-
Metrics: Quantitative data points that measure various aspects of system performance, such as CPU usage, memory consumption, network latency, and application response times. Metrics provide real-time insights into the health and performance of IT resources.
-
Logs: Detailed records of events and transactions generated by systems, applications, and devices. Logs capture a wide range of information, including errors, warnings, system operations, and user activities. They are crucial for diagnosing issues, auditing, and gaining deeper context into system behaviors.
-
SNMP Traps: Notifications sent from network devices when predefined events occur, offering real-time alerts on network performance and potential issues.
Together, metrics, logs and traps enable IT operation teams to identify performance bottlenecks, predict potential issues, ensure systems meet SLAs (Service Level Agreements), and maintain optimal performance in complex heterogenous IT environments.
The CloudFabrix RDAF platform supports collecting, ingesting, and processing Metrics, Logs, and SNMP traps:
- Event Gateway (for Syslogs and SNMP Traps): The Event Gateway handles the ingestion of Syslogs and SNMP traps, allowing the RDAF platform to process and react to critical events and notifications from various network devices and systems in real-time.
- Bots and Pipelines running on RDA Workers (for Metrics): The RDAF platform utilizes specialized bots and pipelines to collect and process metrics, ensuring that performance data is efficiently captured, analyzed, and utilized for monitoring.
- Telegraf Agent (Open-source tool to collect Metrics): Telegraf, an open-source agent, is integrated into the RDAF platform to collect a wide range of metrics from different sources, ensuring comprehensive coverage and real-time performance insights.
1. Event Gateway
The Event Gateway can be deployed alongside the RDAF platform deployment or as an edge service closer to the remote infrastructure. To deploy the Event Gateway at an edge location, please refer Event Gateway installation and configuration
2. RDA Worker
The RDA Worker is deployed alongside the RDAF platform deployment by default. Additionally, the RDA Worker can be deployed closer to the remote infrastructure at an edge location. To deploy the RDA Worker at an edge location, please refer RDA Worker installation and configuration
3. Telegraf Agent
Telegraf agent can be deployed using the rdaf deployment CLI when it needs to be deployed alongside the RDAF Platform. It can also be deployed at an edge location closer to the remote infrastructure.
3.1 Install within the RDAF Platform
Note
Run the following command if user is using on-premise registry
Please run the below commands to setup and install Telegraf agent service.
The above command will prompt the user for the following inputs:
- SSH user's password for the target machine where the Telegraf agent will be deployed.
- Docker registry certificate path (Optional).
- Target host's IP address where the Telegraf agent will be deployed.
- Project Id
Note
Please ensure that the above rdaf telegraf setup command is executed on the machine where the RDAF platform setup was configured using the rdaf setup command. To verify this, check if the rdaf CLI is installed by running rdaf --version command and check if the /opt/rdaf/rdaf.cfg file exists.
For Project Id, login into RDAF UI portal as MSP Admin user, go to Main Menu --> Administration --> Organizations --> Select the Organization which need to be tagged to Telegraf Agent, under the actions, click on View JSON to capture the projectId
2024-08-19 06:53:53,624 [rdaf.cmd.telegraf] INFO     - Creating directory /opt/rdaf-telegraf and setting ownership to user 1000 and group to group 1000
...
...
What is the SSH password for the SSH user used to communicate between hosts
SSH password:
Re-enter SSH password:
2024-08-19 06:54:03,538 [rdaf.cmd.telegraf] INFO     - Gathering inputs for proxy
2024-08-19 06:54:03,538 [rdaf.cmd.telegraf] INFO     - Gathering inputs for docker
What is the ca cert to use to communicate to on-prem docker registry
Docker Registry CA cert path[]:
2024-08-19 06:54:08,944 [rdaf.cmd.telegraf] INFO     - Gathering inputs for telegraf
What is the "host" on which you want the telegraf to be deployed?
telegraf host[infralatest103]: 192.168.121.61
Please specify the project id to tag metrics?
Project id[6f1a6d43-8058-4bd6-8491-4ffa88665836]:
2024-08-19 06:54:27,083 [rdaf.cmd.telegraf] INFO     - Doing setup for ssh-key-manager
2024-08-19 06:54:27,090 [rdaf.cmd.telegraf] INFO     - Doing setup for proxy
2024-08-19 06:54:27,090 [rdaf.cmd.telegraf] INFO     - Doing setup for docker
Login Succeeded
2024-08-19 06:54:27,920 [rdaf.cmd.telegraf] INFO     - Doing setup for telegraf
2024-08-19 06:54:27,941 [rdaf.component.telegraf] INFO     - Created telegraf configuration at /opt/rdaf-telegraf/config/telegraf.conf on host 192.168.121.61
2024-08-19 06:54:27,954 [rdaf.component.telegraf] INFO     - Created kafka output configuration at /opt/rdaf-telegraf/config/conf.d/kafka-output.conf on host 192.168.121.61
2024-08-19 06:54:27,955 [rdaf.cmd.telegraf] INFO     - Setup completed successfully, configuration written to /opt/rdaf-telegraf/rdaf-telegraf.cfg
Once the above command is successfully executed, please run the command below to install and configure the Telegraf agent on the configured target host.
2024-08-19 06:55:17,132 [rdaf.cmd.telegraf] INFO     - Installing telegraf
2024-08-19 06:55:17,314 [rdaf.component] INFO     - opening port 9116 on host 192.168.121.61 for telegraf
Rule added
Rule added (v6)
[+] Running 15/15
⠿ telegraf Pulled                                                                                                     ...
[+] Running 1/1
⠿ Container telegraf-telegraf-1  Started                                                                                                                                       0.8s
+----------+----------------+-----------------------+--------------+-----------+
| Name     | Host           | Status                | Container Id | Tag       |
+----------+----------------+-----------------------+--------------+-----------+
| telegraf | 192.168.121.61 | Up Less than a second | ffd0e68e0c75 | 1.0.4     |
+----------+----------------+-----------------------+--------------+-----------+
Configure SNMP Metrics Collection:
Configure the Telegraf agent to collect the SNMP metrics from the target Network Devices by creating the below configuration file snmp_metrics.conf
Edit the above file snmp_metrics.conf and configure the below parameters and save it.
- agents: Specify array of Network Devices IPs that need to be monitored using SNMP
- community: Specify the SNMP v2 community string
Below is the sample configuration.
3.2 Install at the Edge Location
Prerequisites:
- Linux OS
- Memory - 12GB or more
- CPUs - 4 or more
- Disk (/opt) - 50GB
- Docker container runtime environment (18.09.2 or above)
- Docker-compose utility (1.27.x or above)
- RDAF Platform Access: 9093/TCP (Kafka) - from Telegraf Agent VM to RDAF Platform
- SNMP Port Access: 161/UDP - Telegraf Agent to the target network devices
- Telemetry Port Access: 50055/TCP - Network Devices to Telegraf Agent
The Telegraf agent needs to be installed on a Linux OS machine that is running at an edge location and has access to the target network devices.
Log into Linux OS as a user using an SSH client such as PuTTY
Run the commands below to create the directory structure for the Telegraf agent and assign appropriate user permissions.
sudo mkdir -p /opt/rdaf-telegraf/conf.d
sudo mkdir -p /opt/rdaf-telegraf/templates
sudo mkdir -p /opt/rdaf-telegraf/certs
sudo mkdir -p /opt/rdaf-telegraf/logs
sudo chown -R `id -u`:`id -g` /opt/rdaf-telegraf
Create docker compose configuration file for Telegraf agent as shown below.
cd /opt/rdaf-telegraf

cat > telegraf-docker-compose.yml <<EOF
version: '3.6'
services:
  telegraf:
    image: cfxregistry.cloudfabrix.io/rda-platform-telegraf:1.0.4
    container_name: rda-telegraf
    restart: always
    network_mode: host
    mem_limit: 6G
    memswap_limit: 6G
    shm_size: 1gb
    ulimits:
      memlock: 514688
    logging:
      driver: "json-file"
      options:
        max-size: "25m"
        max-file: "5"
    environment:
    - HOST_PROC=/host/proc
    - HOST_SYS=/host/sys
    - HOST_MOUNT_PREFIX=/host/rootfs
    - HOST_ETC=/host/etc
    volumes:
      - /opt/rdaf-telegraf:/etc/telegraf/
      - /opt/rdaf-telegraf/conf.d:/etc/telegraf/conf.d
      - /opt/rdaf-telegraf/templates:/etc/telegraf/templates
      - /opt/rdaf-telegraf/certs:/etc/telegraf/certs
      - /opt/rdaf-telegraf/logs:/opt/rdaf/logs/telegraf/
      - /var/run/docker.sock:/var/run/docker.sock:ro
      - /proc:/host/proc:ro
      - /sys:/host/sys:ro
      - /dev:/dev:ro
      - /etc:/host/etc:ro
      - /var/run/utmp:/var/run/utmp:ro
      - /:/host/rootfs:ro
      - /var/log:/host/log:ro

EOF
Copy the SSL Certificates from RDAF Platform's Kafka Cluster:
The Telegraf agent sends the collected metrics to the RDAF platform's Kafka cluster over the configured topic. The SSL certificates of the RDAF platform are located in the /opt/rdaf/cert folder. This folder exist on the rdaf deployment CLI machine.
Copy the RDAF Platform's CA certificate from /opt/rdaf/cert/ca/ca.pem to /opt/rdaf-telegraf/certs/rdaf_ca.pem on the Telegraf agent machine.
Copy the RDAF Platform's server certificate from /opt/rdaf/cert/rdaf/rdaf.pem to /opt/rdaf-telegraf/certs/rdaf.pem on the Telegraf agent machine.
Copy the RDAF Platform's server certificate key from /opt/rdaf/cert/rdaf/rdaf.key to /opt/rdaf-telegraf/certs/rdaf.key on the Telegraf agent machine.
Configure Telegraf to send Metrics to RDAF Kafka:
Configure the Telegraf agent to publish the metrics to RDAF Platform's Kafka cluster by creating and configuring the below configuration file kafka-output.conf
cd /opt/rdaf-telegraf/conf.d

cat > kafka-output.conf <<EOF

# Network Device SNMP or Telemetry Metrics
[[outputs.kafka]]
brokers = ["192.168.10.10:9093", "192.168.10.11:9093", "192.168.10.12:9093"]
topic = "<rdaf_tenant_id>.external.snmp_metrics"
data_format = "json"
json_timestamp_units = "1ns"
json_timestamp_format = "2006-01-02T15:04:05.000000Z"
enable_tls = true
# Copy from RDAF Platform CA Cert file @ /opt/rdaf/cert/ca/ca.pem
tls_ca = "/etc/telegraf/certs/rdaf_ca.pem"

# Copy from RDAF Platform Server Cert file @ /opt/rdaf/cert/rdaf/rdaf.pem
tls_cert = "/etc/telegraf/certs/rdaf.pem"

# Copy from RDAF Platform Server Cert Key file @ /opt/rdaf/cert/rdaf/rdaf.key
tls_key = "/etc/telegraf/certs/rdaf.key"

insecure_skip_verify = true
sasl_username = "<username>"
sasl_password = "<password>"
sasl_mechanism = "SCRAM-SHA-256"

[outputs.kafka.tagpass]
input = ["SNMP", "Telemetry"]

EOF
Please update the above highlighted parameters by getting RDAF platform's Kafka service settings from /opt/rdaf/rdaf.cfg configuration file.
Below is the sample Kafka configuration settings from /opt/rdaf/rdaf.cfg configuration file.
...
[kafka]
datadir = 192.168.121.84/kafka-logs+/kafka-controller
host = 192.168.121.84
kraft_cluster_id = MzBlZjkwYTRkY2M0MTFlZW
external_user = 20da0f30ed3442e88a93d205e0fa6f36.external
external_password = dFFrRDRIcDlKRQ==
...
host is Kafka's IP address, please update brokers parameter with it.
external_user is Kafka's username, please update sasl_username parameter with it. The username also has RDAF platform's tenant id. In the above example, 20da0f30ed3442e88a93d205e0fa6f36 is the tenant id. Please update topic parameter with it as a prefix to the Kafka topic.
external_password is Kafka's password, please update sasl_password parameter with it.
Note
Kafka's password is in base64 encoded format, please run the below command to decode it. Below mentioned encoded format is for a reference only.
Configure SNMP Metrics Collection:
Configure the Telegraf agent to collect the SNMP metrics from the target Network Devices by creating the below configuration file snmp_metrics.conf
cd /opt/rdaf-telegraf/conf.d

cat > snmp_metrics.conf <<EOF

[[inputs.snmp]]
agents = [""]
community = "public"

## Timeout for each request.
timeout = "15s"
## Number of retries to attempt.
retries = 1
tags = {asset_type = "network_device", vendor = "Cisco", input = "SNMP", kpi_metric = "yes"}

[[inputs.snmp.field]]
   name = "sys_name"
   oid = "SNMPv2-MIB::sysName.0"
    is_tag = true
[[inputs.snmp.field]]
   name = "sys_location"
   oid = "SNMPv2-MIB::sysLocation.0"
    is_tag = true
[[inputs.snmp.field]]
   name = "uptime"
   oid = "DISMAN-EVENT-MIB::sysUpTimeInstance"
[[inputs.snmp.field]]
   name = "device_product"
   oid = "iso.3.6.1.4.1.9.9.402.1.3.1.2.1"
[[inputs.snmp.field]]
   name = "device_software"
   oid = "iso.3.6.1.4.1.9.9.500.1.2.1.1.8.1001"
#Temps
[[inputs.snmp.table]]
   # ciscoEnvMonTemperatureStatusTable
   name = "environmental_temperature"
   inherit_tags = ["asset_type", "vendor", "input", "sys_name"," sys_location", "kpi_metric"]
[[inputs.snmp.table.field]]
   # ciscoEnvMonTemperatureStatusDescr
   name = "temperature_status_descr"
   oid = "iso.3.6.1.4.1.9.9.13.1.3.1.2"
[[inputs.snmp.table.field]]
   # ciscoEnvMonTemperatureStatusValue
   name = "temperature_status_value"
   oid = "iso.3.6.1.4.1.9.9.13.1.3.1.3"
[[inputs.snmp.table.field]]
   # ciscoEnvMonTemperatureThreshold
   name = "temperature_threshold"
   oid = "iso.3.6.1.4.1.9.9.13.1.3.1.4"
[[inputs.snmp.table.field]]
   # ciscoEnvMonTemperatureLastShutdown
   name = "temperature_last_shutdown"
   oid = "iso.3.6.1.4.1.9.9.13.1.3.1.5"
[[inputs.snmp.table.field]]
  # ciscoEnvMonTemperatureState
  name = "temperature_state"
  oid = "iso.3.6.1.4.1.9.9.13.1.3.1.6"
#CPU
[[inputs.snmp.table]]
  name = "cpu"
  inherit_tags = ["asset_type", "vendor", "input", "sys_name","sys_location", "kpi_metric"]
[[inputs.snmp.table.field]]
  name = "cpu_total_5sec_rev"
  oid = ".1.3.6.1.4.1.9.9.109.1.1.1.1.6"
[[inputs.snmp.table.field]]
  name = "cpu_total_1min_rev"
  oid = ".1.3.6.1.4.1.9.9.109.1.1.1.1.7"
[[inputs.snmp.table.field]]
  name = "cpu_total_5min_rev"
  oid = ".1.3.6.1.4.1.9.9.109.1.1.1.1.8"
## Creating a generic field cpu_usage for CPU metric
[[processors.starlark]]
  source = '''
def apply(metric):
    # Ensure both mem_usage and mem_total are present
    cpu_usage = metric.fields.get('cpu_total_5min_rev', 0)
    if cpu_usage == 0 or cpu_usage == None:
        return metric  # Skip the metric if value is missing or cpu_usage is 0
    # Update the metric with the new field
    metric.fields['cpu_usage'] = cpu_usage
    return metric
'''
#Cisco Memory
[[inputs.snmp.table]]
  name = "memory"
  inherit_tags = ["asset_type", "vendor", "input", "sys_name","sys_location", "kpi_metric"]
[[inputs.snmp.table.field]]
  name = "memory_pool_name"
  is_tag = true
  oid = ".1.3.6.1.4.1.9.9.48.1.1.1.2"
[[inputs.snmp.table.field]]
  name = "memory_pool_free"
  oid = ".1.3.6.1.4.1.9.9.48.1.1.1.6"
[[inputs.snmp.table.field]]
  name = "memory_pool_used"
  oid = ".1.3.6.1.4.1.9.9.48.1.1.1.5"
## Creating a generic field memory_usage for Memory metric
[[processors.starlark]]
  source = '''
def apply(metric):
   # Ensure both mem_usage and mem_total are present
    mem_usage = metric.fields.get('memory_pool_used', 0)
    mem_free = metric.fields.get('memory_pool_free', 0)
    mem_total = mem_usage + mem_free
    if mem_usage == None or mem_free == None or mem_total == 0:
        return metric  # Skip the metric if any value is missing or mem_total is 0
    # Calculate the percentage of used memory
    mem_percent = ((mem_usage / mem_total) * 100)
    # Update the metric with the new field
    metric.fields['memory_usage'] = mem_percent
    return metric
'''
#Cisco Voltage
[[inputs.snmp.table]]
 # ciscoEnvMonVoltageStatus
  name = "environmental_voltage"
  inherit_tags = ["asset_type", "vendor", "input", "sys_name","sys_location", "kpi_metric"]
[[inputs.snmp.table.field]]
  name = "voltage_status_descr"
  oid = ".1.3.6.1.4.1.9.9.13.1.2.1.2"
[[inputs.snmp.table.field]]
  name = "voltage_status_value"
  oid = ".1.3.6.1.4.1.9.9.13.1.2.1.3"
[[inputs.snmp.table.field]]
  name = "voltage_state"
  oid = ".1.3.6.1.4.1.9.9.13.1.2.1.7"
#Interface Stats
[[inputs.snmp.table]]
name = "interface"
inherit_tags = [ "vendor", "sys_name","sys_location", "kpi_metric"]
[[inputs.snmp.table.field]]
  name = "in_octets"
  oid = "IF-MIB::ifHCInOctets"
[[inputs.snmp.table.field]]
  name = "out_octets"
  oid = "IF-MIB::ifHCOutOctets"
[[inputs.snmp.table.field]]
  name = "description"
  oid = "IF-MIB::ifDescr"
  is_tag = true
[[inputs.snmp.table.field]]
  name = "alias"
  oid = "IF-MIB::ifAlias"
  is_tag = true
[[inputs.snmp.table.field]]
  name = "high_speed"
  oid = "IF-MIB::ifHighSpeed"
[[inputs.snmp.table.field]]
  name = "oper_status"
  oid = "IF-MIB::ifOperStatus"
[[inputs.snmp.table.field]]
  name = "last_change"
  oid = "IF-MIB::ifLastChange"
[[inputs.snmp.table.field]]
  name = "in_errors"
  oid = "IF-MIB::ifInErrors"
[[inputs.snmp.table.field]]
  name = "out_errors"
  oid = "IF-MIB::ifOutErrors"
[[inputs.snmp.table.field]]
  name = "in_discards"
  oid = "IF-MIB::ifInDiscards"
[[inputs.snmp.table.field]]
  name = "out_discards"
  oid = "IF-MIB::ifOutDiscards"
## Creating a generic tag metric name for each metric
[[processors.starlark]]
  source = '''
def apply(metric):
        # add new field metric_name
    for key, value in metric.fields.items():
           metric.tags['metric_name'] = key
    return metric
'''
[[processors.strings]]
  [[processors.strings.lowercase]]
  field_key = "*"
  [[processors.strings.lowercase]]
  measurement = "*"
  [[processors.strings.lowercase]]
  tag_key = "*"

EOF
Edit the above file snmp_metrics.conf and configure the below parameters and save it.
- agents: Specify array of Network Devices IPs that need to be monitored using SNMP
- community: Specify the SNMP v2 community string
Below is the sample configuration.
Note
The username/password has not been provided in this documentation. If you need access credentials, please reach out to the Support Team at (support@fabrix.ai)
Docker Login
Run the below command to create and save the docker login session into CloudFabrix's secure docker repository.
Start Telegraf Agent Service
Run the below commands to start the Telegraf agent service.
cd /opt/rdaf-telegraf

docker-compose -f telegraf-docker-compose.yml pull
docker-compose -f telegraf-docker-compose.yml up -d
Configure ProjectId as a global tag:
Edit /opt/rdaf-telegraf/telegraf.conf file update the below parameters.
- projectId: RDAF Platform Organization's Project ID.
- host_ip: Telegraf agent machine's management IP address.
Note
For Project Id, login into RDAF UI portal as MSP Admin user, go to Main Menu --> Administration --> Organizations --> Select the Organization which need to be tagged to Telegraf Agent, under the actions, click on View JSON to capture the projectId
Run the below commands to restart the Telegraf agent service.
cd /opt/rdaf-telegraf

docker-compose -f telegraf-docker-compose.yml down
docker-compose -f telegraf-docker-compose.yml up -d
4. Configure Metrics Pstream
In order to consume and persist the SNMP or Telemetry metrics from the Telegraf agent, a new pstream need to be created on the RDAF platform.
To create the pstream, login into RDAF platform's UI portal and go to Main Menu --> Configuration --> RDA Administration --> Expand Persistent Streams --> Select Persistent Streams --> Click on Add button.
Enter Pstream name as rdaf_network_device_snmp_metrics, copy the below settings under Attributes section and Click on Save button.
Note
By default, the Metrics data retention is set to 2 days. Please update retention_days setting as per the data retention requirements.
5. Deploying KPI Workbench Bundle
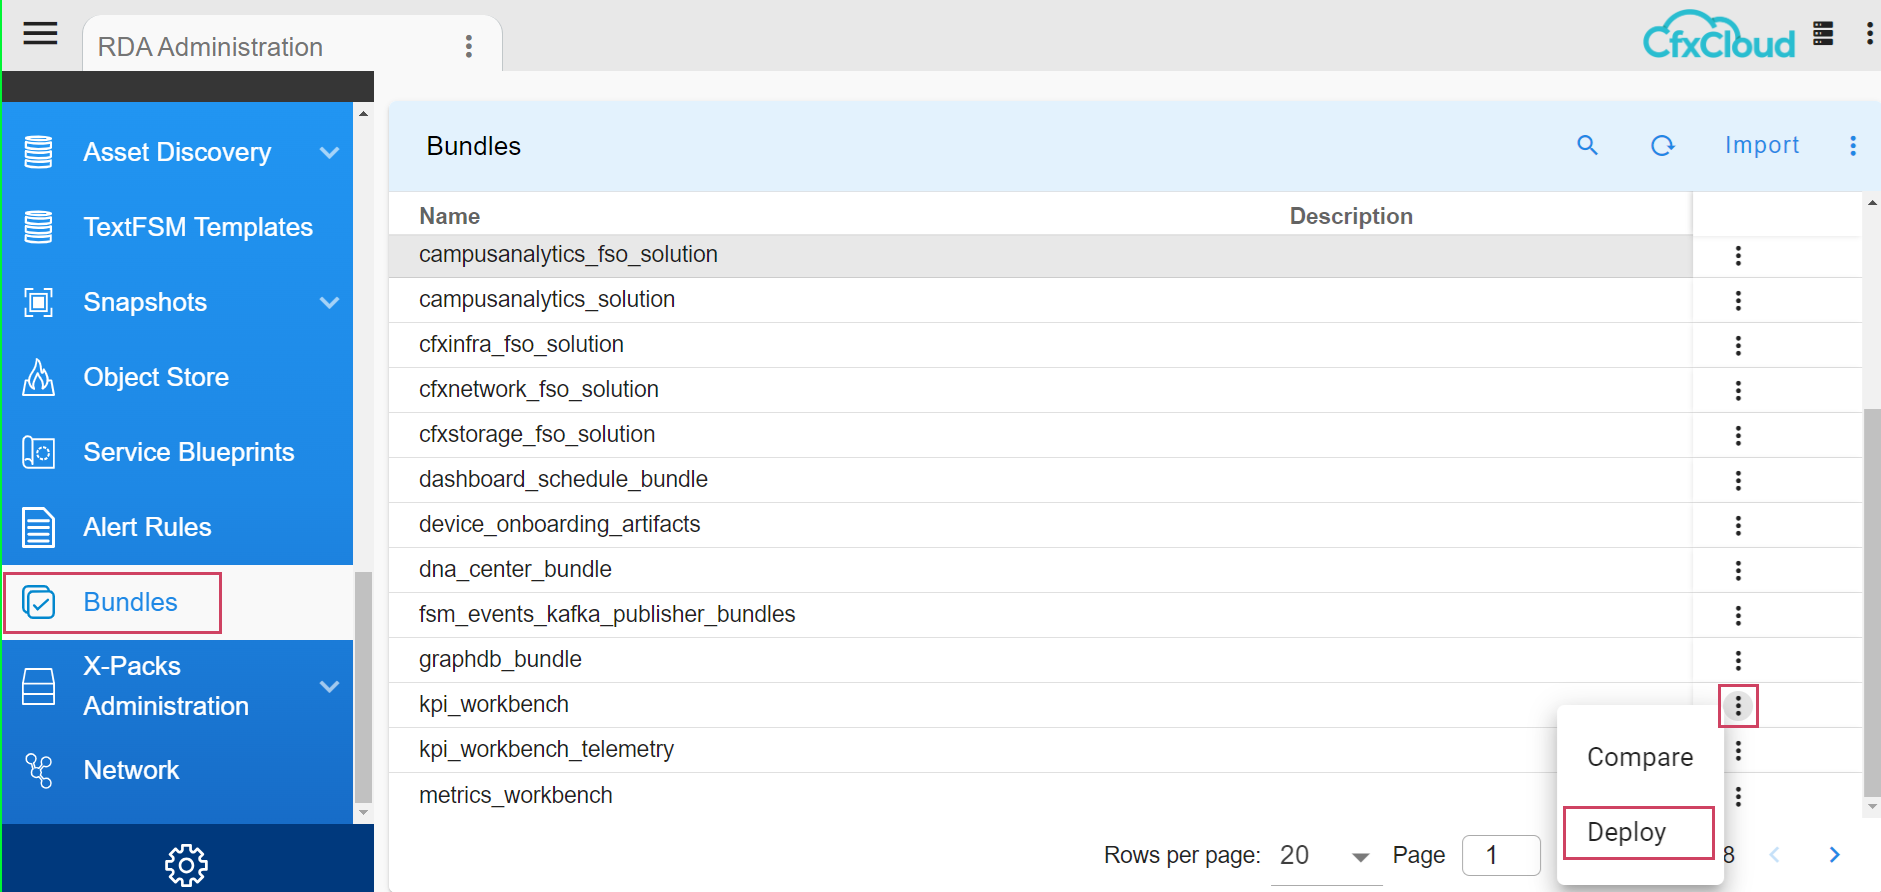
Navigation Path : Main Menu -> Configuration -> RDA Administration -> Packs -> click on Fabrix AIOps Asset Correlation Regression Row Level Action -> Activate Package
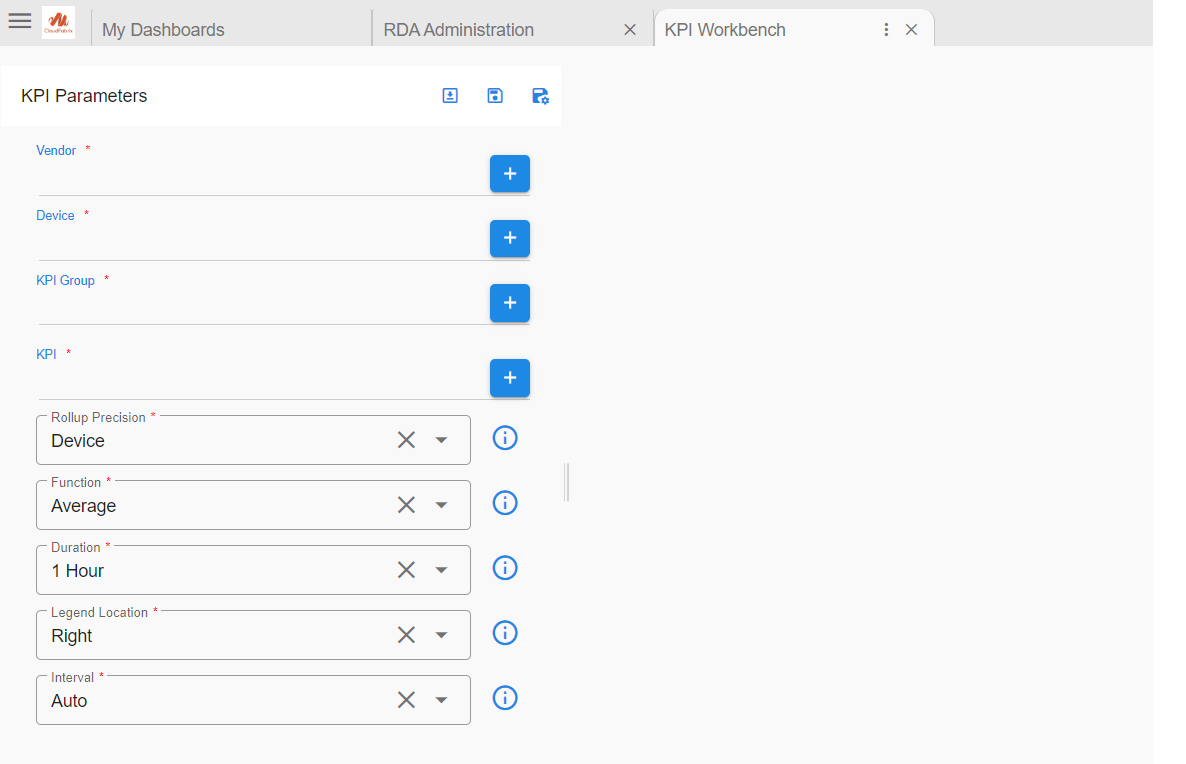
Once User deploys the bundle it will import 2 dashboards kpi-workbench & preview_kpi_Dashboard user can find these two dashboards in User Dashboards page
User need to edit preview_kpi_dashboard
From
"extra_filter": "(customerId is '{{CUST_ID}}') and (i_projectid is '{{PROJ_ID_SINGLE}}') and (customerTag is '{{CUST_TAG}}')",
"extra_filter0": "(customerId is '{{CUST_ID}}') and (i_projectid is '{{PROJ_ID_SINGLE}}') and (customerTag is '{{CUST_TAG}}')",
Click on the kpi-workbench dashboard
6. Adding New Metrics to KPI
Follow the below steps to add new metrics to display as KPIs in the Workbench dashboard.
-
In the Workbench form, the KPI field will be populated using the dynamic_field_data_mapping section in the preview_kpi_dashboard.
-
Each SNMP metric table will have a name saved in the name column in the Pstream
rdaf_network_device_snmp_metrics. The dynamic_field_data_mapping section should include metrics relevant to that table.
For example, the interface table will include metrics such as in_discards, out_discards, in_errors, out_errors, in_octets, and out_octets. All metrics fields will be prefixed with m_, and inventory fields will be prefixed with i_ in the metrics Pstream
These metrics should be added to the interface group as follows:
Note
Only the metrics included in the dynamic_field_data_mapping section will be available as KPI metric fields in the Workbench form for the corresponding KPI group.
Metrics Configuration
Metrics |
Description |
|---|---|
| name | Label for the metric |
| value | Pstream column corresponding to the metric |
| unit | Unit of the metric (Optional, required for counter metrics for delta aggregation in time series widgets) |
"interface": [
            {
                "name": "InOctets",
                "value": "m_in_octets",
                "unit": "counter"
            },
            {
                "name": "OutOctets",
                "value": "m_out_octets",
                "unit": "counter"
            },
            {
                "name": "InDiscards",
                "value": "m_in_discards",
                "unit": "counter"
            },
            {
                "name": "OutDiscards",
                "value": "m_out_discards",
                "unit": "counter"
            },
            {
                "name": "InErrors",
                "value": "m_in_errors",
                "unit": "counter"
            },
            {
                "name": "OutErrors",
                "value": "m_out_errors",
                "unit": "counter"
            }
        ]
7. Alert State Manager (ASM)
Alert State Manager (ASM) is a health monitoring and alert notification service within the RDAF platform. It allows the creation of health violation (alert) rules for both Metrics and Logs (Syslog and SNMP Traps).
Alerting Rules allow users to define conditions for triggering alerts based on CFXQL query language expressions. These rules also enable sending notifications about OPEN vs CLEAR alerts to internal or external services using webhooks.
Alert State Manager (ASM) supports the following two types of alerting rules.
-
Metric Alert Rules: Based on the configured metric threshold, these rules control when to trigger an OPEN alert and when to send a CLEAR notification.
-
Log Alert Rules: Based on specific patterns or severity levels within Syslog or SNMP Trap messages, these rules determine when to trigger an OPEN alert and when to send a CLEAR notification.
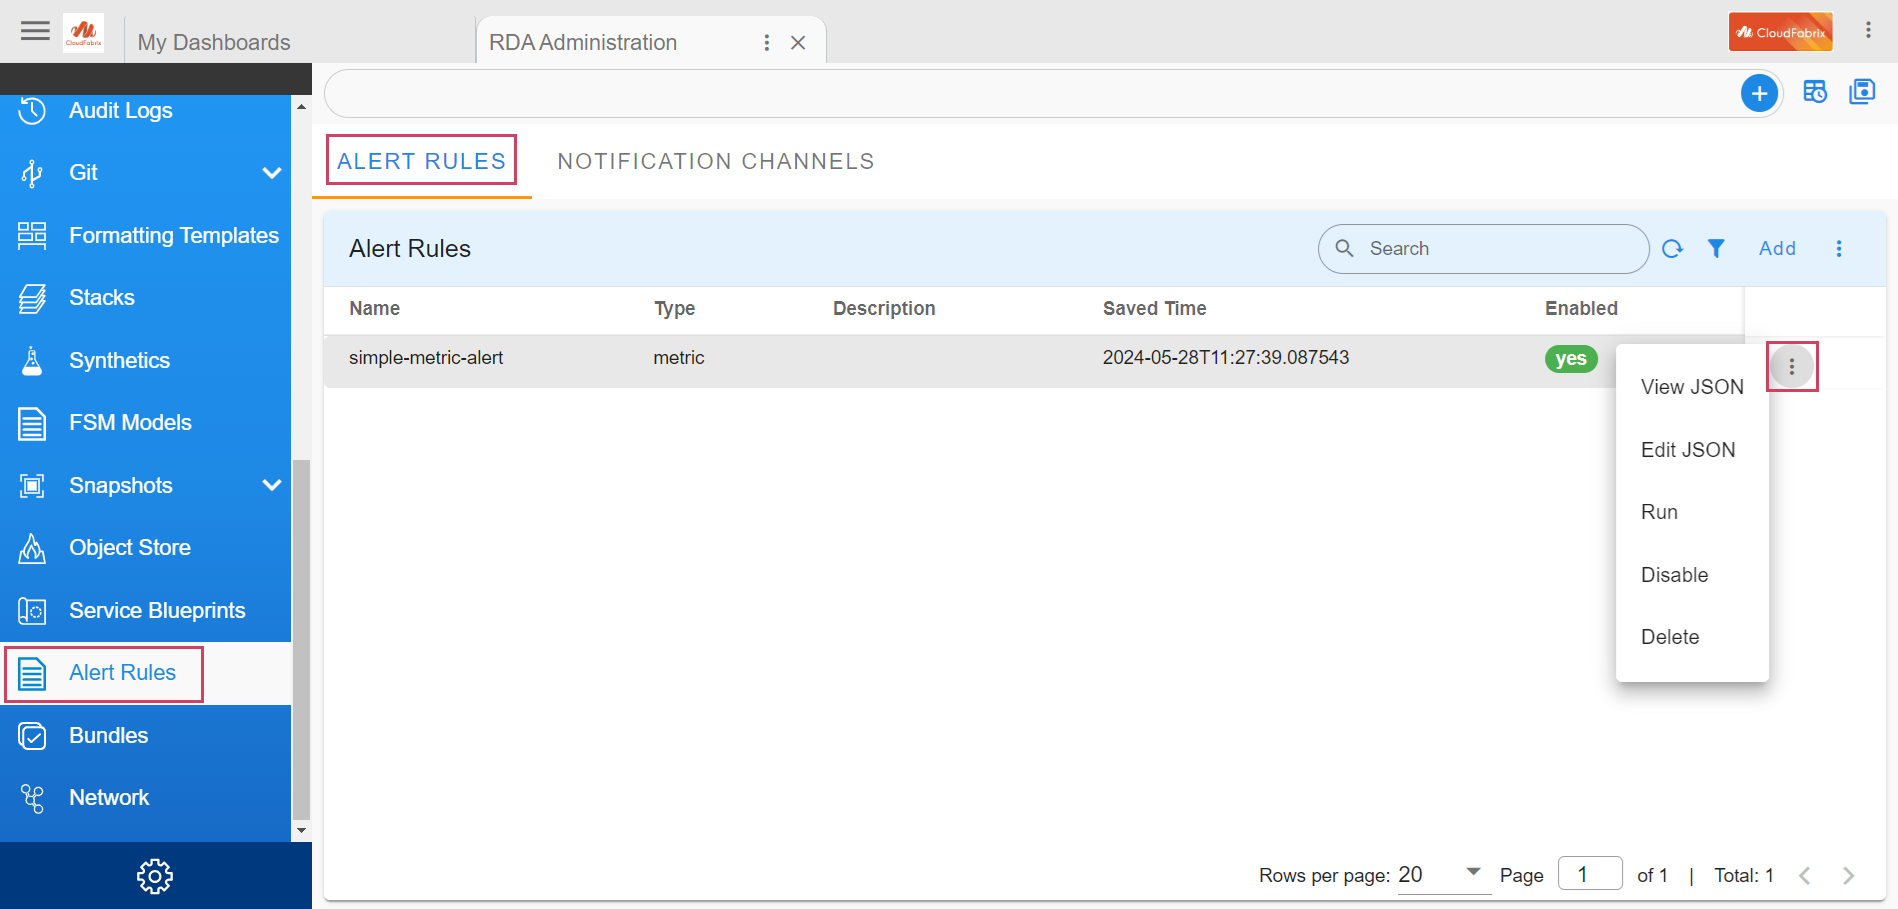
To configure and manage Alert Rules from RDAF Platform's UI, please go to
Main Menu --> Configuration --> RDA Administration --> Alert Rules.
It allows performing CRUD (Create, Read, Update, Delete) operations on the alert rules, and also provides the ability to enable or disable these rules.
7.1 Kafka Notification Attributes
The following attributes must be defined in the ASM mapper to support Kafka notifications.
1) a_en_alert_name
2) a_alert_type
3) a_en_md5
[
  {
    "from": "alert_type",
    "to": "alertType"
  },
  {
    "from": "alert_name",
    "to": "alert_name"
  },
  {
    "from": "md5",
    "to": "md5"
  }
]
The details of the OIA Incident id and ITSM Ticket id attributes will be populated in the alert-rules-open-clear dashboards after the above mentioned parameters are added to the mapper.
Tip
When alert mapper is created within OIA (AIOps) application, to process both metric and log type alert notifications, below static attribute need to be defined within the alert mapper.
Attribute Name: sourceSystemType
Attribute Value: ASM
7.2 Metrics Alert Rule
Sample metric alert rule: It showcases how to set the rule type, set the query to be alerted on, define alert conditions for different states.
{
  "type": "metric",
  "name": "simple-metric-alert",
  "enabled": false,
  "schedule": {
    "minutes": 5
  },
  "data": {
    "stream": "sample_metric_data",
    "groupby": [
      "device",
      "metric_name"
    ],
    "query": "metric_name == 'cpu' or metric_name == 'mem'"
  },
  "actions": [
    {
      "state": "OPEN",
      "threshold": "90",
"repeat_count": 2,
      "agg_column": "value",
      "agg_func": "avg",
      "throttle": {
        "value": 30,
        "unit": "MINUTES"
      },
      "attributes": {
        "severity": "CRITICAL"
      },
      "notification": [
        {
          "channel": "sample_webhook"
        }
      ]
    },
    {
      "state": "CLEAR",
      "threshold": "80",
      "repeat_count": 2,
      "agg_column": "value",
      "agg_func": "avg",
      "notification": [
        {
          "channel": "sample_webhook_2"
        }
      ]
    }
  ],
  "saved_time": "2024-05-30T21:27:20.946666"
}
Parameter Name |
Description |
|---|---|
type |
Type of the alert rule. Supported values are metric and log. Note: Some of the below parameters are applicable only for metric type alert rule. Please refer log type alert rule section for appropriate parameters. |
name |
Unique name of the alert rule |
enabled |
To Enable or Disable the alert rule. Supported values are true or false. This operation can also be performed via UI Enable / Disable action. |
schedule |
Determines the frequency at which the alert rule needs to be executed.start_date: The starting point for the interval calculation, specified in ISO format (e.g., 2024-05-30T01:30:00). This field is optional; if not provided, the default will be the current time when the schedule is created.end_date: The latest possible date and time for the alert rule to trigger. If not specified, there is no end date.hours: The number of hours to wait between executions.minutes: The number of minutes to wait between executions. |
data |
stream: Name of the Pstream.groupby: Specifies the Metric field names that determine the uniqueness of the records for which the metric alert rule should be applied. This allows the alert rule to aggregate data based on these Metric fields and apply conditions to each unique combination. Note: If any fields or columns from the Metric record are to be included in the alert notification payload, they need to be included under groupby.ts_column: The timestamp column or field to use (e.g., metric_timestamp). Default: The timestamp property set in the pstream settings; if not specified, the default column or field is timestamp.query: The CFXQL query applied to filter the metric data. This query defines the criteria for selecting which metrics will be evaluated by the alert rule. |
actions |
For metric type alert rule, both OPEN and CLEAR state actions are supported.state: Represents the alert status. It can be either OPEN or CLEAR. The CLEAR state is used to indicate that an alert condition has been resolved, but it applies only when the alert was previously in the OPEN state.threshold: The Metric value used to determine if the alert condition is met. It defines the point at which the metric data should trigger an alert if it exceeds (>= for OPEN) or falls below (<= for CLEAR) this threshold value.repeat_count: Specifies the number of consecutive times the alert conditions must be met before the alert state is set and a notification is sent. The default value is 1.agg_column: Specifies the column containing the Metric values to be aggregated when there are multiple Metric values. This column is used to perform aggregation operations, such as summing or averaging, before applying the alert rule.agg_func: Specifies the aggregate function to be used when multiple values are present. The default function is avg (average). Other functions, such as sum, min, or max, can be used based on the requirement.throttle: If set to 1 hour, the alert notification will not be sent again if the condition matches until the throttle period expires. Once the throttle time has passed and if the alert condition still satisfies, another notification will be sent, and the throttle period will restart. Note: throttle is only applicable for OPEN stateunit: Specify the value as MINUTES or HOURS value: Numeric number |
attributes |
Any key-value pair attributes can be specified, such as severity, message etc., will be included in the alert payload of the notification. Users can now define custom message templates within the attributes object. This allows for dynamic alert descriptions by injecting variables directly from the payload. This is accomplished by referencing any field present in the payload's data object by enclosing the key in double curly braces. Example Usage: "attributes": { |
notification |
Specify one or more Notification channels. channel: Specify notification channel name. Note: Currently only Webhook based notifications are supported. |
Alert State Lifecycle Management:
Alert State Management data is persisted in the rda_alert_state_management_data pstream. To support the alert lifecycle, a new record is created for each device and metric combination when an alert transitions to the OPEN state, provided it was previously in the CLEAR state or if no record exists for the same device and metric combination.
7.3 Log Alert Rule
{
    "type": "log",
    "name": "simple-log-alert",
    "enabled": false,
    "schedule": {
        "minutes": 5
    },
    "data": {
        "stream": "sample_syslog_data",
        "groupby": [
            "device",
            "message_id",
            "message"
        ],
        "query": "(message contains 'error')"
    },
    "actions": [
        {
            "attributes": {
                "severity": "CRITICAL"
            },
            "throttle": {
                "value": 30,
                "unit": "MINUTES"
            },
            "notification": [
                {
                    "channel": "sample_webhook"
                }
            ]
        }
    ],
    "saved_time": "2024-06-25T00:15:30.185885"
}
{
    "type": "log",
    "name": "log-alert",
    "enabled": false,
    "schedule": {
        "minutes": 5
    },
    "data": {
        "stream": "sample_syslog_data",
        "query": "(message contains 'ERROR')"
        "unique_keys": [
            "device_ip",
            "syslog_code",
            "message"
        ],
         "additional_columns": [
            "device_hostname"
        ],
        "padding_time_seconds": 15,
        "limit": 1000
    },
    "actions": [
        {
            "state": "OPEN",
            "extra_query": "link_status is 'DOWN'",
            "attributes": {
                "link_status": "DOWN"
                "severity": "CRITICAL"
            },
            "throttle": {
                "value": 30,
                "unit": "MINUTES"
            },
            "notification": [
                {
                    "channel": "sample_webhook"
                }
            ]
        },
        {
            "state": "CLEAR",
            "extra_query": "link_status is 'UP'",
            "attributes": {
                "link_status": "UP",
                "severity": "CRITICAL"
            },
            "notification": [
                {
                    "channel": "sample_webhook"
                }
            ]
        }
    ],
    "saved_time": "2024-06-24T22:53:48.711224"
}
extra_query.
Note
The extra_query could be used for metric alerts as well.
In order to not miss out on any log events, by default added a time buffer (padding_time_seconds) of 15 seconds. The max allowed is 60 seconds. To disable this, it can be set to 0.
For log type alerts with large messages, internal groupby and aggregation operations can result in slow performance or failures, particularly when messages exceed 1024 bytes. To address this, the system now provides the unique_keys option. By default, query results are limited to 1000 rows, which is configurable. As data grouping is avoided, the system supports inclusion of additional_columns in the payload.
Note
The additional_columns can also be applied when groupby is used for metric and log-based alerts.
{
    "type": "log",
    "name": "simple-log-alert-new",
    "enabled": false,
    "schedule": {
        "minutes": 5
    },
    "data": {
        "stream": "sample_syslog_data_new",
        "unique_keys": [
            "device",
            "message_id",
            "message"
        ],
        "additional_columns": [
            "reason"
        ],
 "padding_time_seconds": 15,
        "limit": 1000,
        "query": "(message contains 'error')"
    },
    "actions": [
        {
            "attributes": {
                "severity": "CRITICAL"
            },
            "throttle": {
                "value": 30,
                "unit": "MINUTES"
            },
            "notification": [
                {
                    "channel": "sample_webhook"
                }
            ]
        }
    ],
    "saved_time": "2024-07-22T23:21:16.372146"
}
{
  "alert_name": "simple-log-alert-new",
  "alert_type": "log",
  "attributes": {
    "severity": "CRITICAL"
  },
  "data": {
    "device": "10.10.10.2",
    "reason": "network issue",
    "message_id": "m_2",
    "message": "error occurred critical"
  },
  "md5": "393d58ef378b4470ae5ff0c4c927ad99",
  "open_timestamp": "2024-07-22T23:23:56.995724"
}
7.4 Support for Post-Processing Alert Messages Using Enrich, Grok, Regular Expression & Eval Expression
For example, when a log message has a timestamp in it and when user includes the message as a unique key in the alert rule, it makes each message unique even if the same log appears later with a different timestamp which results in repetitive alerts.
So the solution in such cases is to post-process the log message to extract the message w/o timestamp that could be used as a key. For post-processing, Enrich, Grok, Regular Expression and Eval expression are supported.
Enrich option can be used to add additional context by enriching the alert payload and add it to the decision making to raise an alert or not.
"data_transformations": [
    {
        "type": "enrich",
        "dict_type": "dataset",
        "dict_name": "sample_devices",
        "condition": "device == '$device'",
        "enrich_cols": {
            "foo": "e_foo",
            "bar": "e_bar"
        }
    }
]
Parameter Name |
Description |
|---|---|
dict_type |
Only ‘dataset’ is supported. |
dict_name |
name of the dictionary to use. Example: name of the dataset. |
condition |
A condition where the LHS operator is a column defined in the dataset and the RHS operator can be either a constant value or an element in the payload prefixed by a dollar($) symbol. This needs to be a valid CFXQL expression. |
enrich_cols |
The columns to add as enriched values. Supported formats are 1) single column name as a string - “foo”. 2) comma-separated list of column names as a string - “foo,bar” column. 3) dictionary of column names with key being the column name in the dataset and value being the desired name of the enriched attribute - (“foo”: “e_foo”, “bar”: “e_bar”) |
For log-based alerts, you can use a filter_condition within the alert action. This condition is evaluated against the alert payload to determine whether the alert should be triggered. Must be a valid CFXQL expression that is applied to the payload
The following example illustrates it.
When unique_keys is used, optionally data_transformations can be used to post-process the results of the query. If multiple patterns are provided, they will be processed in that order. The variable(s) that result from the data transformations need to be included in either additional_columns or custom_unique_keys. The difference is, the variables in custom_unique_keys are used to eliminate duplicate messages.
Note
User can also apply data_transformations when using groupby for both metric and log-based alerts.
{
    "type": "log",
    "name": "simple-log-alert-grok",
    "enabled": false,
    "schedule": {
        "hours": 5
    },
    "data": {
        "stream": "sample_syslog_data_new",
        "unique_keys": [
            "device"
        ],
        "custom_unique_keys": [
            "logLevel",
            "logMessage"
        ],
        "additional_columns": [
            "message",
            "prod"
        ],
        "query": "(message contains 'error')",
        "data_transformations": [
            {
                "type": "grok",
                "column": "message",
                "pattern": "%{TIMESTAMP_ISO8601:time} %{LOGLEVEL:logLevel} %{GREEDYDATA:logMessage}"
            },
         {
   "type": "enrich",
   "dict_type": "dataset",
   "dict_name": "sample_devices",
   "condition": "device == '$device'",
   "enrich_cols": {
       "is_prod": "prod"
   }
     },
            {
                "type": "eval",
                "columns": {
                    "logLevel": {
                        "expr": "logLevel if notnull(logLevel) else 'INFO'",
                        "default": "INFO"
                    },
                    "logMessage": {
                        "expr": "logMessage if notnull(logMessage) else message",
                        "default": "Not available"
                    }
                }
            }
        ],
        "limit": 5
    },
    "actions": [
        {
            "attributes": {
                "severity": "CRITICAL"
            },
            "filter_condition": "prod is 'yes'"
            "throttle": {
                "value": 30,
                "unit": "MINUTES"
            },
            "notification": [
                {
                    "channel": "sample_webhook"
                }
            ]
        }
    ],
    "saved_time": "2024-11-20T02:50:58.240609"
}
Note
timestamp is a keyword and they should not be used as a variable.
{
  "alert_type": "log",
  "alert_name": "simple-log-alert-grok",
  "md5": "a84defa84c5750b1e97acfadfcc303b1",
  "open_timestamp": "2024-11-20T04:42:59.479695",
  "data": {
    "device": "10.10.10.12",
    "logMessage": "Error message 1",
    "logLevel": "ERROR",
    "prod": "yes",
    "message": "2024-11-20T01:50:50.413342 ERROR Error message 1"
  },
  "attributes": {
    "severity": "CRITICAL"
  }
}
In the above payload, logLevel and logMessage are derived from the message column based on the grok and are used in custom_unique_keys. prod is derived from the dictionary dataset.
In the following payload, when grok does not result in logLevel and logMessage, the eval sets values for them accordingly. For eval, the user has an option to set a default value for any unique key in case expression used in eval results in any errors.
{
  "alert_type": "log",
  "alert_name": "simple-log-alert-grok",
  "md5": "365ce43491d8982f7c70cb36d71beaf9",
  "open_timestamp": "2024-11-20T04:42:59.562306",
  "data": {
    "device": "10.10.10.22",
    "logMessage": "2024-11-20T01:50:50.413342 Testing Error message 2",
    "logLevel": "INFO",
    "prod": "yes",
    "message": "2024-11-20T01:50:50.413342 Testing Error message 2"
  },
  "attributes": {
    "severity": "CRITICAL"
  }
}
Added an option all_custom_unique_keys_must_exist which will aid in not sending the notification if any of the custom uniques are not set. The default setting for all_custom_unique_keys_must_exist is false.
7.5 Notification Channels
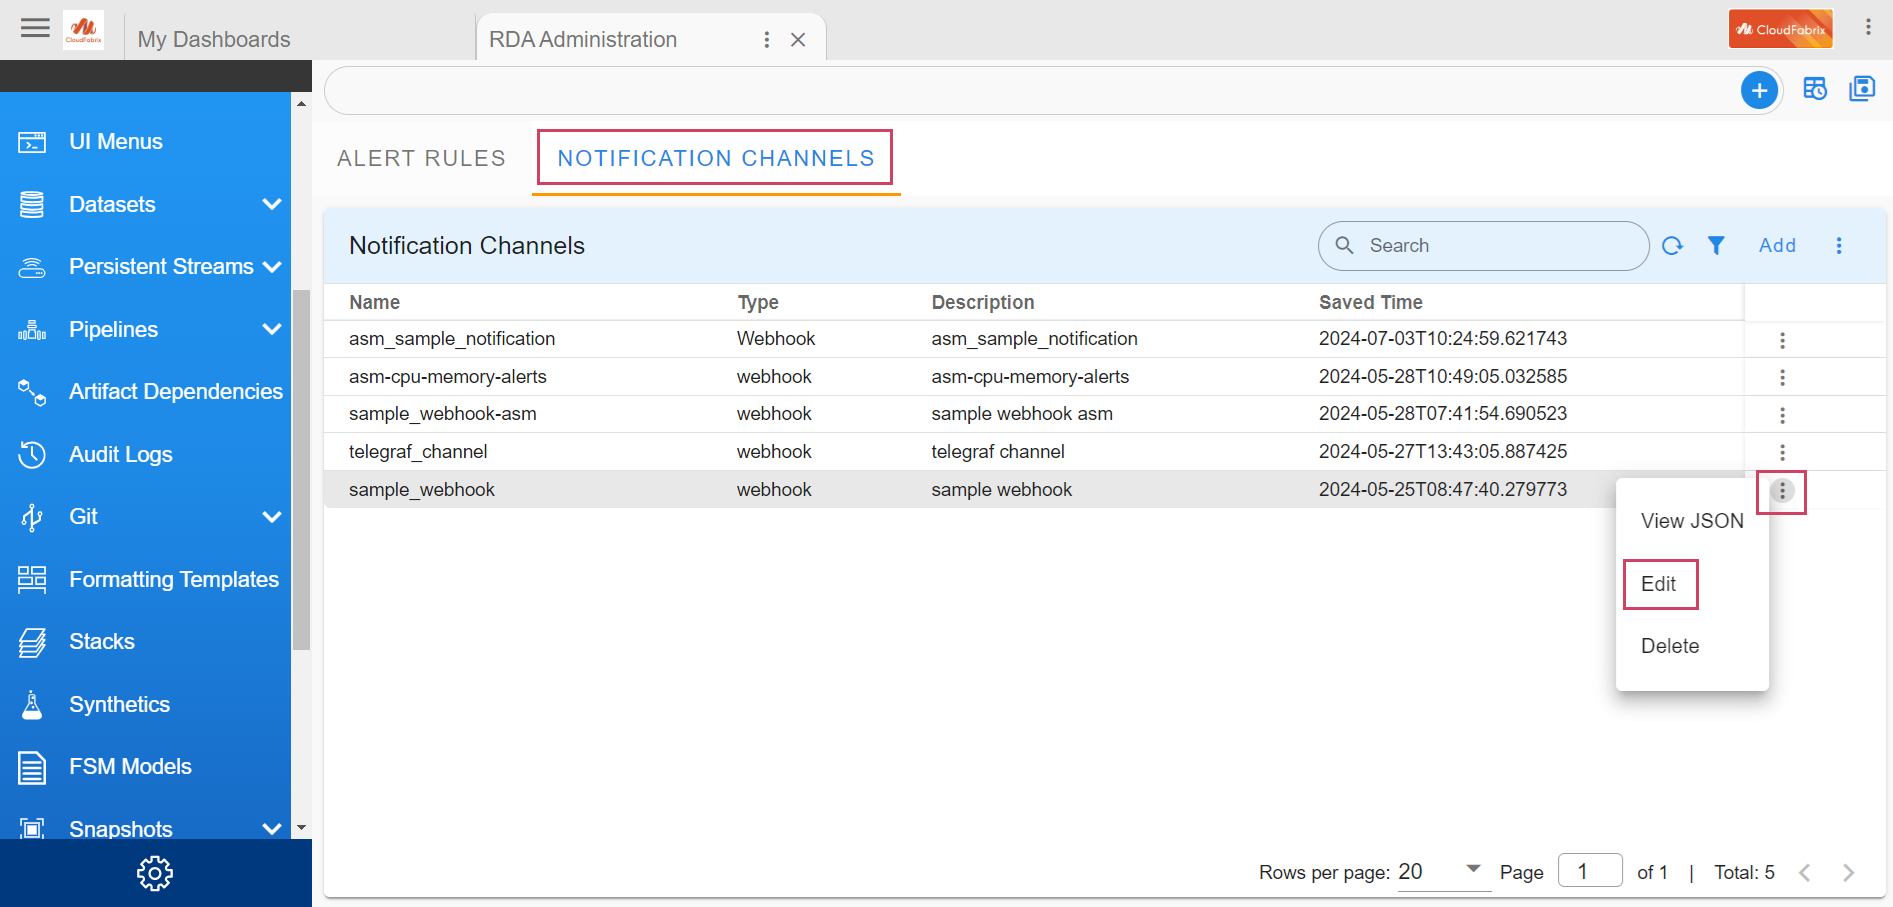
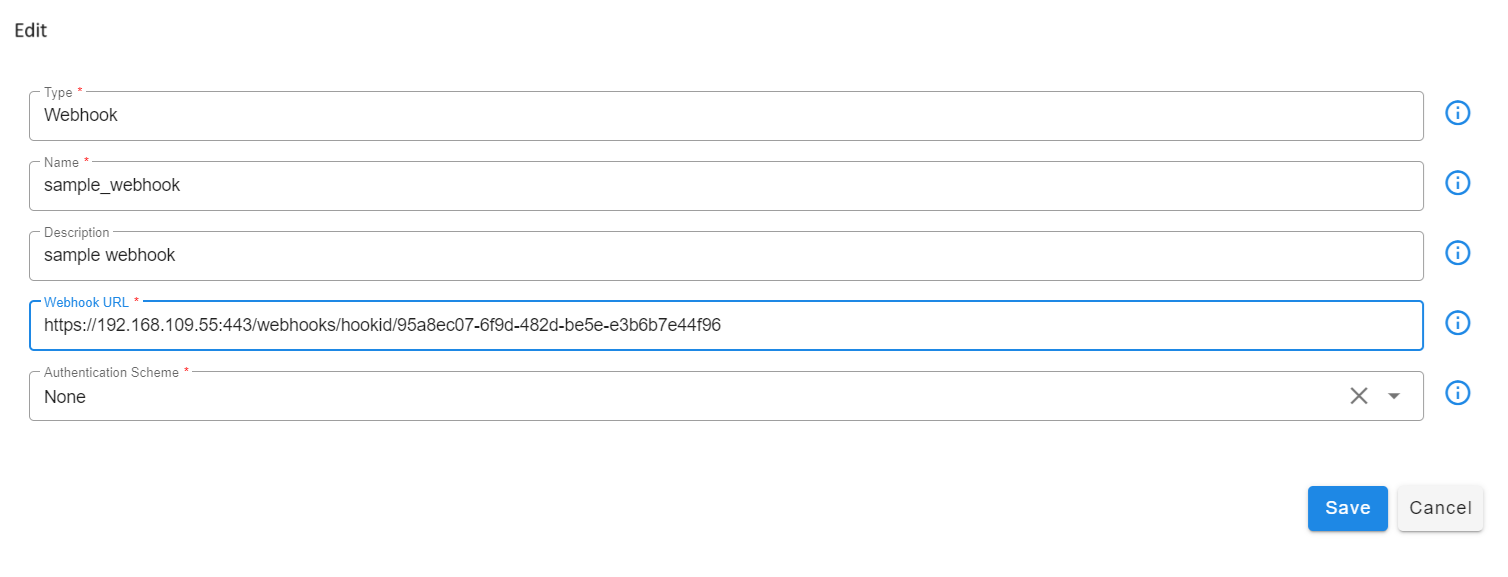
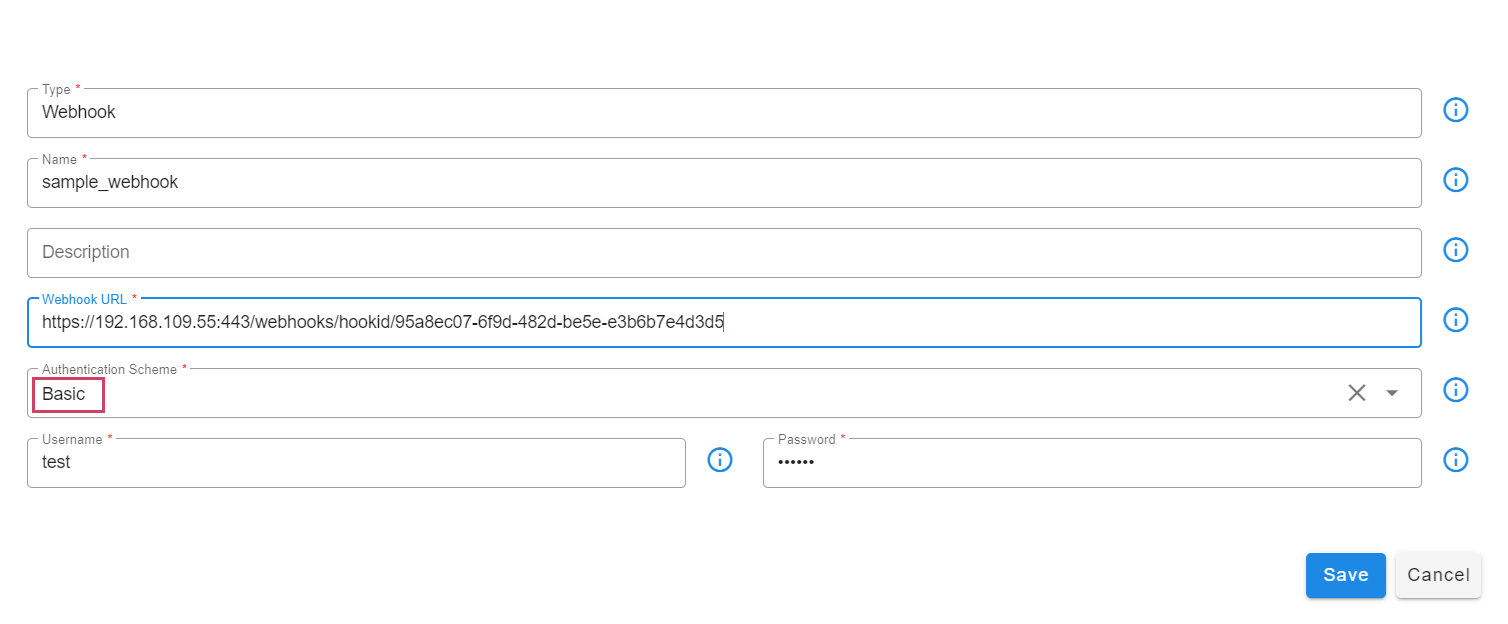
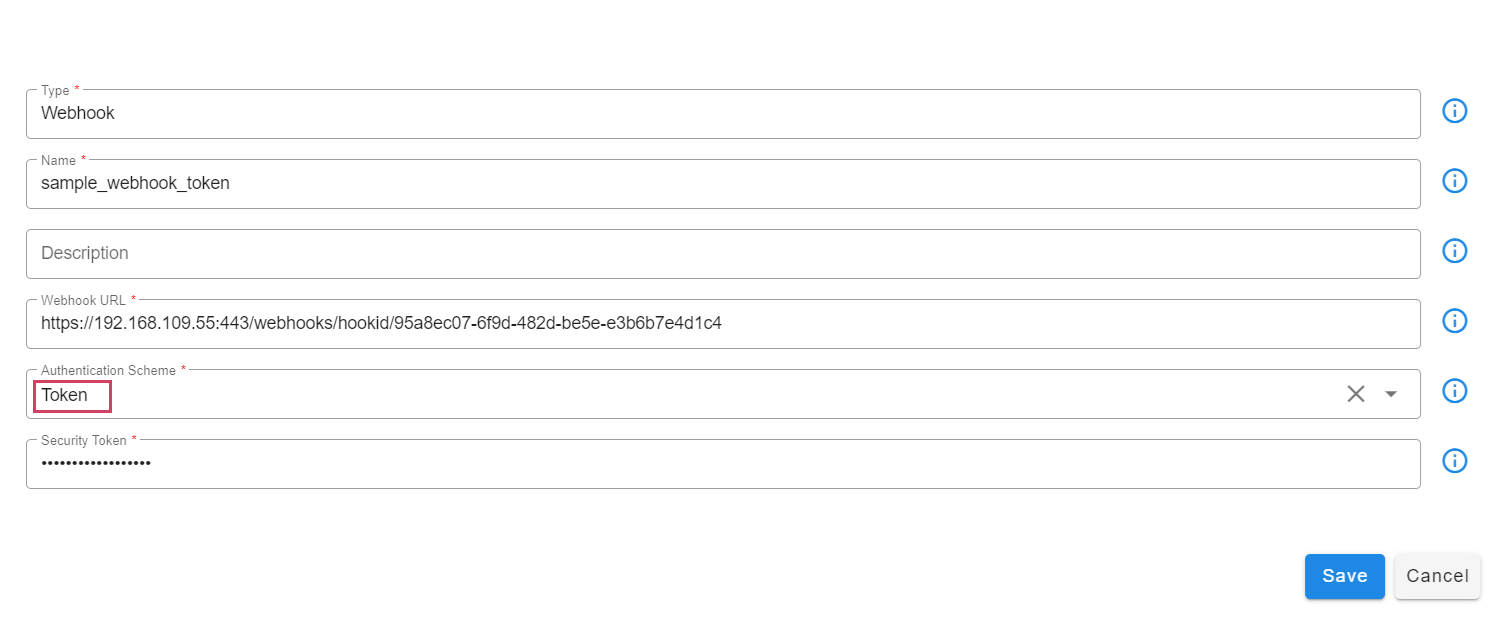
Notification Channels allow you to configure and specify where to send alert notifications. Currently, Webhook-based notifications are supported.
To create or modify a Notification Channel, login into RDAF Platform as MSP Admin user and go to Main Menu --> Configuration --> RDA Administration --> Alert Rules --> Notification Channels
The Webhook-based Notification Channel supports the following authentication modes:
- No Authentication
- Basic Authentication
- Token-based Authentication
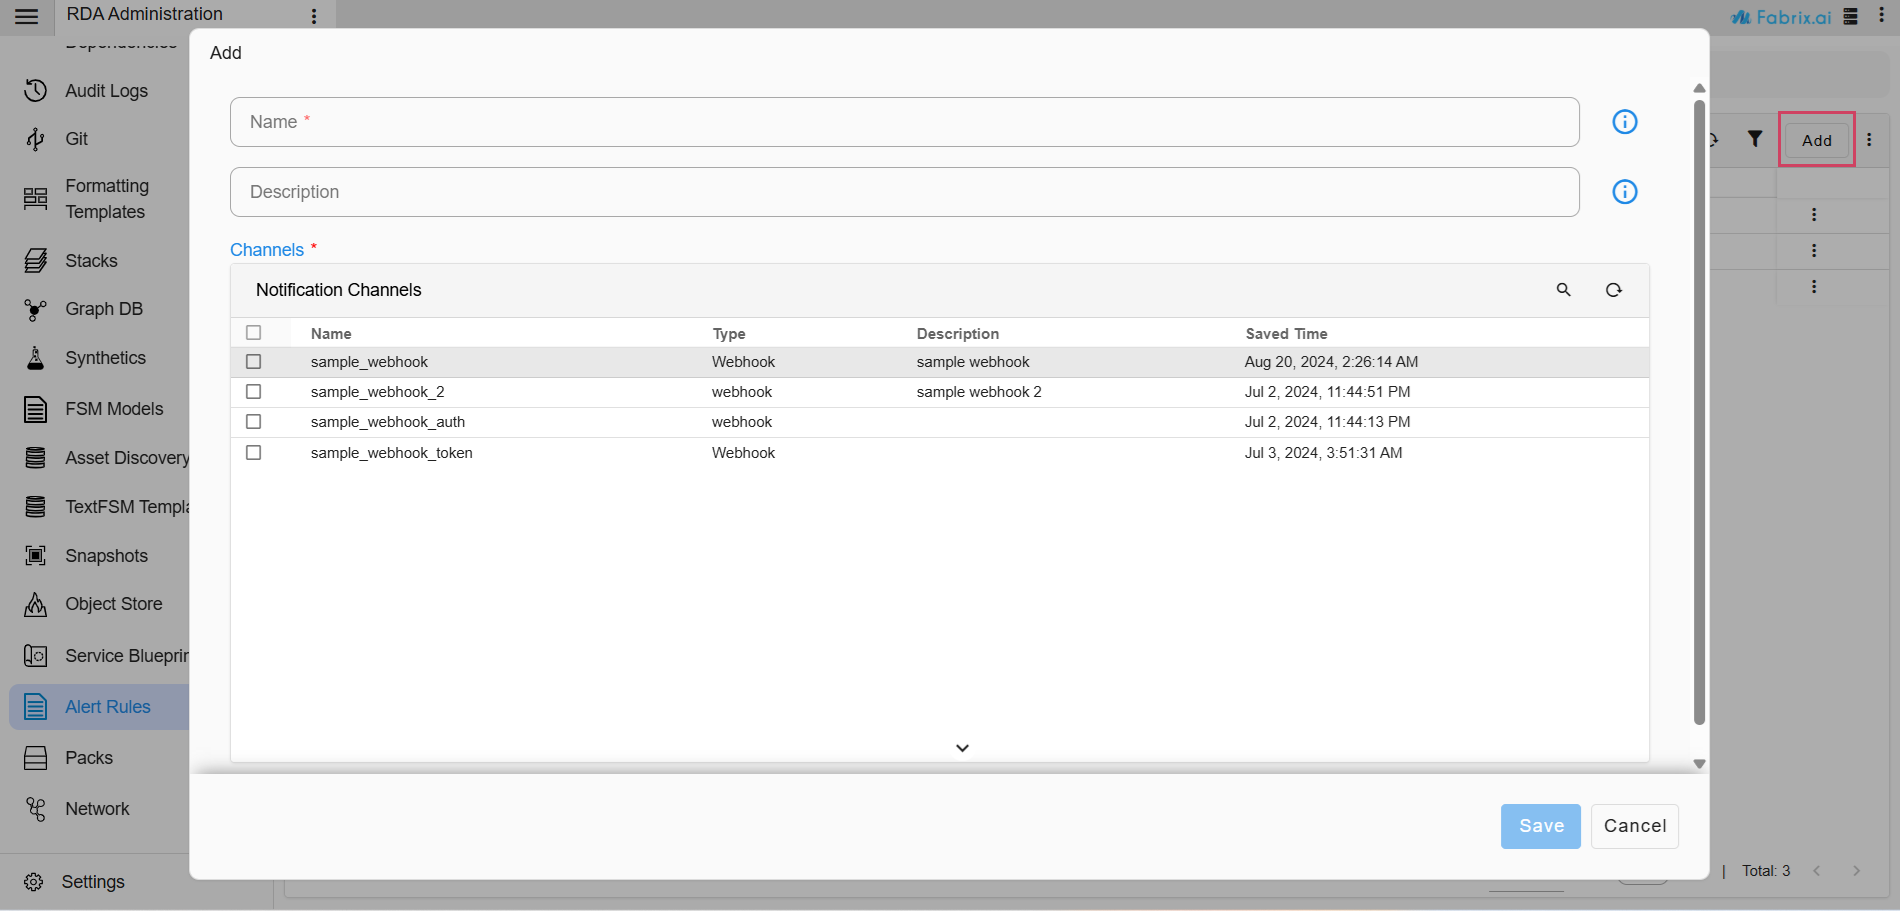
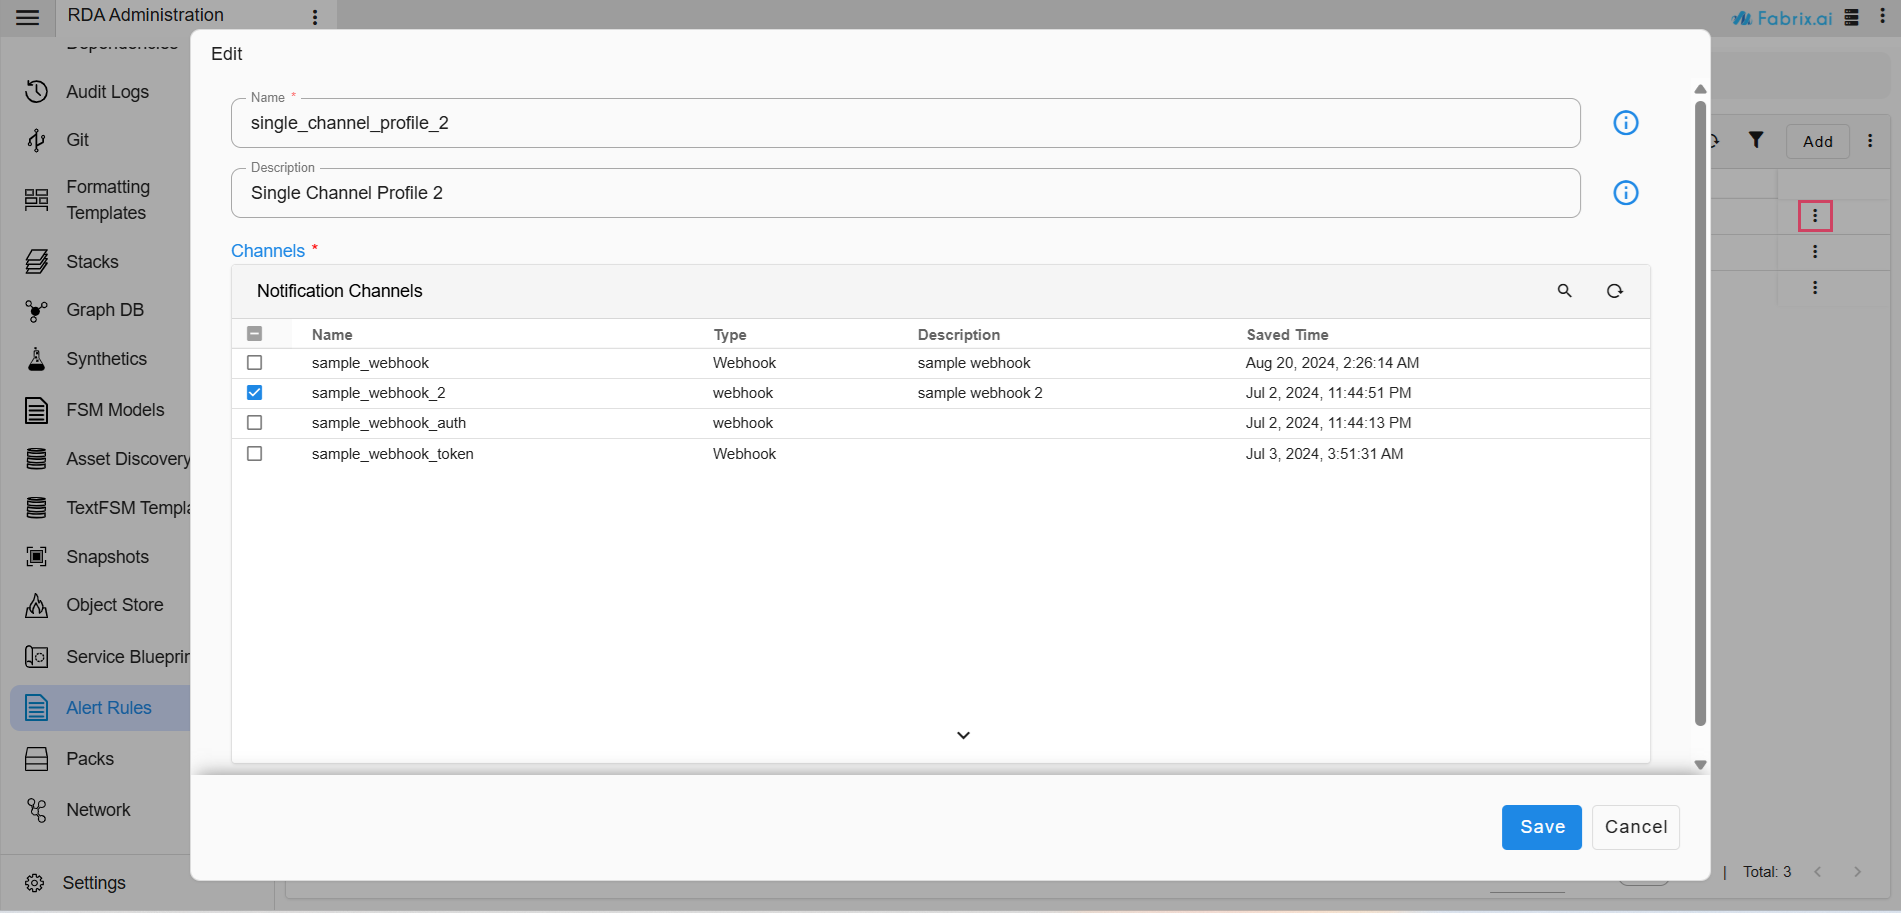
Added support to create notification profile which can be set to one or more channels and can be used to point out to notification definition in the alert rules instead of explicitly setting it to one or more channels. With this approach alert rules can be mapped to notification profile and when the notification profile is updated with new webhook or other notification mechanism, it will be applied to all alert rules that are mapped to the notification profile.
There are now two methods available for configuring notifications within an Alert Rule.
1) By setting it to notification profile (Preferred way)
2) By including the channels directly.
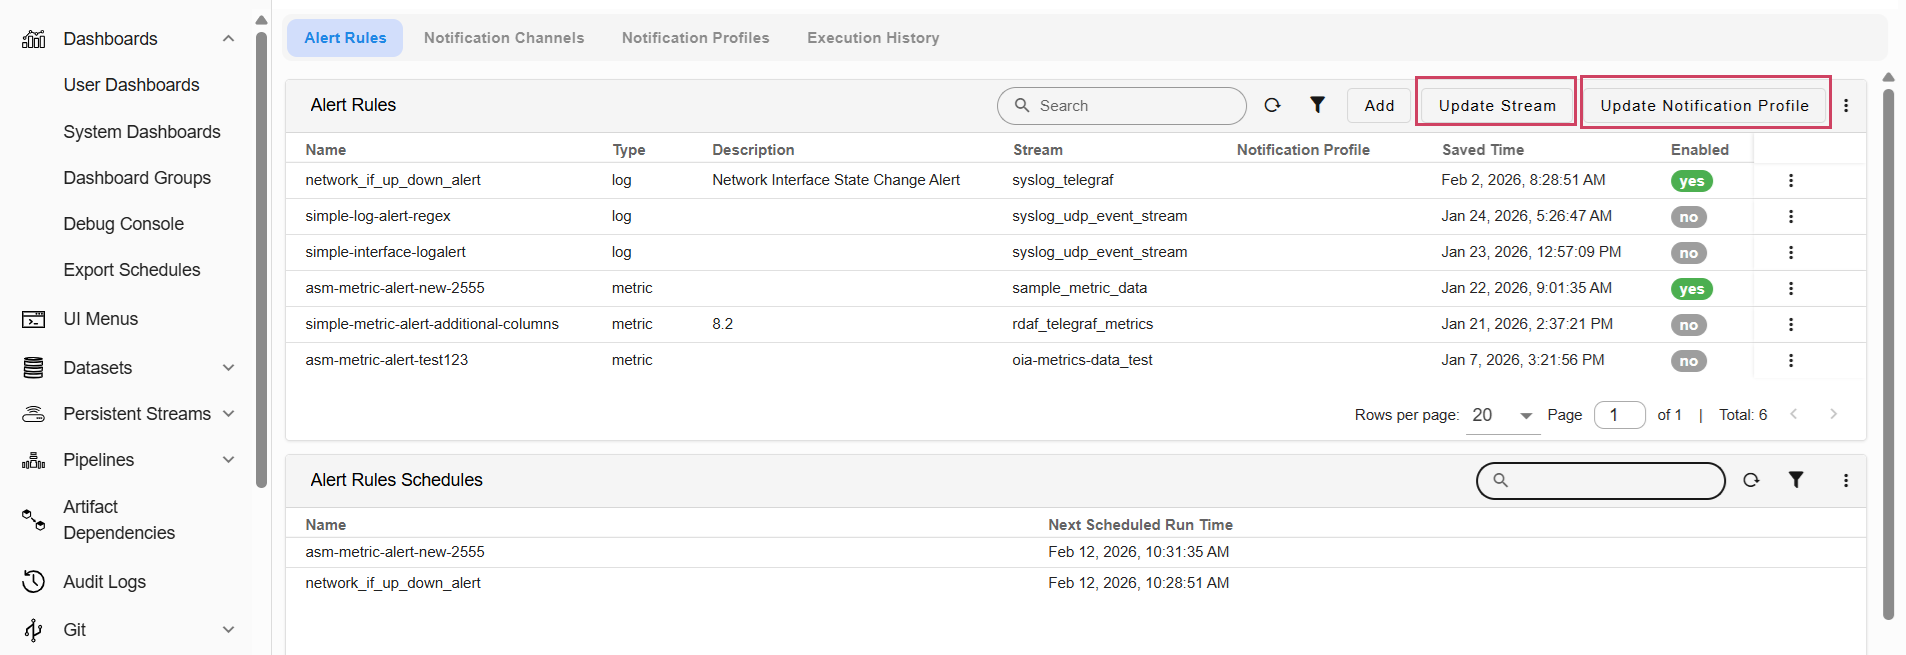
Users can now perform the following 2 actions for Alert Rules:
| Action | Description |
|---|---|
| Update Stream | Assign multiple alert rules to a single stream. |
| Update Notification Profile | Associate multiple alert rules with a specific notification profile. |
7.6 Dry Run Feature
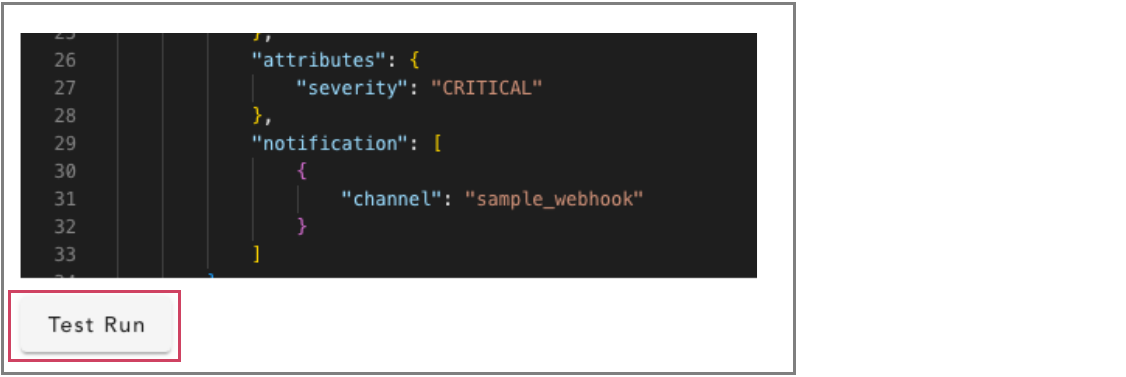
When a user adds or edits an alert rule, the Test Run action button can be used to quickly check if any metric or log type alert rules fall under the OPEN or CLEAR state. This is a basic check to test and validate the defined alert rule, with no notifications sent.
In the below screenshot user can see the Test Run Result
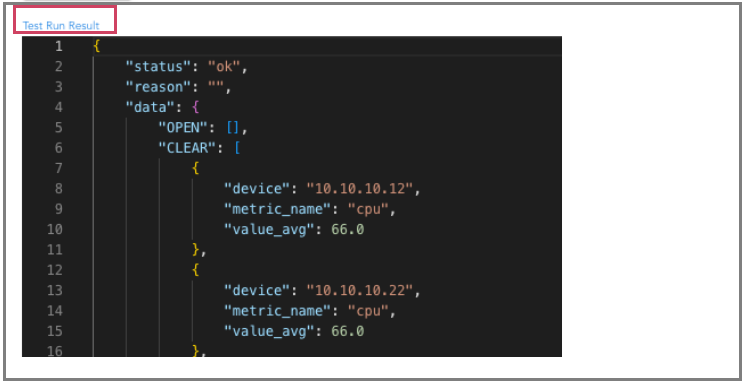
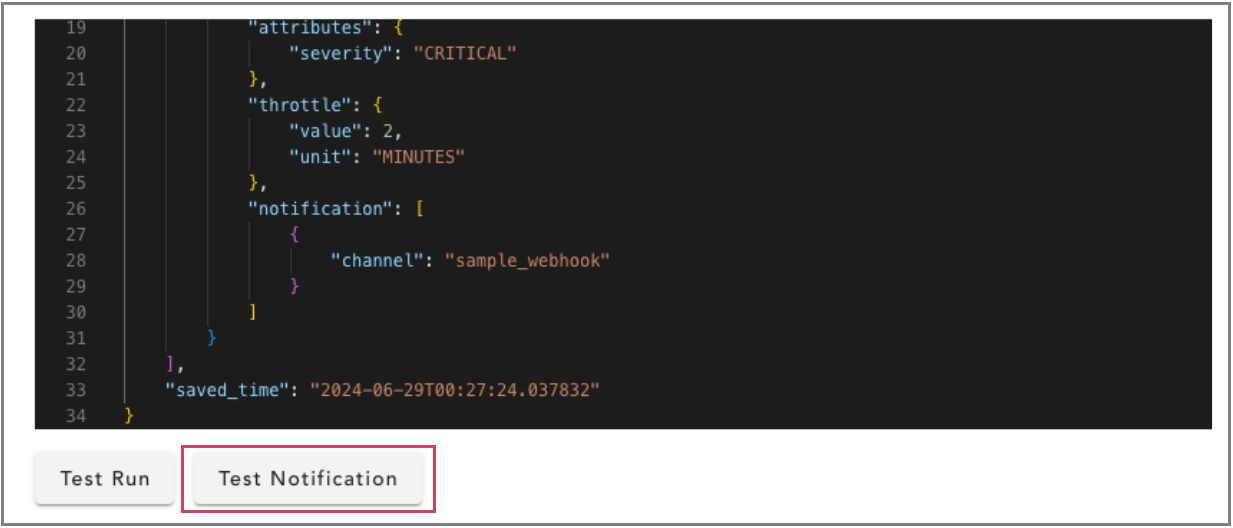

The Test Run action can be used to execute the alert rule to validate end-to-end. If the alert rule results in an OPEN or CLEAR state, the corresponding notification channels (webhooks) will receive the alert message.
{
  "alert_type": "metric",
  "alert_name": "simple-metric-alert",
  "state": "OPEN",
  "open_timestamp": "2024-05-24T16:05:01.202040",
  "last_open_notification_timestamp": "2024-05-24T16:05:01.202040",
  "data": {
    "device": "10.10.10.20",
    "metric_name": "cpu",
    "value_avg": 91
  },
  "threshold": "90",
  "attributes": {
    "severity": "CRITICAL"
  }
}
7.7 Execution Status of Alert Rules
Execution Status monitoring tracks the health and history of alert rules across both Scheduled and Manual execution types.
Each entry captures the resulting state: OPEN or CLEAR - while logging the total execution time in milliseconds. For successful runs, the system reports the specific number of records returned; conversely, any interruptions such as timeouts, authentication failures, or exceptions are captured with FAIL status and accompanied by the relevant error or exception details.
