cfxOIA: Operations Intelligence & Analytics
1. What is Operations Intelligence & Analytics
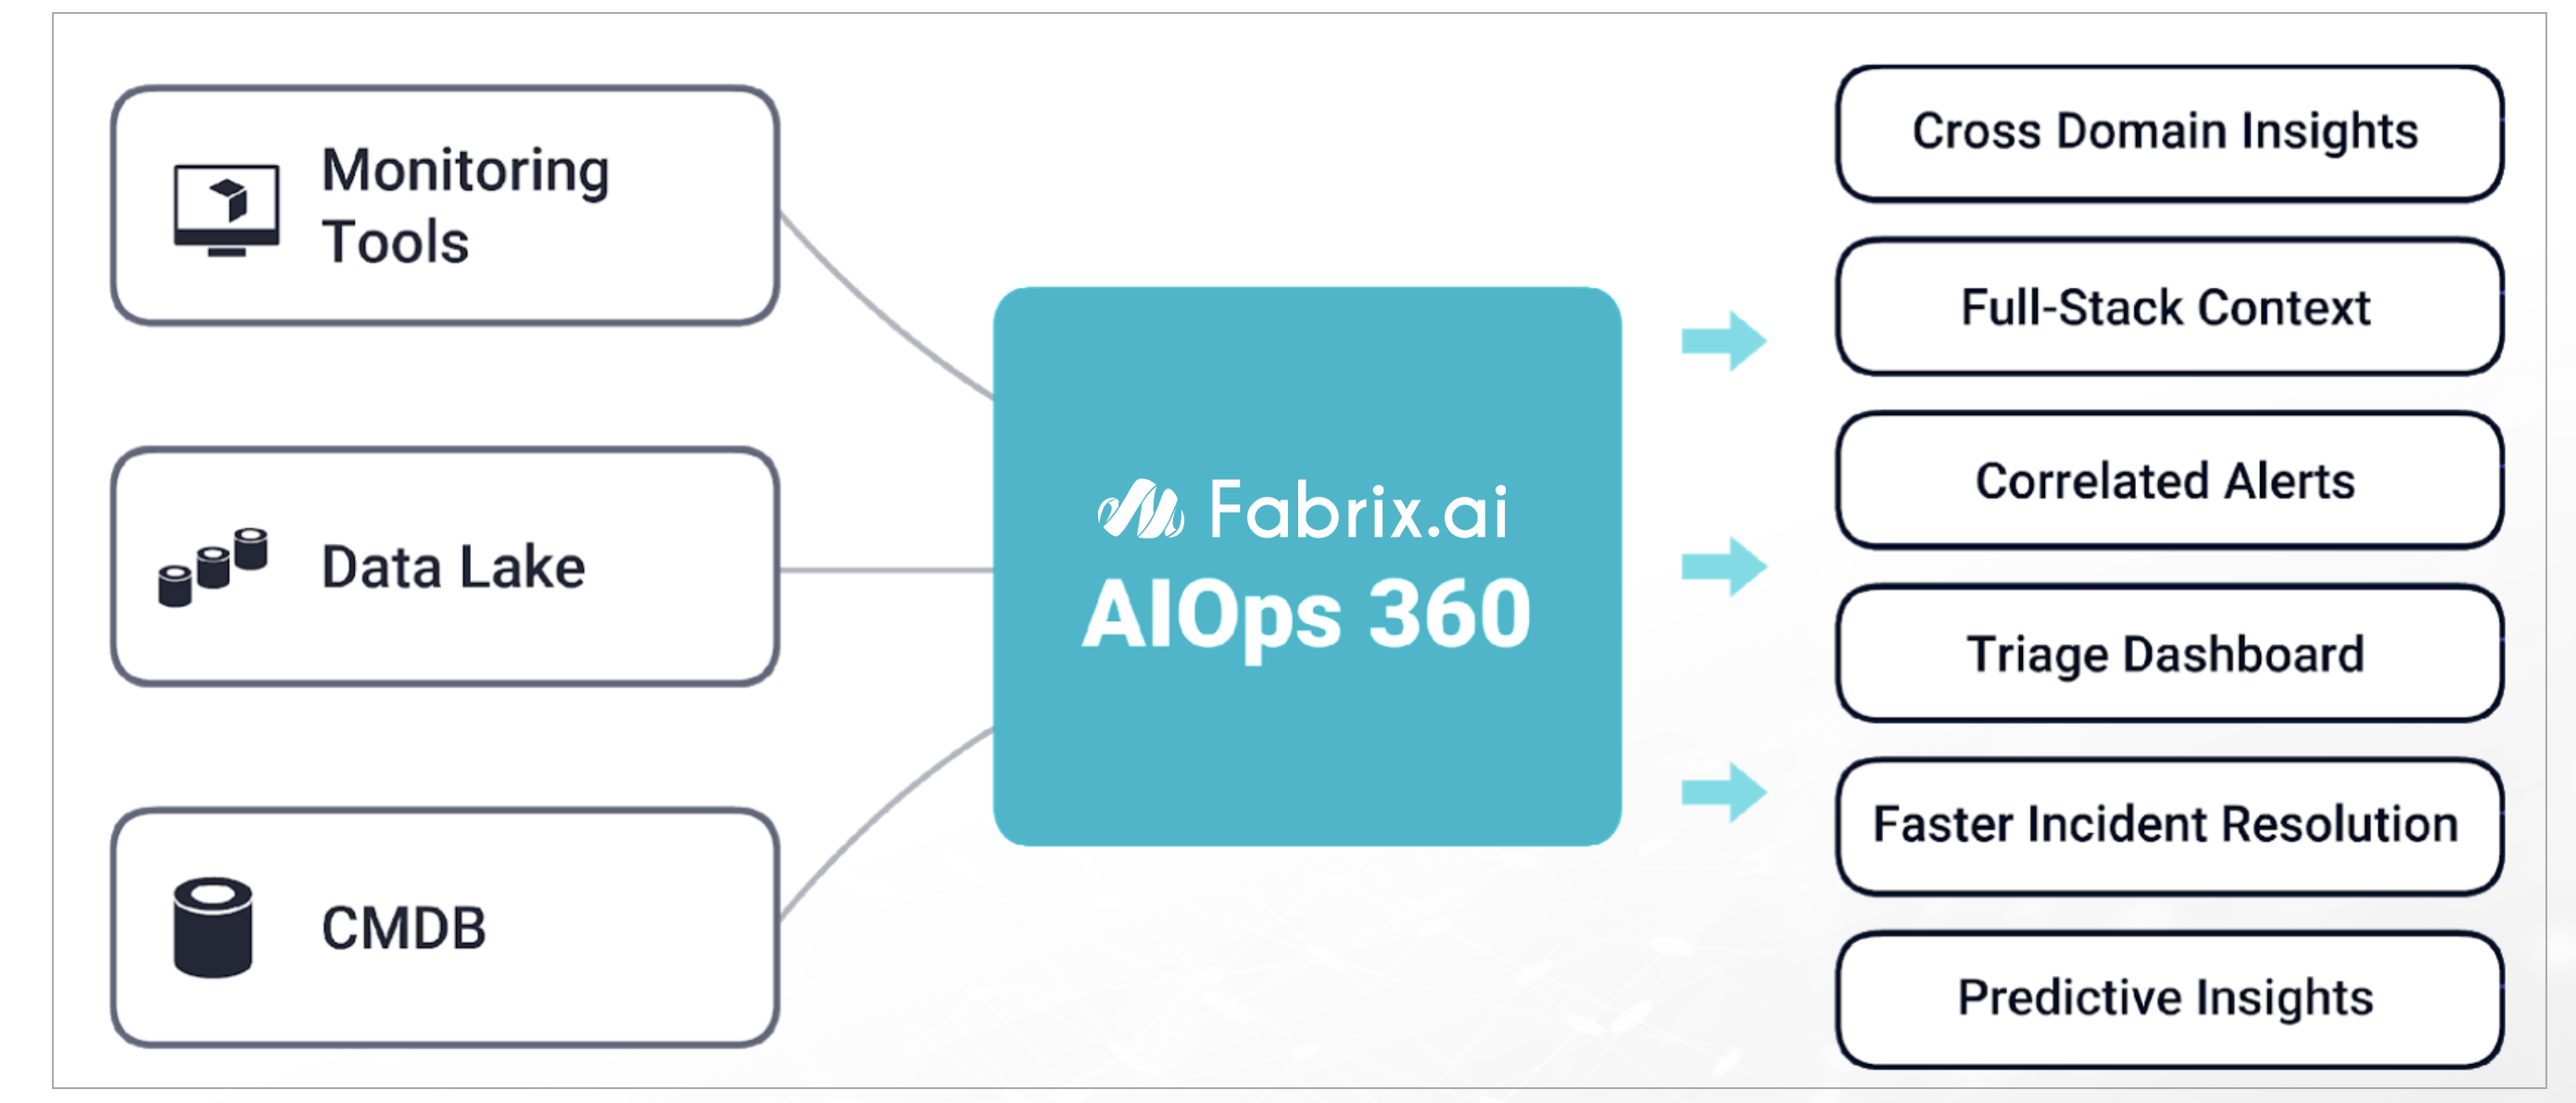
CloudFabrix AIOps solution is called as Operations Intelligence & Analytics (cfxOIA). This solution provides domain-agnostic AIOps capabilities to bring algorithmic decisions to IT operations from several disparate monitoring and other operational data sources. cfxOIA or OIA is a software solution that runs as a distributed application using microservices and containers architecture. OIA is available as an enterprise offering, for on-premise or cloud deployment. OIA is also be offered as fully managed SaaS by CloudFabrix or its partners.
2. How it works
cfxOIA works by ingesting IT operational data, like alerts, events, and traces from multiple performance monitoring tools, log-based alerts from log monitoring tools and observational data from data-lakes for performing algorithmic correlation of alerts to reduce noise. OIA normalizes every alert with enrichment data established by stitching CMDB data, service mappings, and asset management data together to derive context-rich data for every alert that is ingested into the platform.
cfxOIA then correlates alerts, based on enriched data. Identifying correlation patterns is done on OIA's machine learning engine to identify symptomatic patterns in alert data. These patterns are then provided as recommendations to AIOps administrators to consider grouping or deduplication of future alerts that match those symptoms. Admins can create additional correlation policies to tune algorithmic correlation behavior to group alerts across on the entire application stack, within a time window, or in an infrastructure layer.
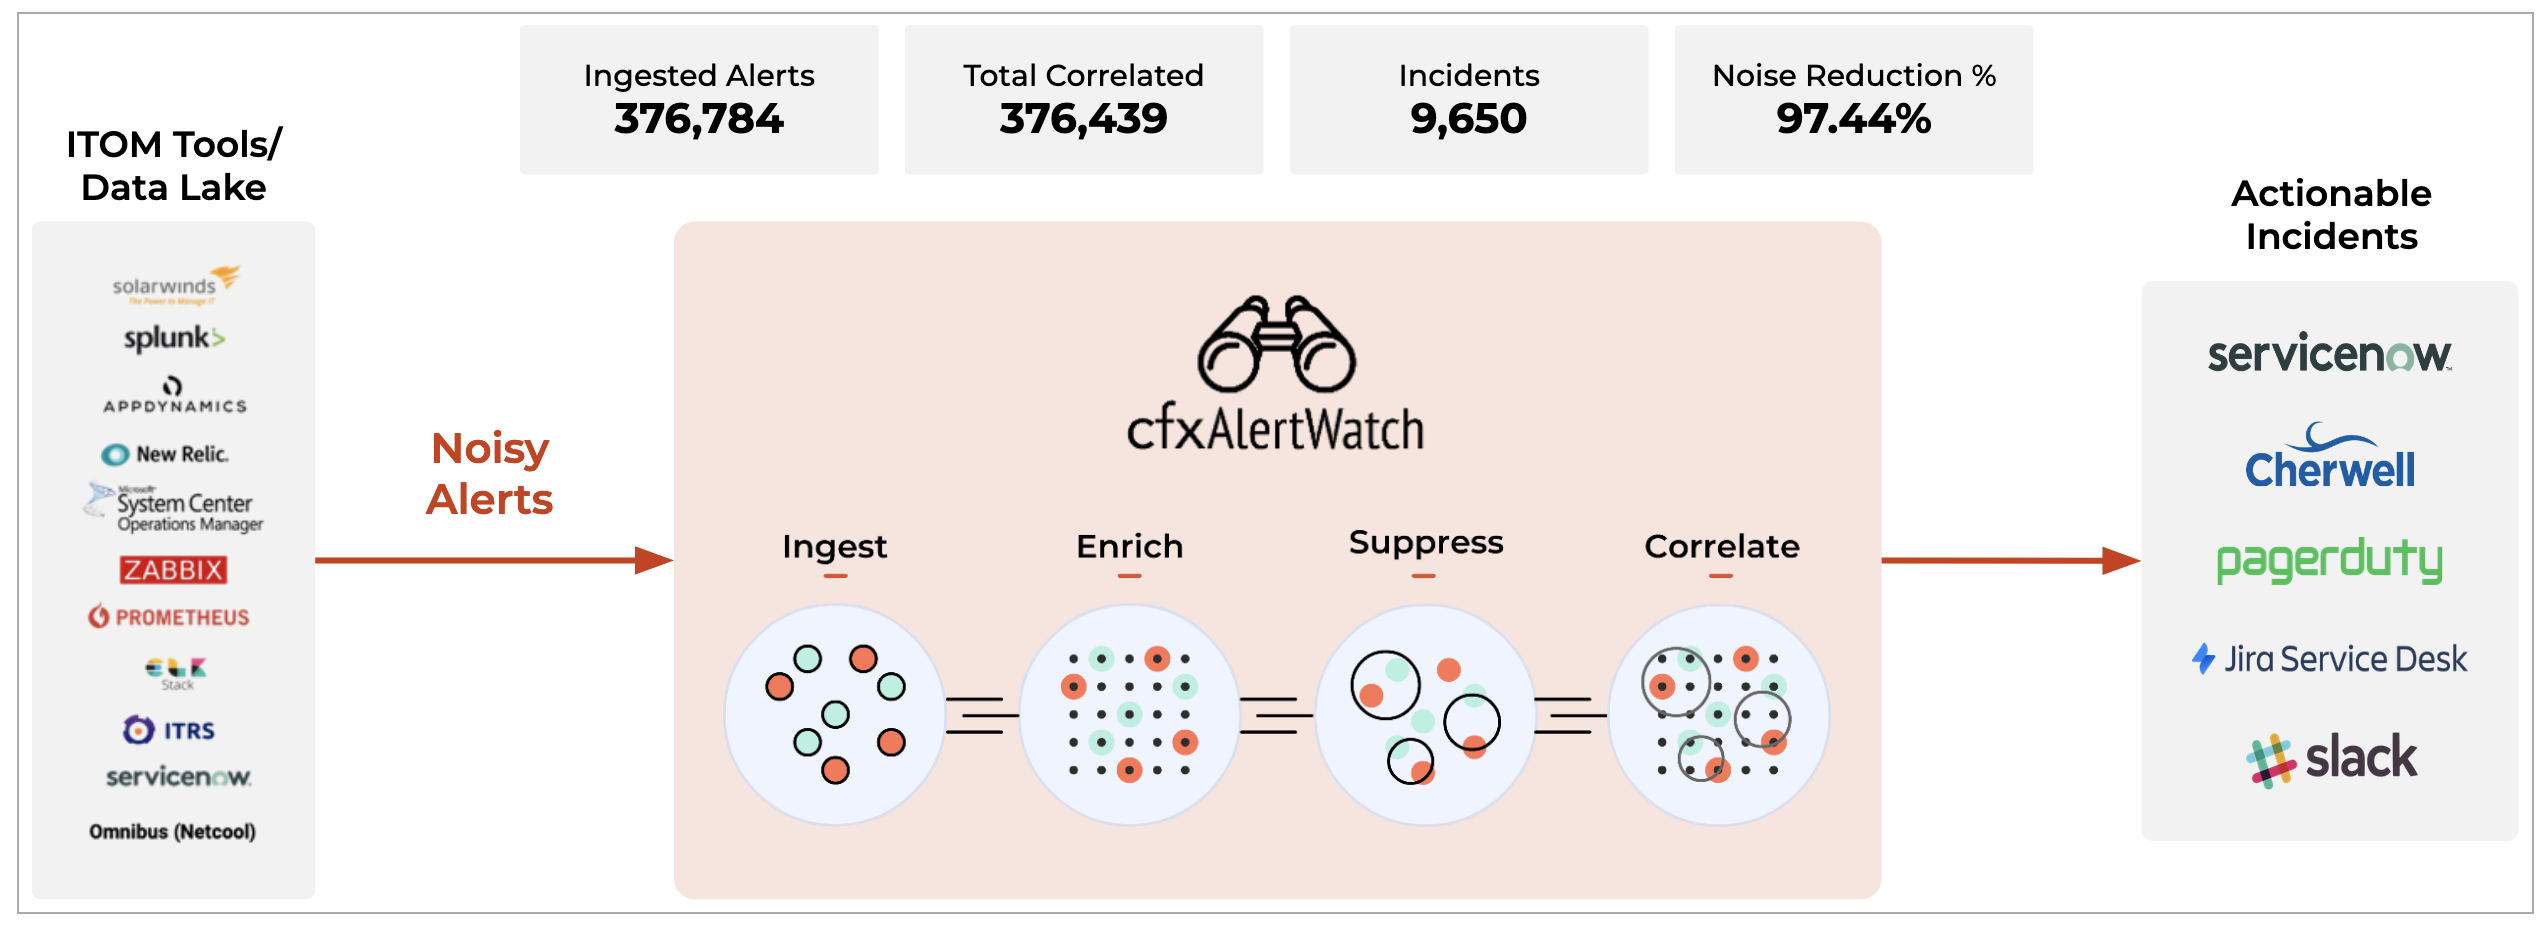
cfxOIA has an out-of-box implementation to correlate well-known operational issues related to alert burst scenarios, alert flapping situations, and transient alerts. This robust correlation engine allows the admin to implement event correlation for any type of situation, where the majority of patterns are detected with an unsupervised machine learning combined with additional flexibility for admin configurable policies to tune correlation behavior. Alerts that are correlated are called Alert Groups and the policies are called Correlation Policies.
Deduplicated and correlated alerts are grouped in an Alert Group that indicates an active operational issue or an OIA Incident. Every Alert Group has one OIA Incident, which is sent to the ITSM systems (like ServiceNow, PagerDuty, etc,.) and to OIA Incident Room for further Incident processing.
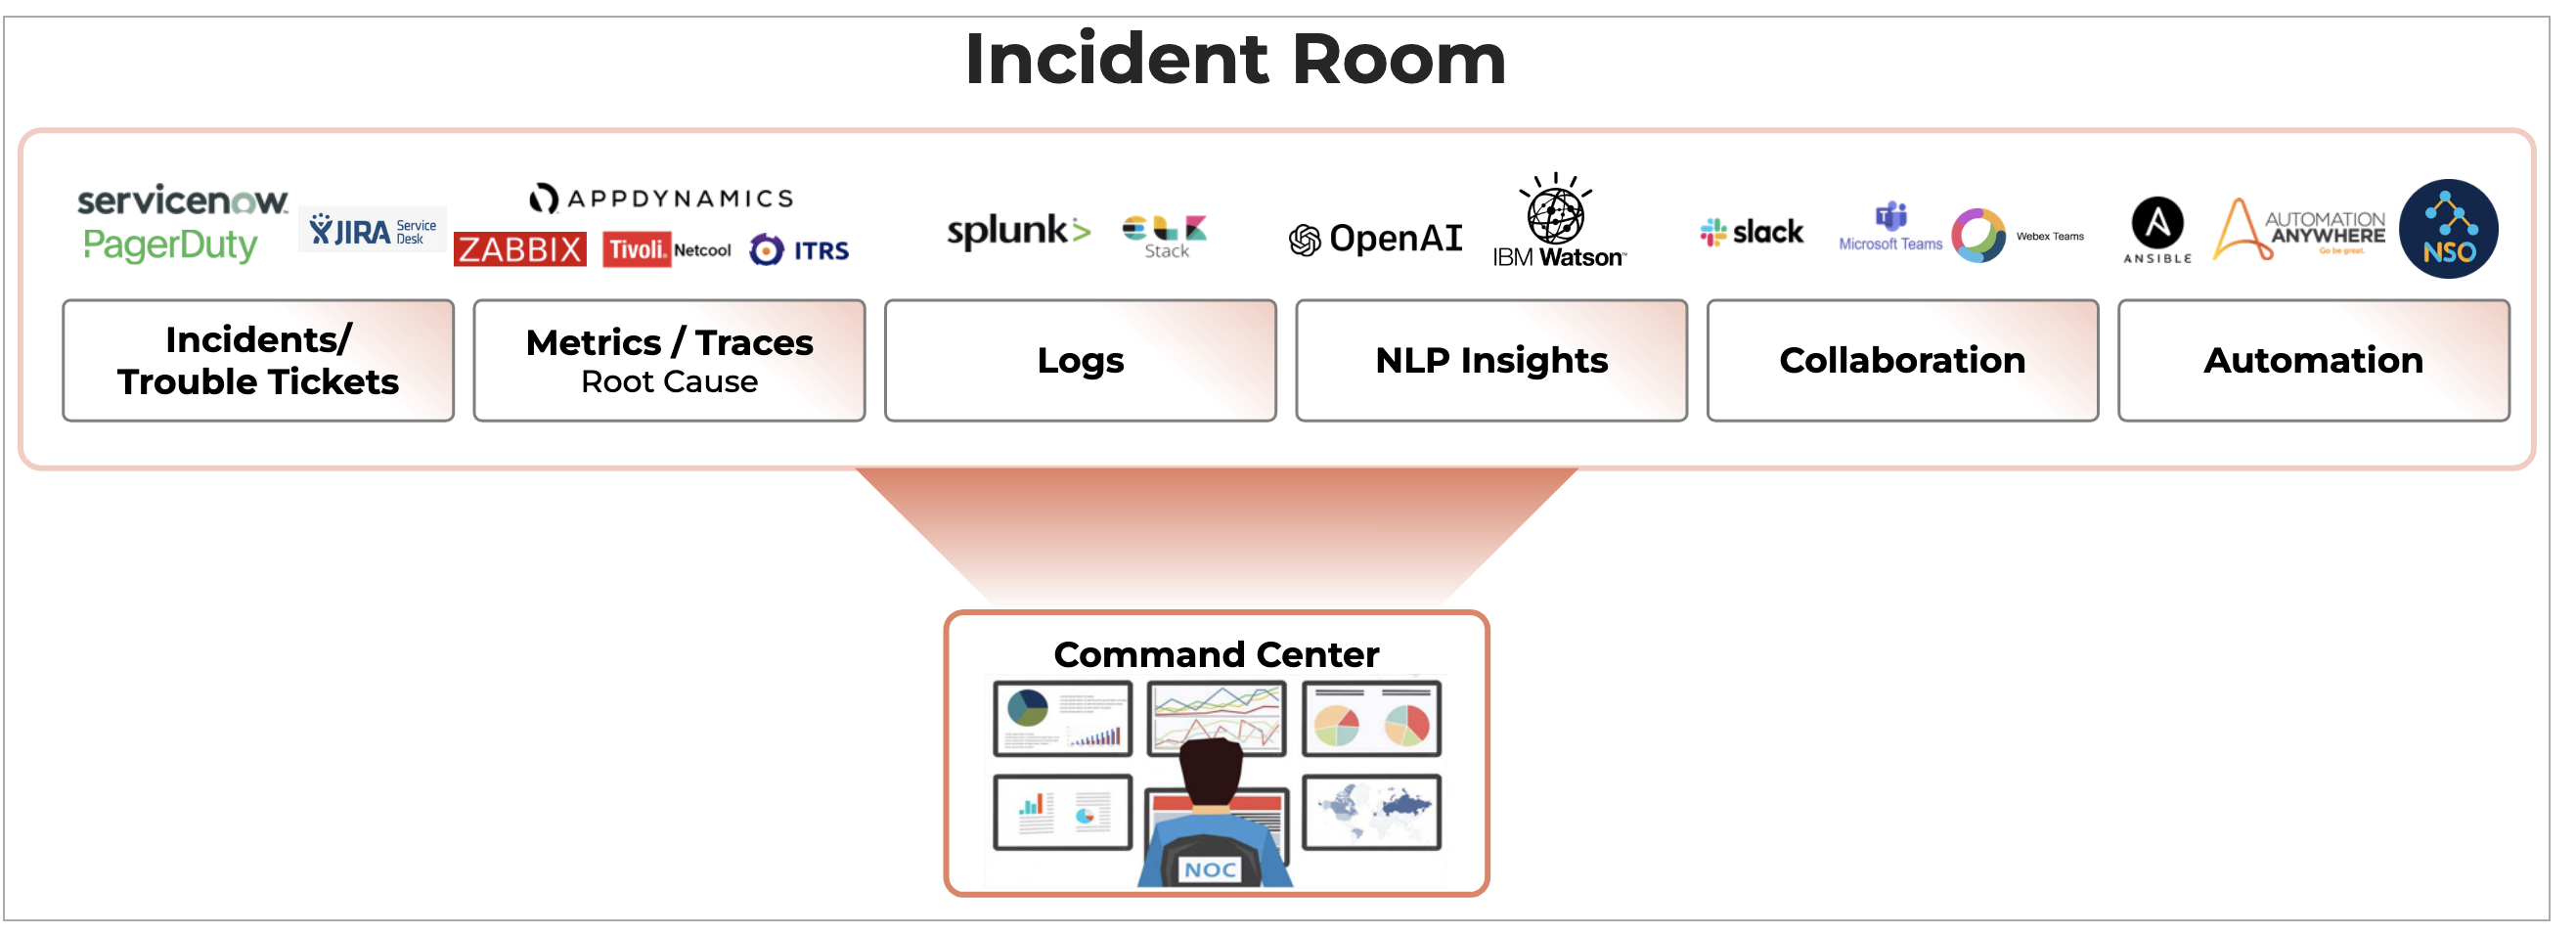
Incident Room is a dynamic and incident-centric workbench that provides all the triage data, Operational metrics, KPIs, Logs, Impacted assets context, Collaboration, and Diagnostic tools all at one place, so that operators can swiftly perform incident root cause analysis and service restoration. This helps in reducing Incident MTTR.
3. Deployment
cfxOIA is an application that is installed on top of RDA Fabric platform.
Please refer Setup, Install and Upgrade of OIA Application Services
4. Data Ingestion & Integrations
cfxOIA operates on IT operational data like alerts, events, traces, metrics, most of which are generated by monitoring tools and in some cases replicated in an aggregate data-lake. OIA supports integrations with many featured vendors using Webhooks, APIs, Kafka messages, etc. Custom integrations can be developed and supported by CloudFabrix professional services, Partners, using CloudFabrix Provided Developer SDKs.
4.1 Alert Ingestion in RDA AlertWatch Module
Tip
Some screenshots are normal some screenshots needs zooming, Please click on those screenshots below to enlarge and again to go back to the actual page please click on the back arrow button on the top left.
4.1.1 High Level Flow Diagram
The following broad steps are essentially needed to ingest and process events (alerts / incidents / messages).
1. Add a source endpoint that creates a sink for posting events from the source ex. for consuming alerts from AppDynamics; add a webhook source endpoint
2. Enable the endpoint to capture initial events. These events are not processed yet but will be recorded in event tracking. The raw event payload can be downloaded from the event tracking report.
3. Add a mapping rule to transform the raw event payload to an internal event model. Use the downloaded event payload as input to test the mapping rule and evaluate the internal event generated via the mapping.
4. Enable the endpoint to process incoming events from source
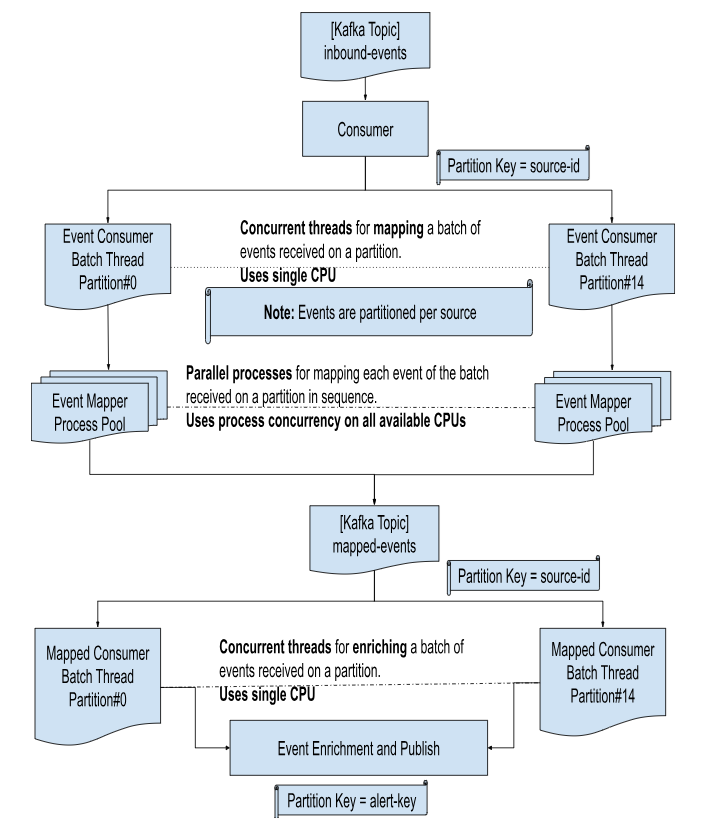
4.1.2 Event Ingestion
-
Events ingested from sources like webhooks, SMTP and various other supported consumers are published to Kafka topic inbound-events. The publisher uses the ID of the source, where the event is received; as a partition-key for the Kafka topic
-
A Kafka consumer subscribes for receiving events published on topic inbound-events in batches of maximum count of 500 within a maximum batch interval of 5 seconds
-
A batch of inbound events per partition is processed in a concurrent thread
-
The batch of events is sent to parallel mapper process-pool that is forked for that partition
-
The results of mapping are collected sequentially, thereby retaining the order of events; and published to Kafka topic mapped-events. The publisher again uses the ID of the source, where the event is received; as a partition-key for the Kafka topic
-
A Kafka consumer subscribes for receiving events published on topic mapped-events in batches of a maximum count of 1000 within a maximum batch interval of 5 seconds
-
A batch of mapped events per partition is enriched in a concurrent thread
-
The batch is enriched using the configured ingestion pipeline
-
A batch of mapped events is first converted into multiple contiguous batches that use the same pipeline. So if a batch has say 5 events for pipeline-A, followed by 2 events of pipeline-B and followed by 5 events of pipeline-A again, then the contiguous batches will be as shown below
-
This batching mechanism ensures that the sequence of events is maintained during bulk actions. Each batch is then executed against its configured pipeline to run the enrichment steps.
-
The batch execution of events against each pipeline step, maximizes the usage of resources. Also reduces the time taken for events to go through the pipeline steps.
-
Each step of the pipeline, tracked as part of event trail; receives the batch as input and enriches each event in the batch with enriched attributes
-
The batch of enriched events (alerts/incidents/messages) is published for alert or incident processing
4.1.3 Source Event Endpoint
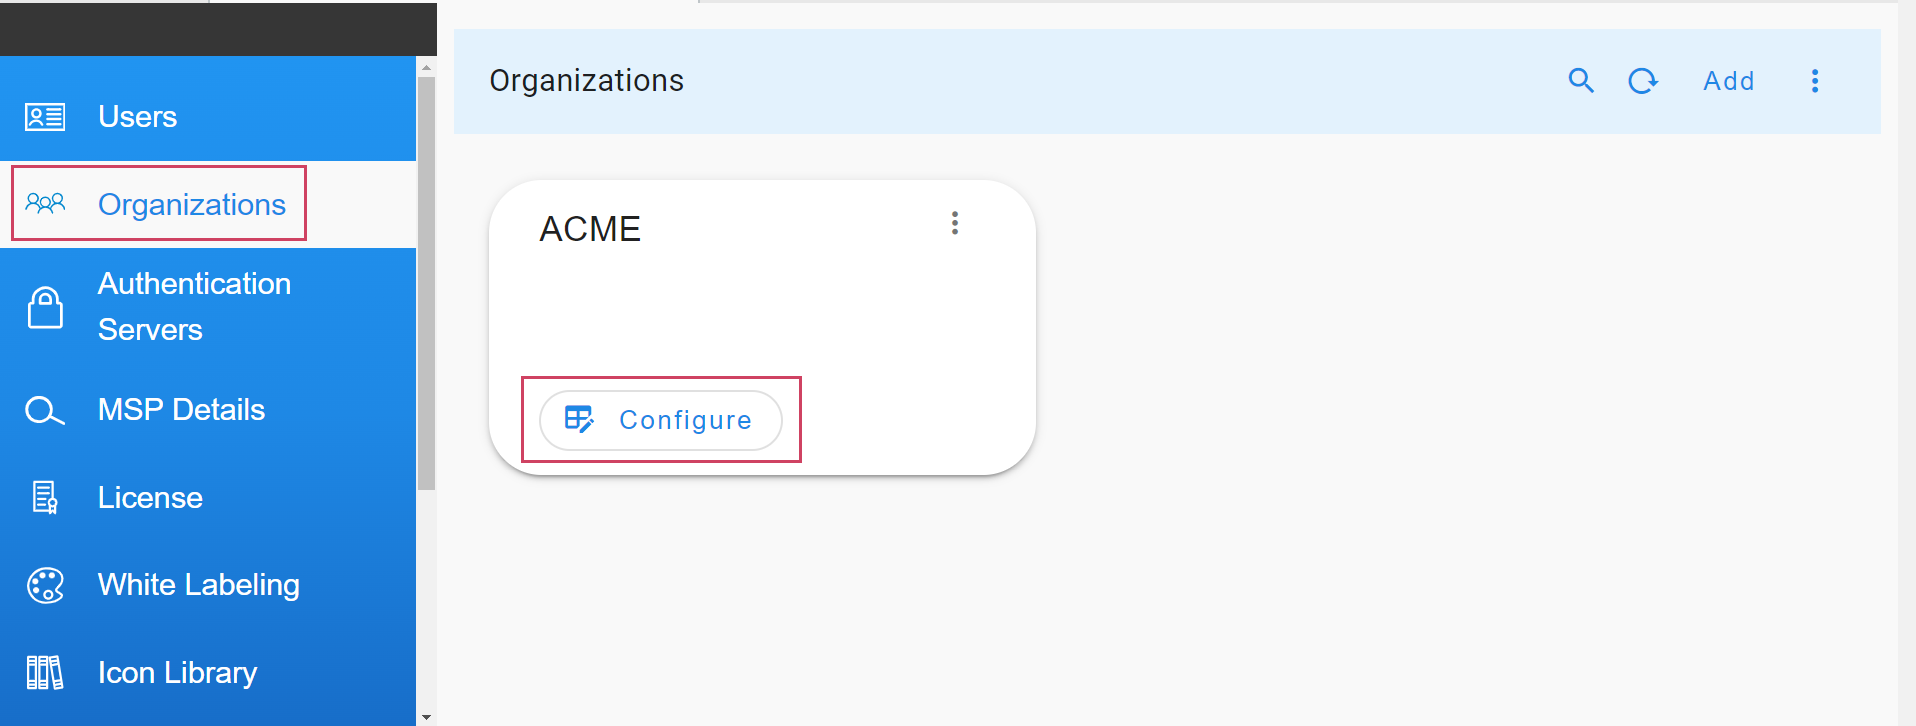
For ingesting events from a source, we need to add a Source endpoint.
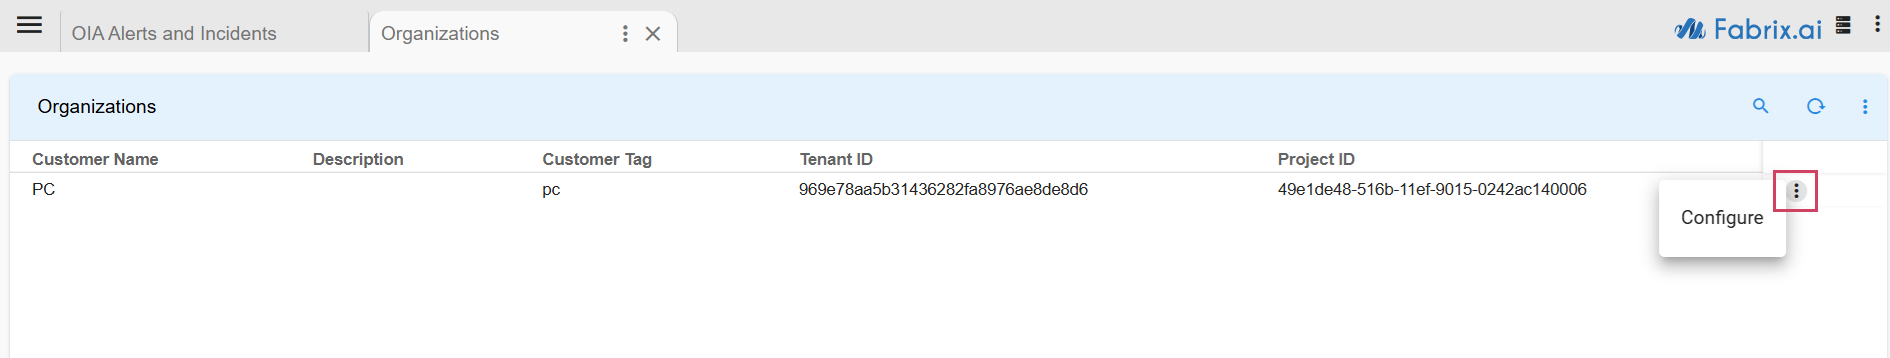
Go to Home --> Administration --> Organizations --> Configure --> ALERT ENDPOINTS --> Click Add -->
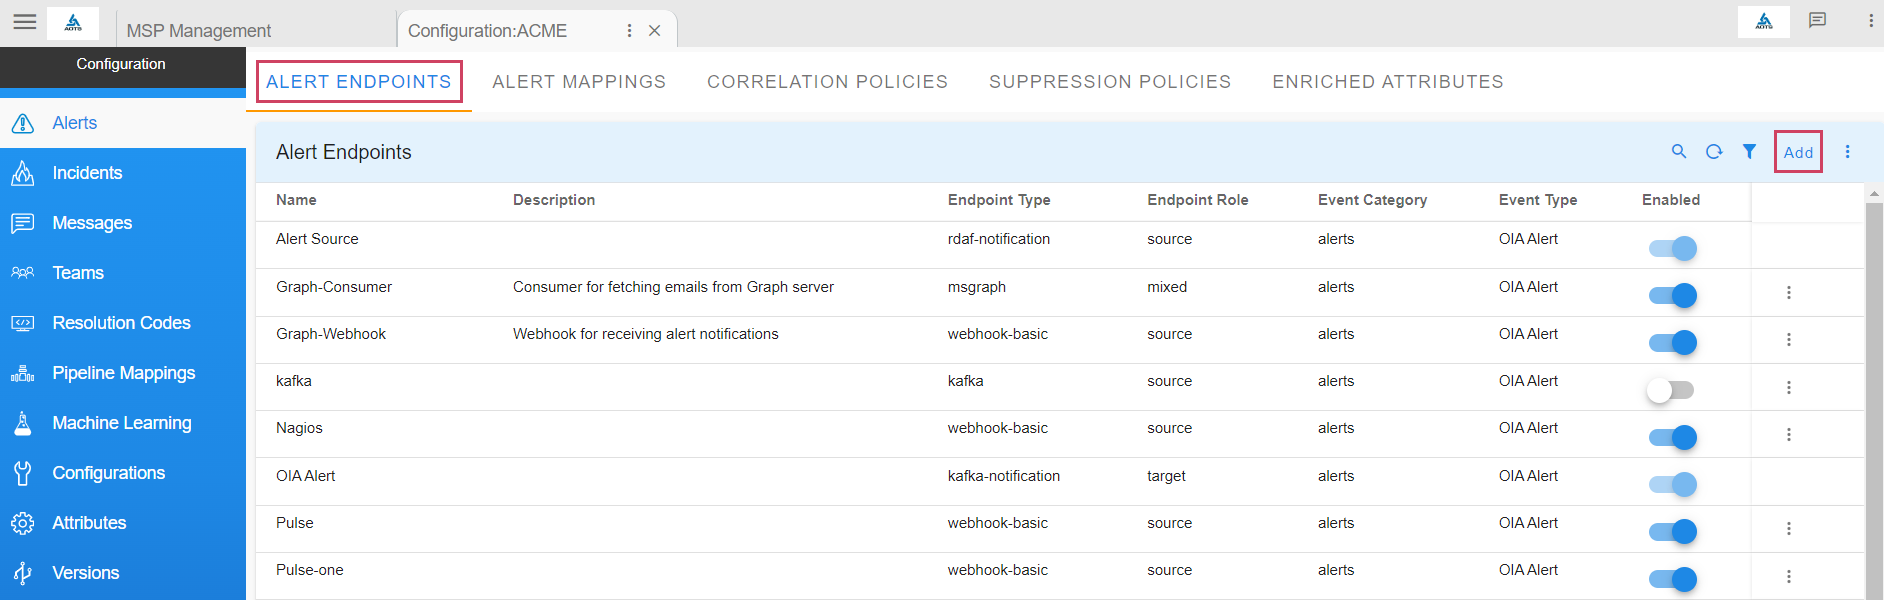
- Navigate to the appropriate section based on the type of the incoming event - alert or incident or message.
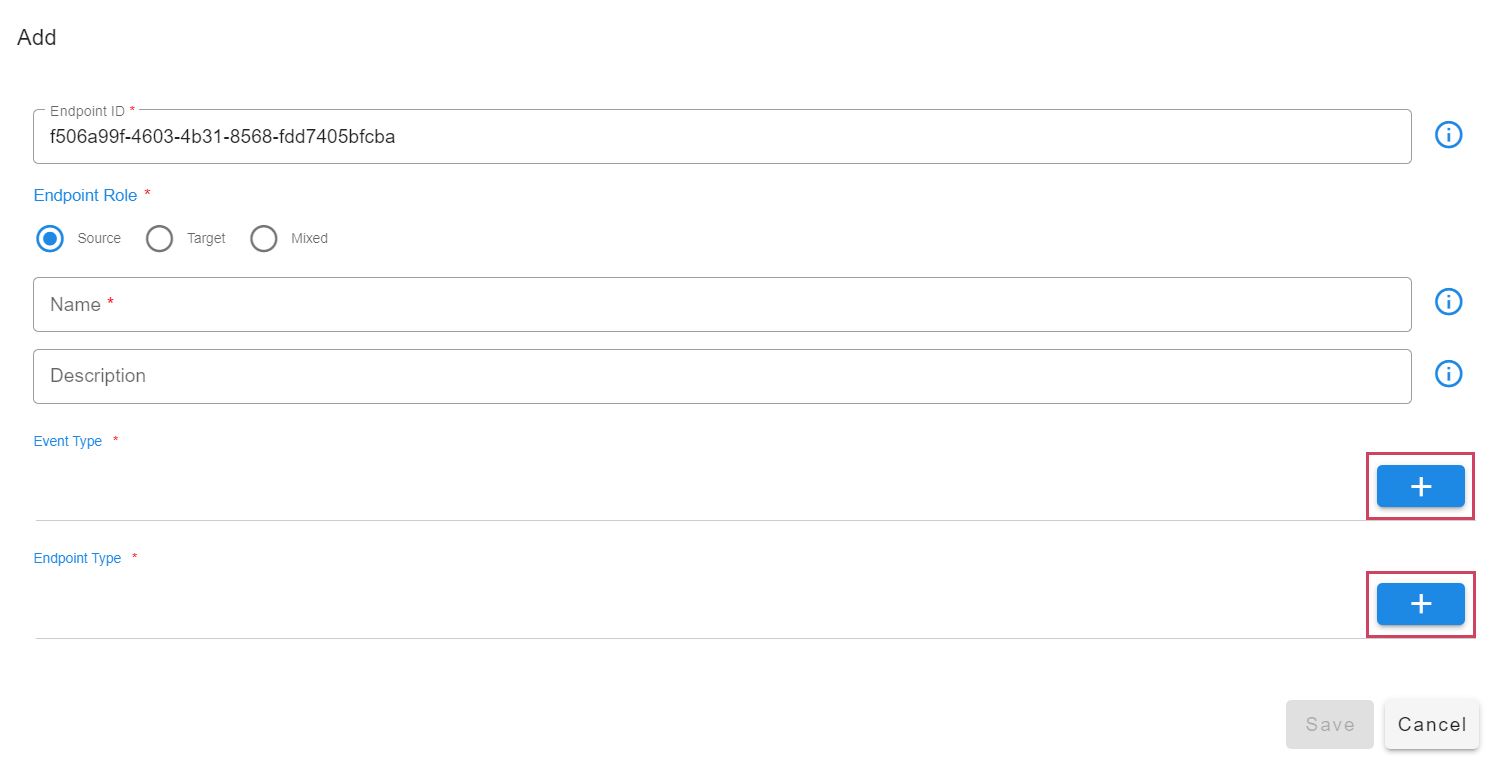
- Add an endpoint and pick the appropriate type for the endpoint. For instance choose Webhook HTTP Service for creating an HTTP endpoint where events can be posted.
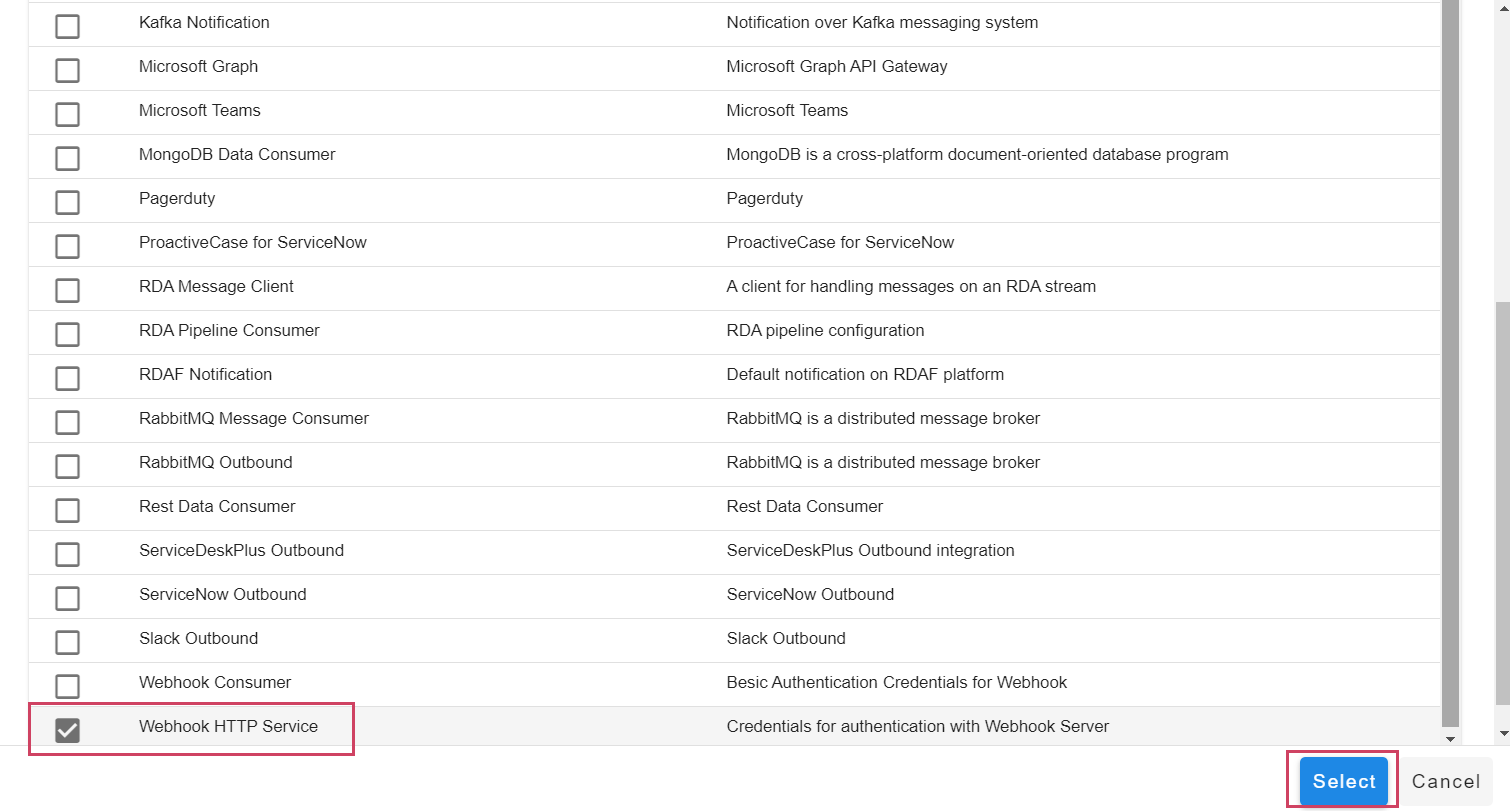
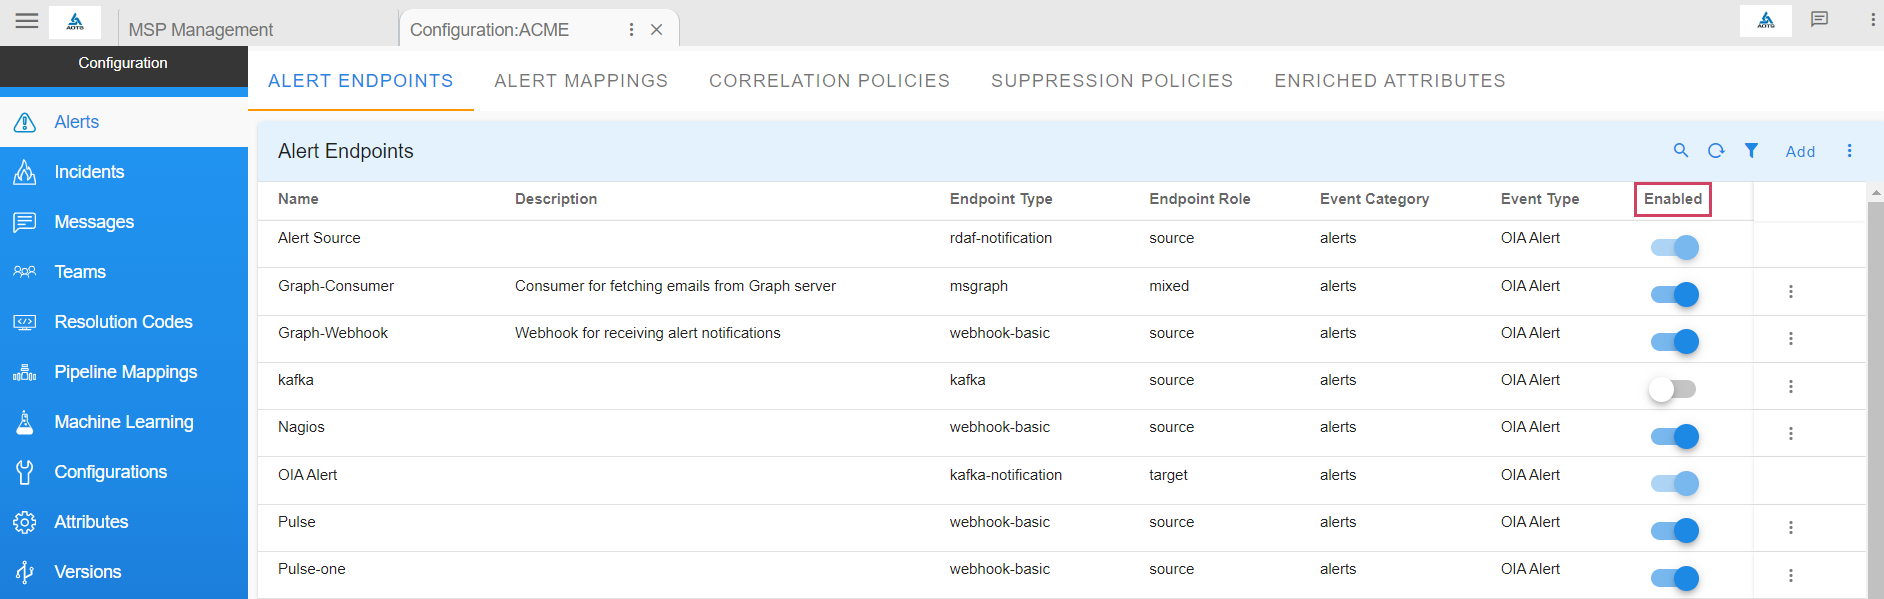
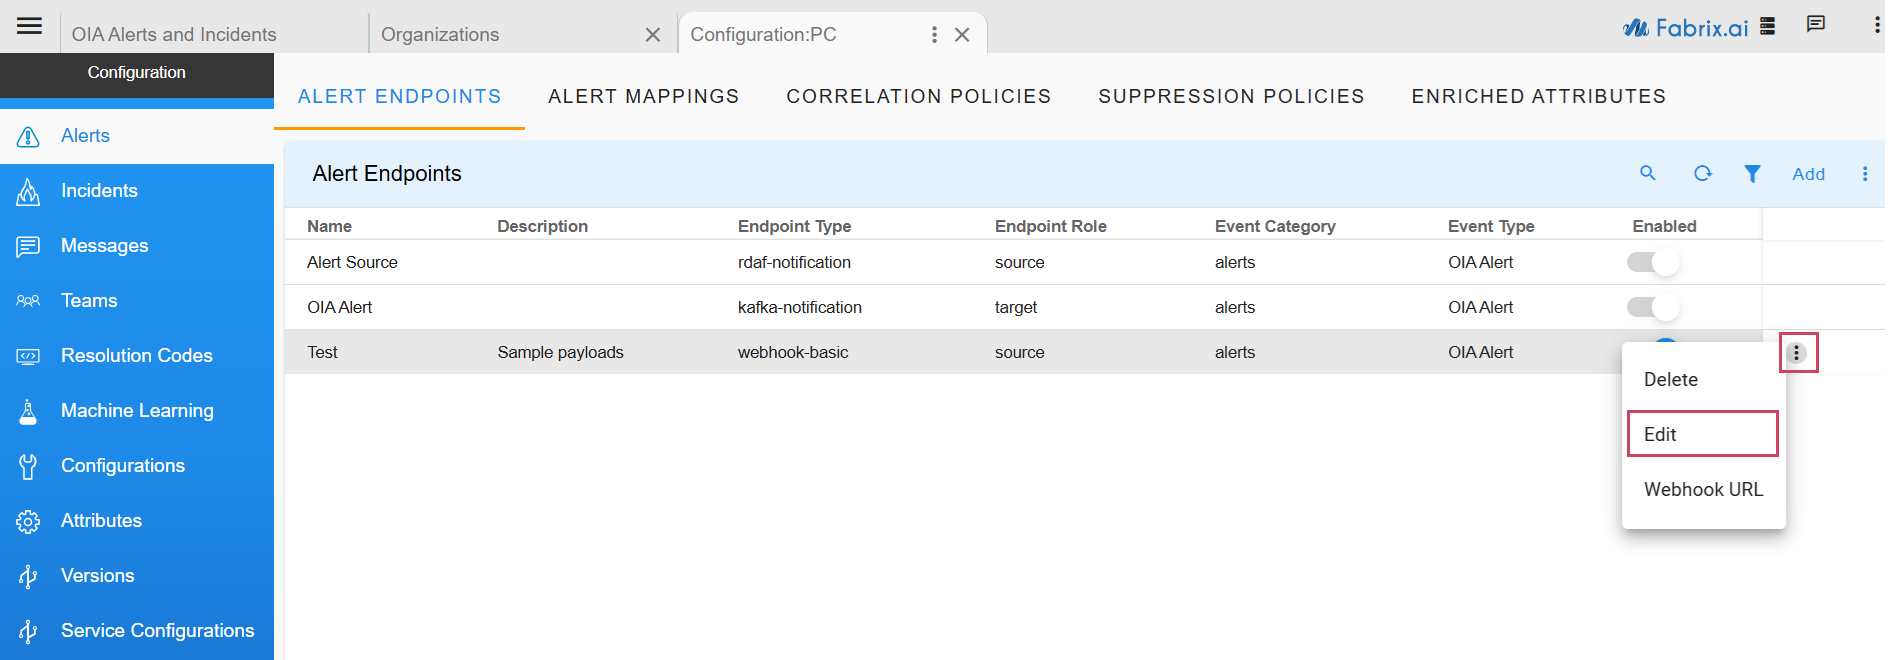
- After the endpoint is added, just as shown in the below screenshot, use the toggle switch under Enabled this will enable the endpoint to start ingesting alerts into the system.
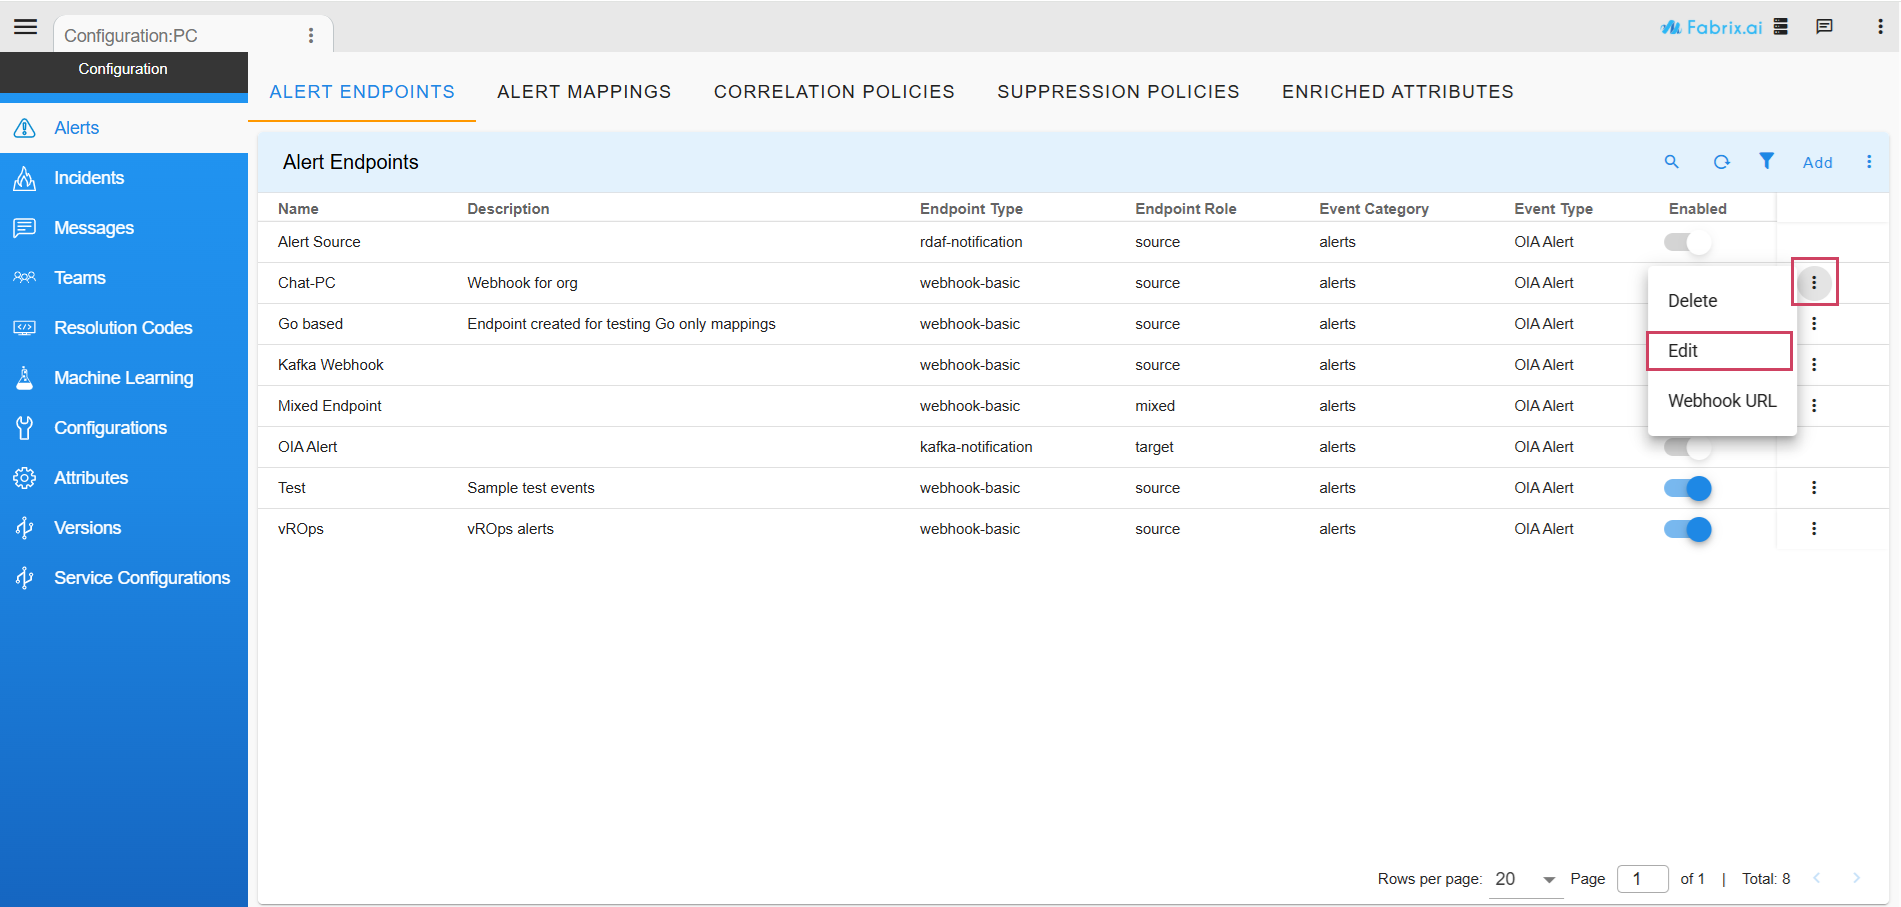
- To manage an existing endpoint, click the three-dot menu ( ⋮ ) next to the endpoint.
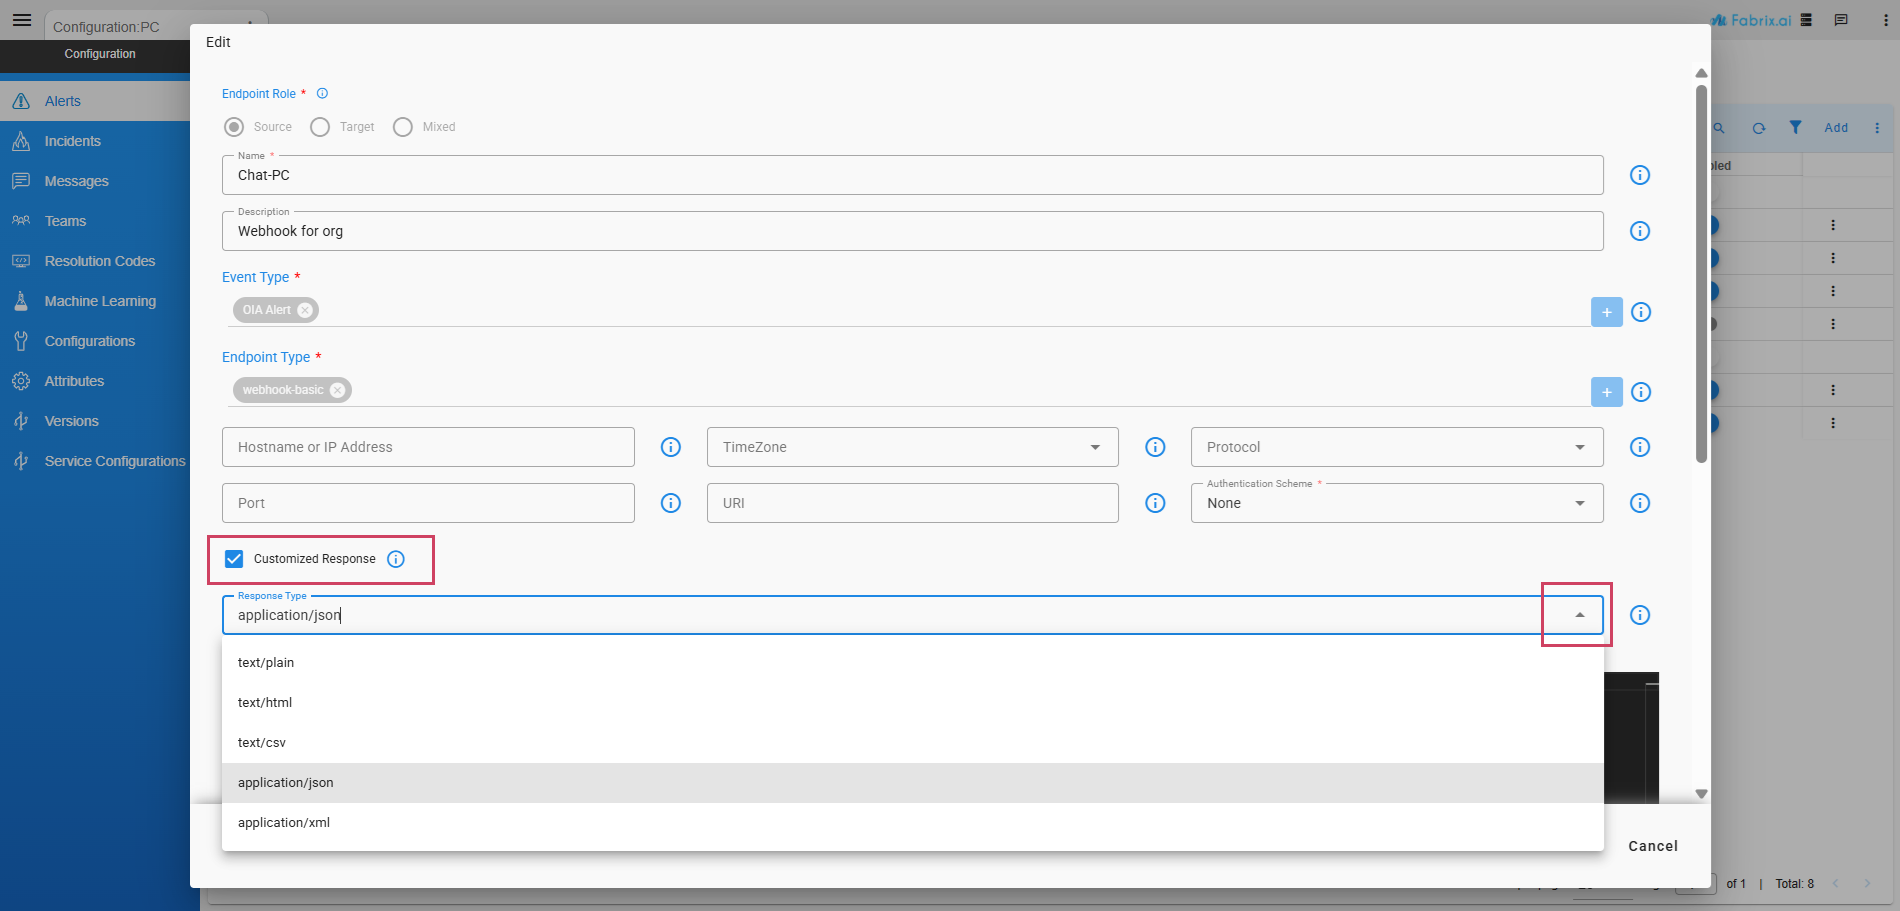
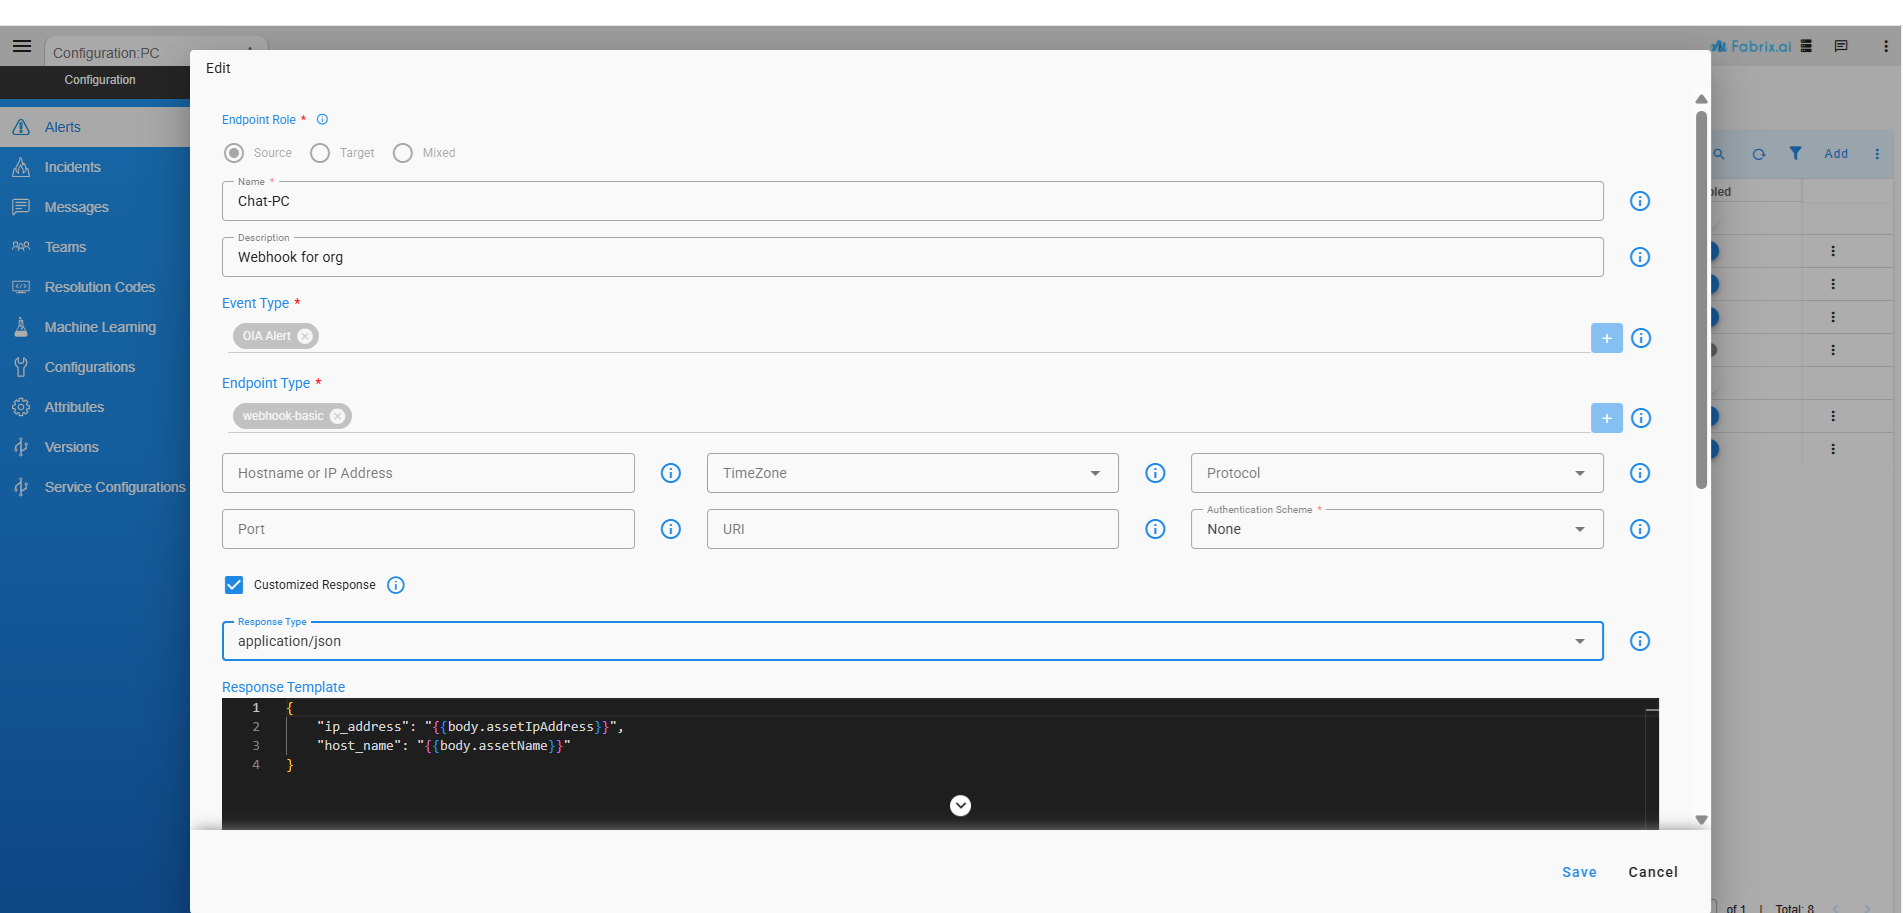
To reply with a custom response for an event received on the webhook, enable the Customized Response option. Once enabled, a Response Type dropdown appears, allowing you to select the mime-type for the response. The following mime-type are supported:
text/plaintext/htmltext/csvapplication/jsonapplication/xml
If no mime-type is selected, text/plain will be used as the default response type.
Once Customized Response is enabled, a Response Template text area appears, which accepts Jinja template format. Placeholders can be defined within the template using Jinja tags, and the response content should ideally match the selected Response Type mime-type.
The following two variables are supported within Jinja tags:
request— Used to access header fields from the incoming request.body— Used to extract JSON elements from the request body. This variable is only supported for requests withapplication/jsoncontent type.
The request variable can be used in scenarios such as validating an MS-Graph webhook, where the server sends a validation token as a query parameter in the request and expects the same token to be returned as a plain text response. This handshake mechanism is used by MS-Graph to confirm the webhook endpoint is active and legitimate before it starts delivering email alerts. In such cases, the Response Template can be configured to extract the validation token from the incoming request's query parameters and return it as the response.
The following example demonstrates the use of the body variable to extract specific elements from an incoming JSON request body.
4.1.4 Source Endpoint Partition Assignment
A source of raw events can be optionally assigned a partition identifier to ensure better load distribution and management for optimized alert processing. The partition identifier is a positive integer between 0 and 14.
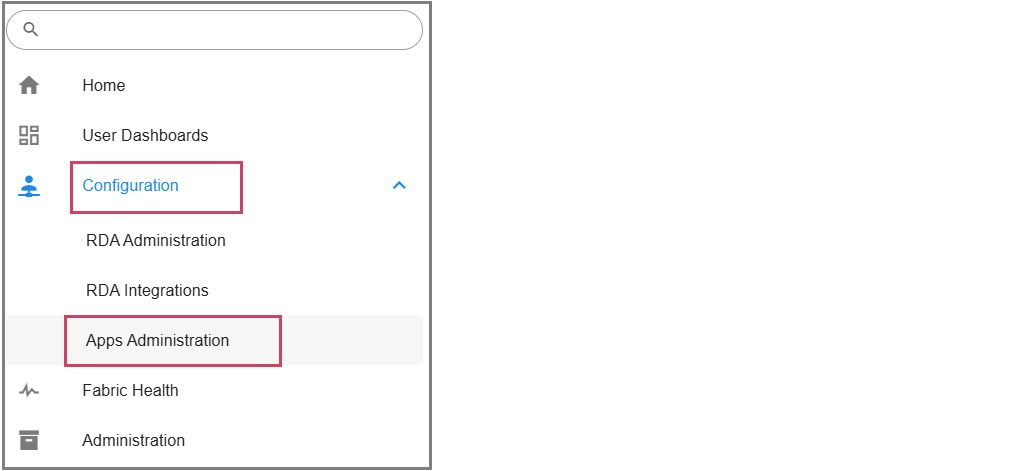
Navigation Path: Home Menu -> Configuration -> Apps Administration -> Configure -> Edit (Please find the path below in screenshots)
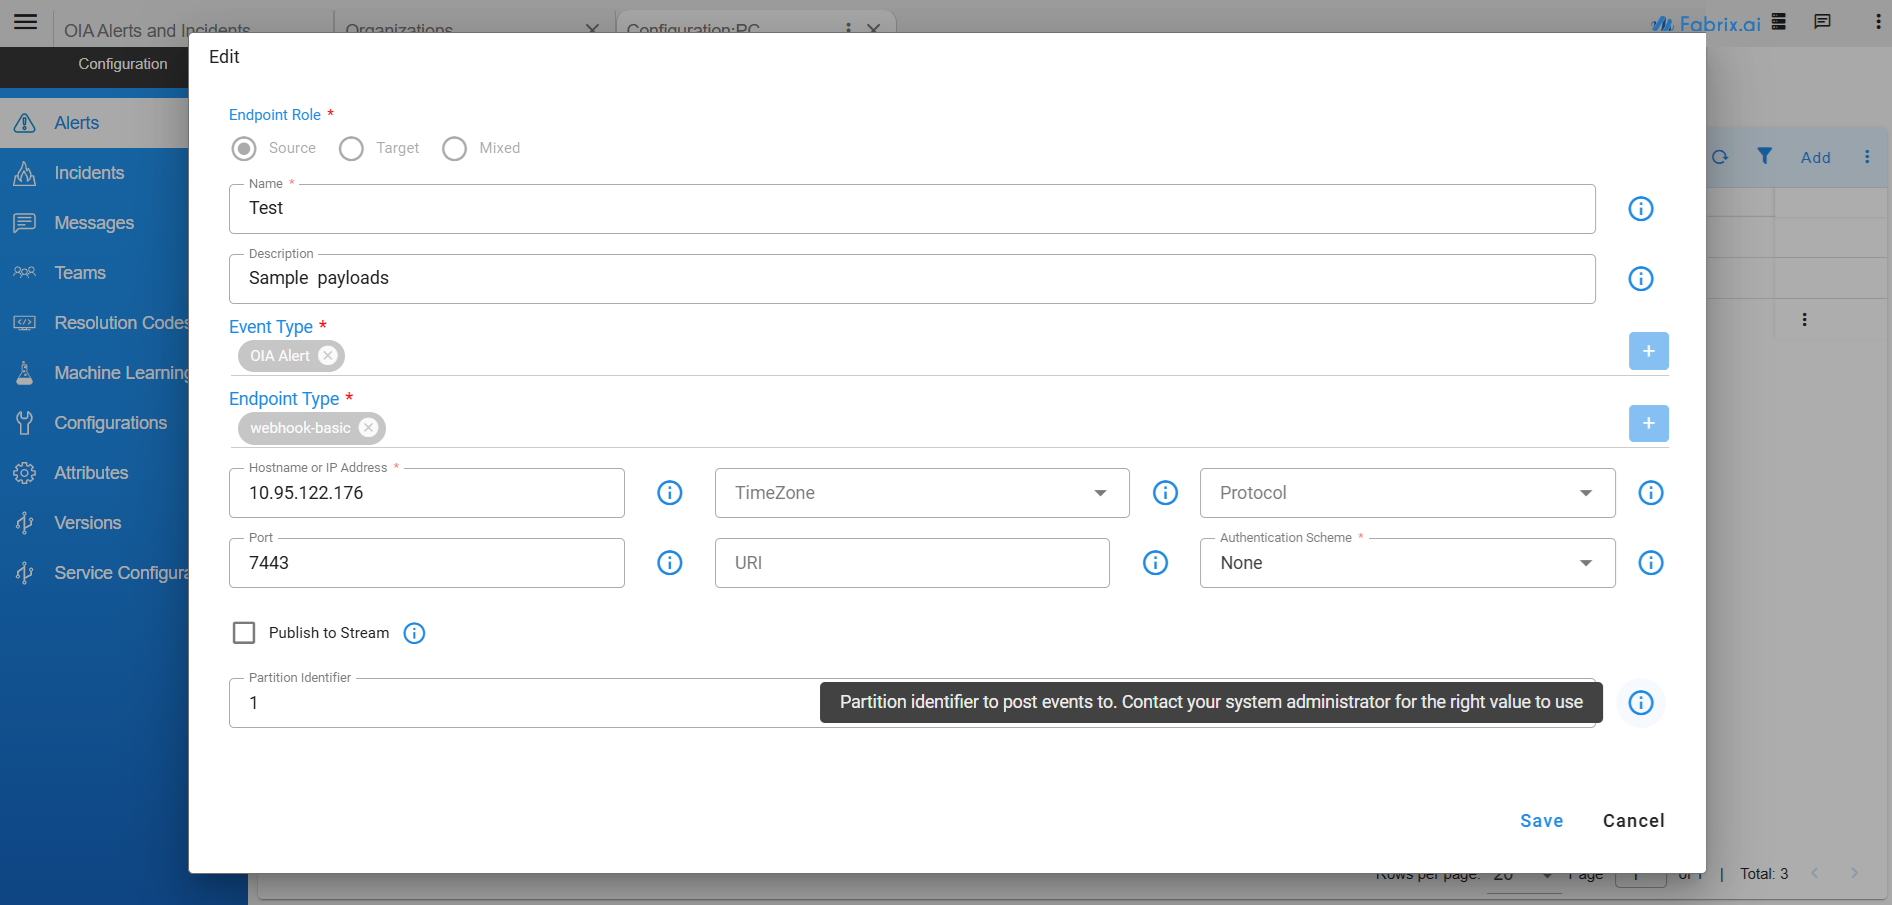
When assigned a partition, the events from that source will be published on that partition; and not a randomly assigned partition ID. Partition assignment can be used effectively to distribute the processing of the incoming load from bursty or noisy sources to a specific instance with dedicated CPU for processing. Consider the following example
4.1.4.1 Endpoint Sources
1) Metrics - very noisy (for instance Prometheus with typical incoming rate of xxx/minute)
2) Email alerts - moderate (for instance MS-Graph with typical incoming rate of xx/minute)
3) vROps alerts - low (typical incoming rate of x/minute)
Partitions assigned to each node in a 2 node service cluster using Round Robin Strategy
1) node#1 - [0, 2, 4, 6, 8, 10, 12, 14]
2) node#2 - [1, 3, 5, 7, 9, 11, 13]
Note
Each node is running on a Separate VM
Endpoint partitions based on the incoming rate of events
| Endpoint | Partition Number | Node Number |
|---|---|---|
| Metrics | 0 | 1 |
| 1 | 2 | |
| vROps | 3 | 2 |
In the above example, the noisy or bursty sources (Metrics) are assigned to an instance (node#1) that is not processing events from other sources so as to ensure that events from moderate or low rate sources are not compromised due to the processing overhead from a single noisy source.
Similarly, the partition distribution on each node in a 3-node cluster is
1) node#1 - [0, 3, 6, 9, 12]
2) node#2 - [1, 4, 7, 10, 13]
3) node#3 - [2, 5, 8, 11, 14]
The endpoint sources can be accordingly assigned to appropriate partitions.
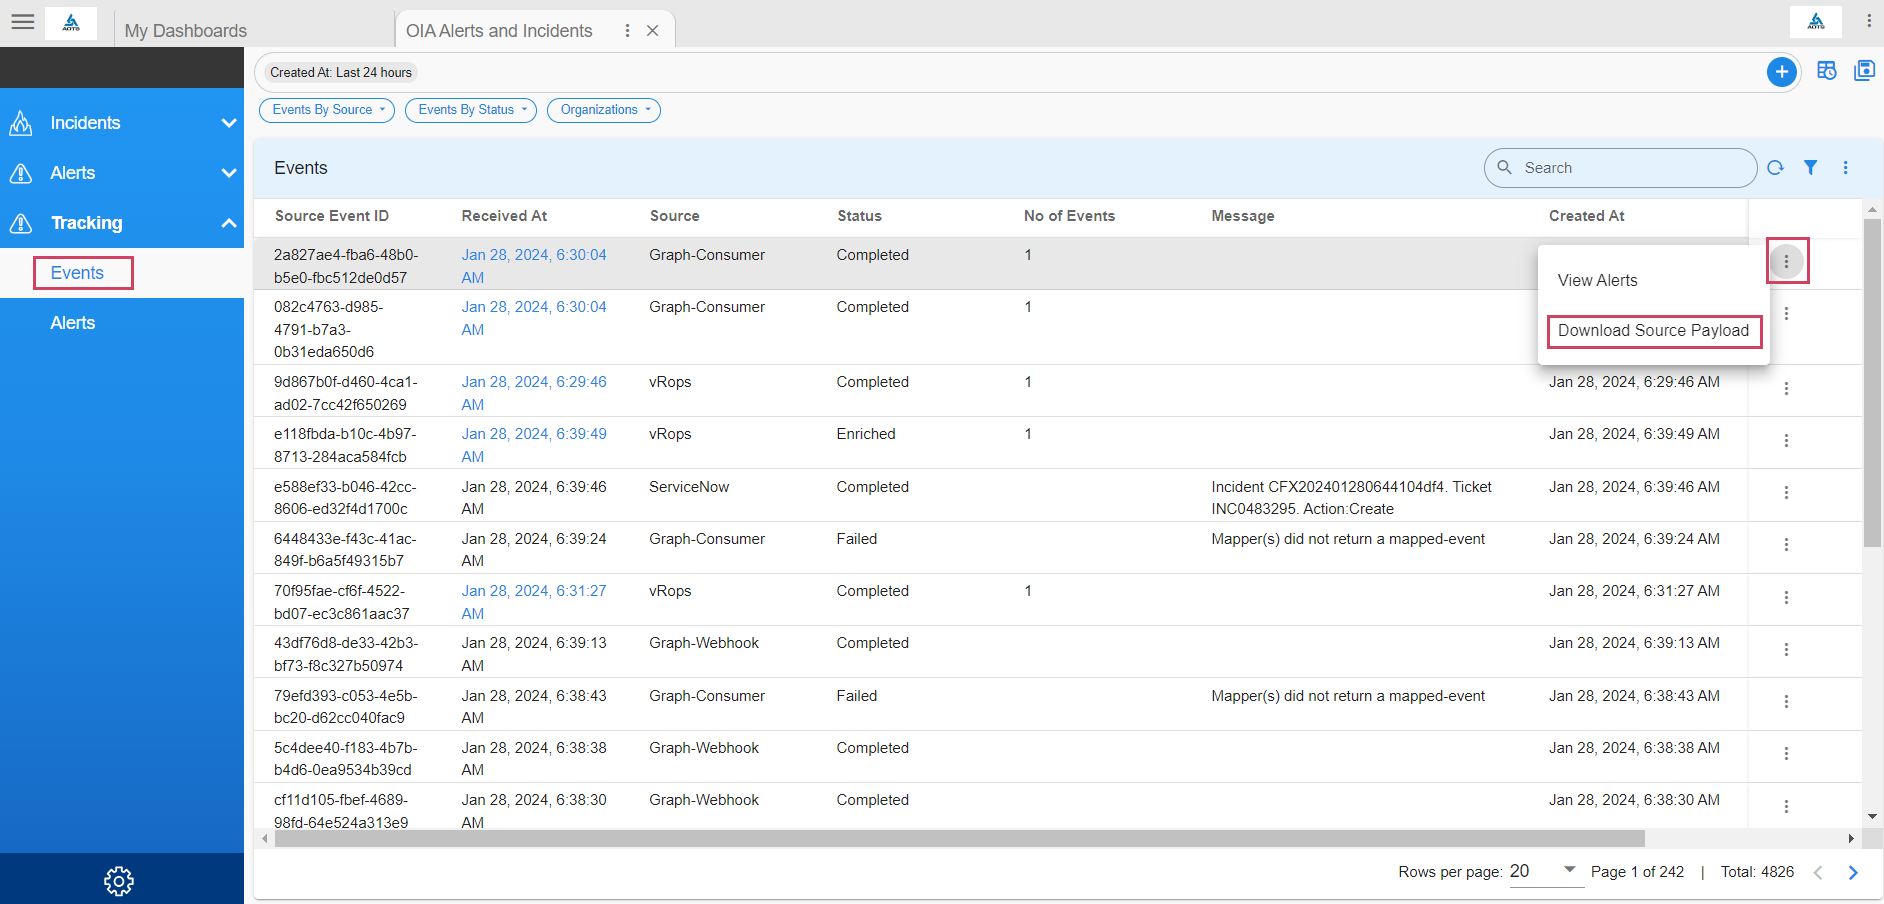
4.1.5 Source Event Payload
Go to Home --> User Dashboards --> select OIA Alerts and Incidents --> Click on Tracking --> Select Events
- Download the raw payload of the event posted to the webhook from the source as shown as example in the screenshot below
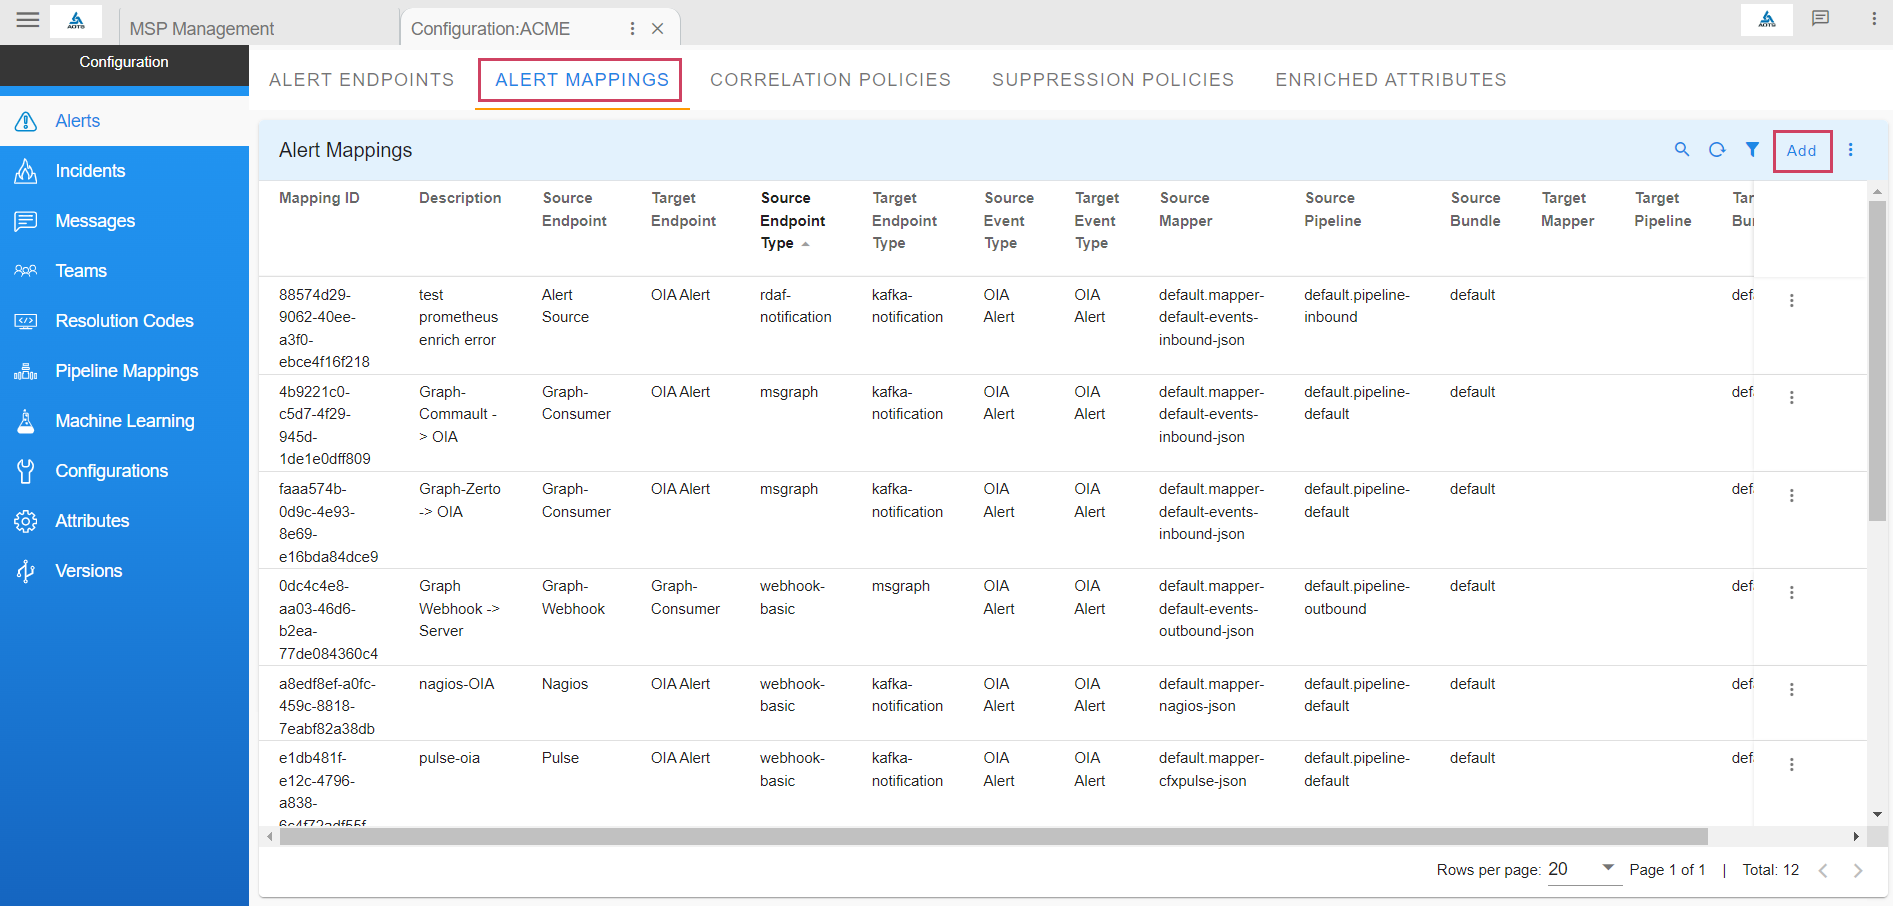
4.1.6 Source Event Mapping
- The source events will NOT be processed yet by the system without an appropriate mapping rule for translating the raw events into an actionable alert or incident or message.
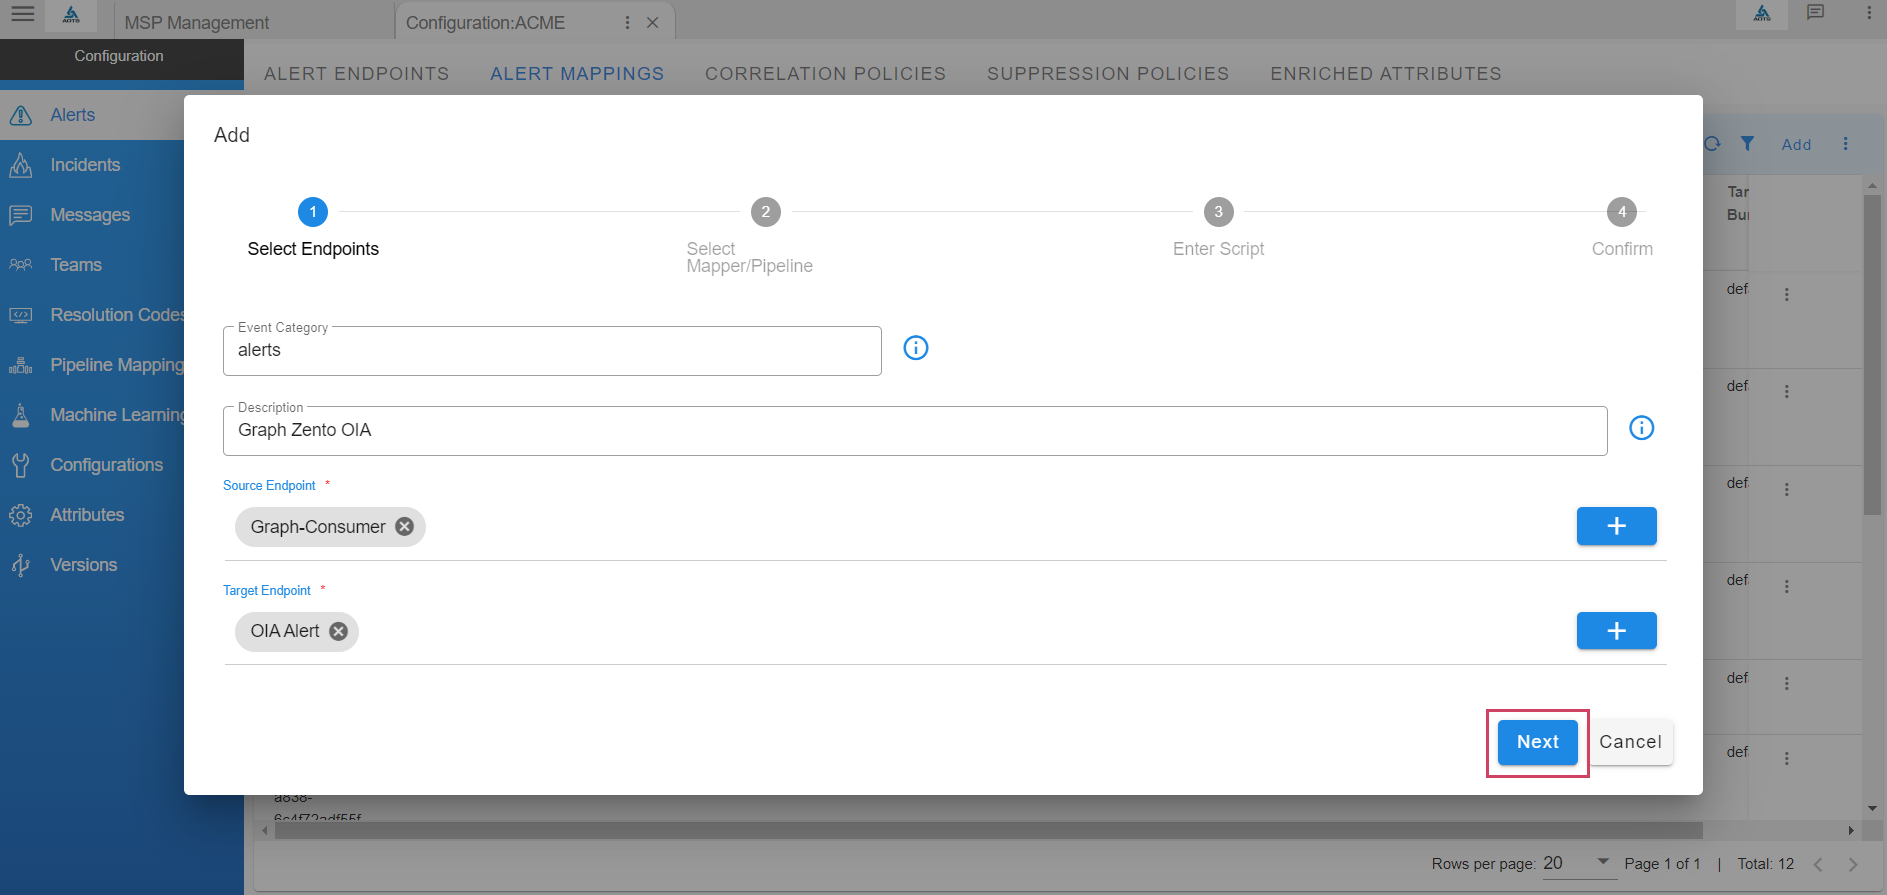
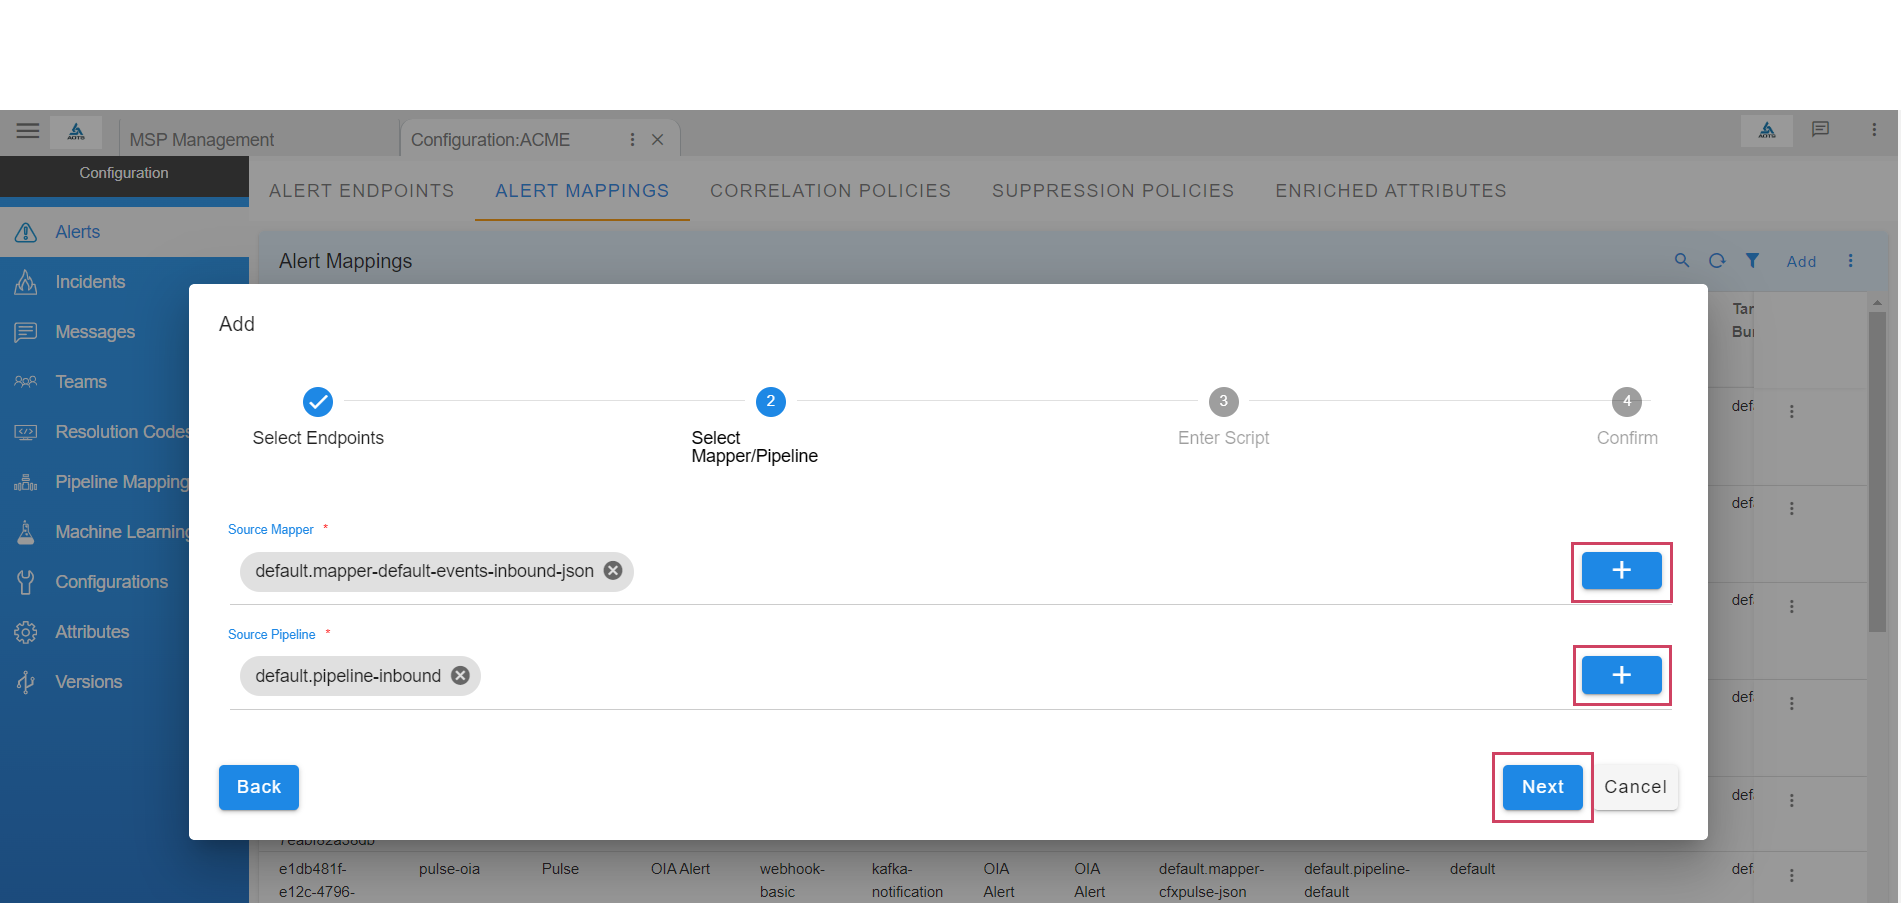
To create a mapping rule for translating the source event as an alert, navigate to Home --> Administration --> Organizations --> Configure --> ALERT MAPPINGS --> click on Add
- Select the source endpoint created earlier and select OIA Alert as target to ingest the event into the system as an actionable alert. Click Next
- Select one of the pre-defined mappers or select default.mapper-default-events-inbound-json to create a new JSON mapper. Also select pipeline default.pipeline-inbound for processing the alert via the ingestion pipeline.
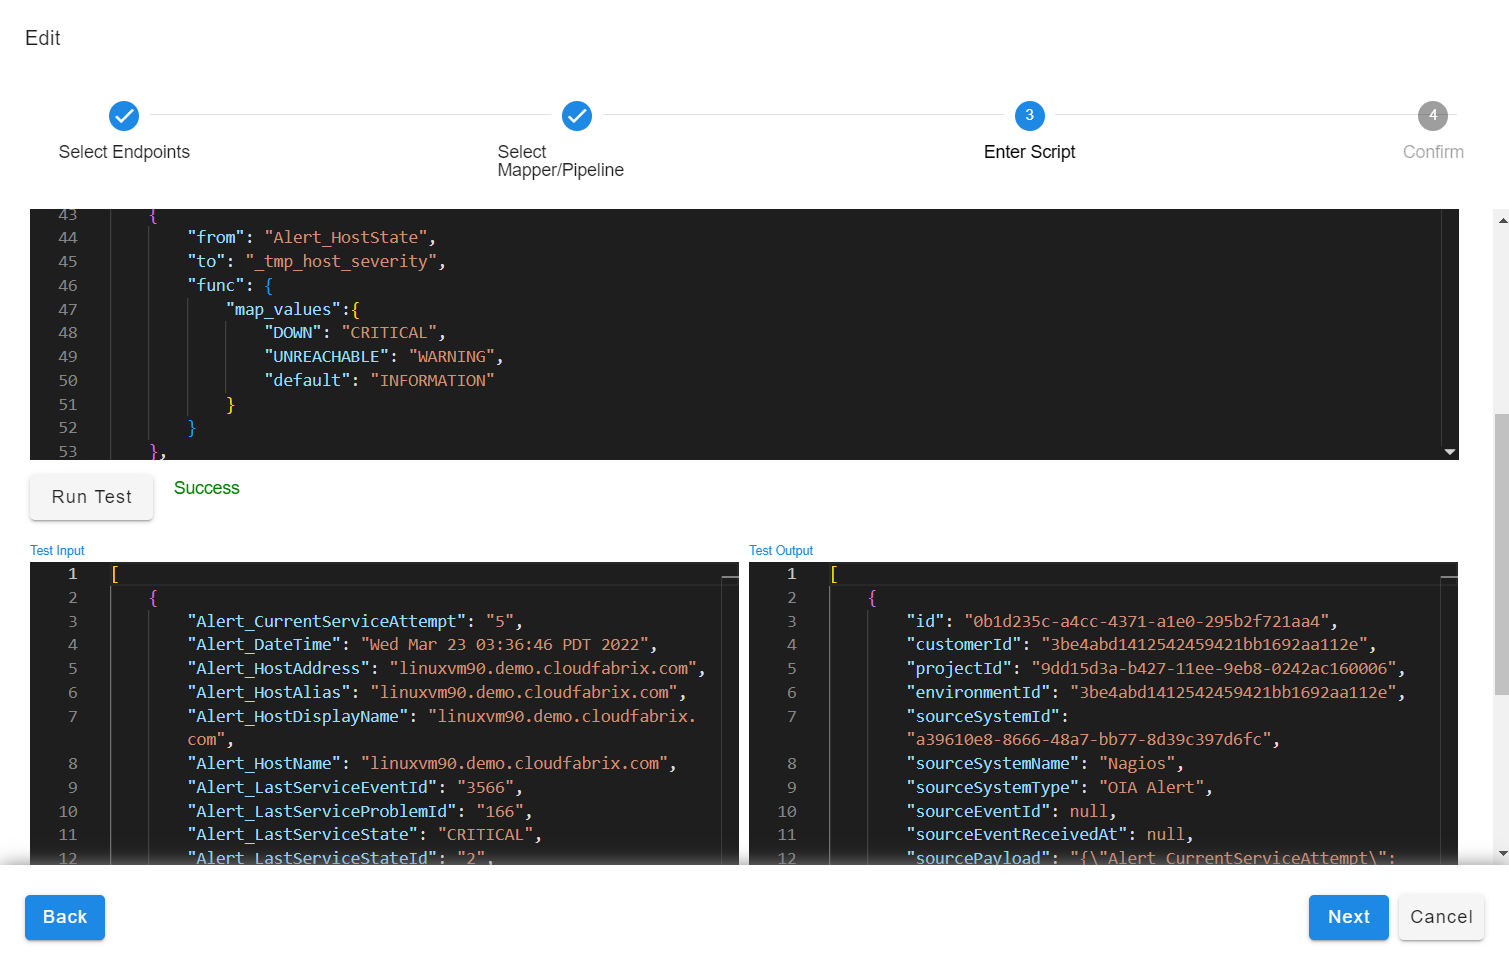
- Use the contents from the downloaded source payload as input. Create a JSON mapping definition to translate the input to the system identifiable alert.
For more Information on Json Based Alert Mapping Please click here
Use the Run Test option to view the mapping results in the output pane. After testing, save the mapping rule.
- Any incoming events to the system will now be processed as per the defined mapping rule and an alert will be created in the system.
4.1.6.1 Configure Enrichment of Metric Columns Using Mapper
- This adds attributes required for metric collection.
{
  "func": {
    "stream_enrich": {
      "name": "oia-selected-metrics",
      "condition": "asset_id is '$assetIpAddress' or asset_name is '$assetName'",
      "enriched_columns": {
        "metric_source": "metric_source",
        "asset_id": "metric_asset_id"
      }
    }
  }
}
4.1.7 Event Tracking
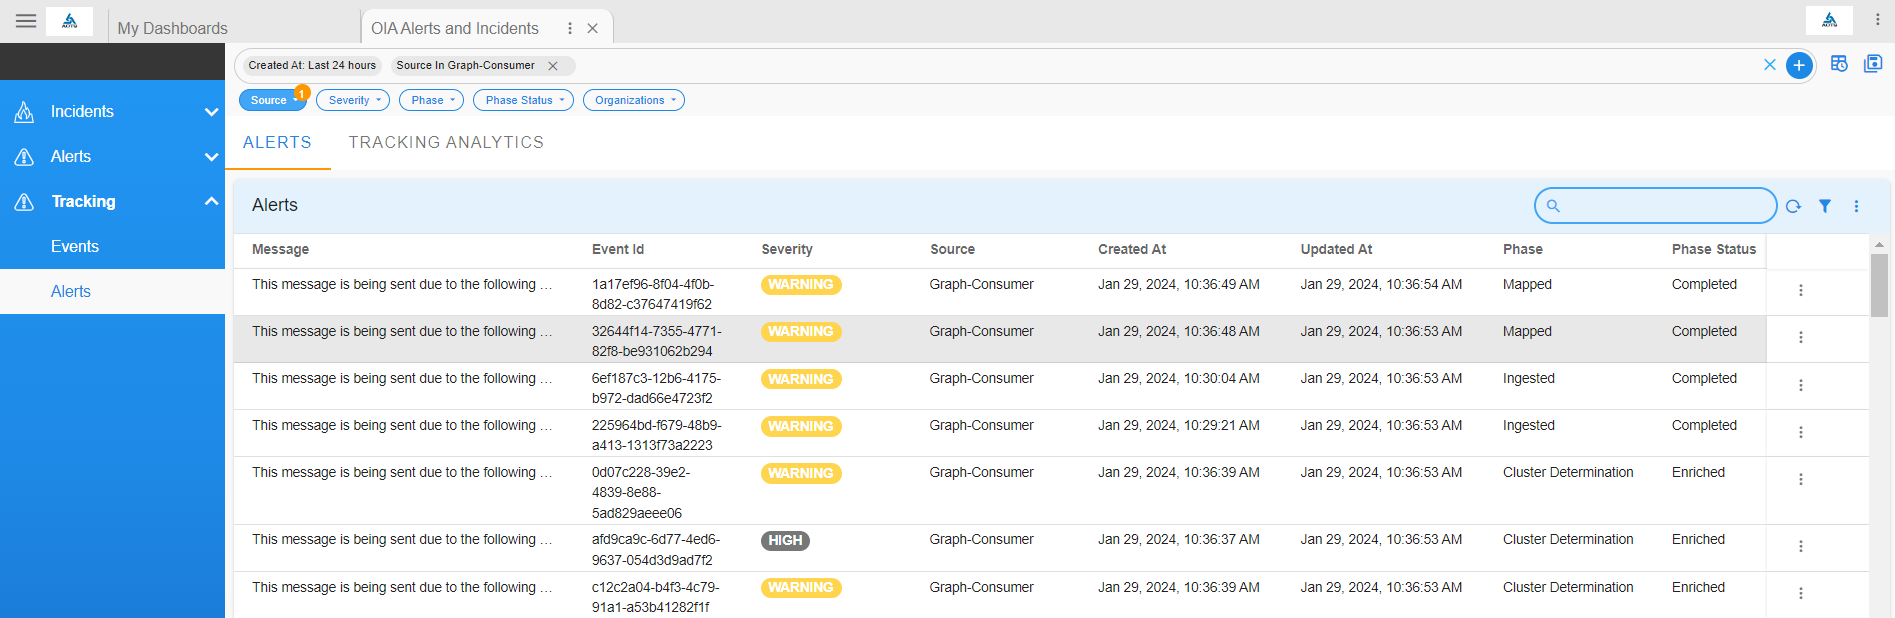
Go to Home --> User Dashboards --> select OIA Alerts and Incidents --> Click on Tracking --> Select Events
View the alert created from the incoming event by navigating to the dashboard OIA Alerts and Incidents, and under the Events tab select View Alerts for the incoming event
![]()
- Alternatively, you can view all mapped alerts and incidents under the Alerts and Incidents tabs, respectively.
{
  "type": "SOURCE-EVENT",
  "sourceEventId": "fe342378-da9d-4475-8852-28076f60483d",
  "id": "fe342378-da9d-4475-8852-28076f60483d",
  "sourceSystemId": "b4a94c8e-ee3a-45f9-8e5a-e1a960d9a6ed",
  "sourceSystemName": "Test",
  "projectId": "49e1de48-516b-11ef-9015-0242ac140006",
  "eventCategory": "alerts",
  "customerId": "969e78aa5b31436282fa8976ae8de8d6",
  "createdat": 1731579545852.3047,
  "sourceReceivedAt": 1731579545852.2368,
  "parentEventId": null,
  "objstore_location": null,
  "payload": "<serialized event data>",
  "status": null
}
{
  "type": "EVENT",
  "sourceEventId": "fe342378-da9d-4475-8852-28076f60483d",
  "id": "3224b96a-8cdd-4294-9fd7-fed73a4ce7fb",
  "sourceSystemId": null,
  "sourceSystemName": null,
  "projectId": null,
  "eventCategory": null,
  "customerId": null,
  "createdat": 1731579554557.038,
  "sourceReceivedAt": 1731579545852.2368,
  "parentEventId": null,
  "objstore_location": null,
  "eventKey": null,
  "severity": null,
  "payload": "<serialized data of a mapped event>",
  "label": null
}
{
  "type": "EVENT-STATE",
  "sourceEventId": "8c3d07f2-d020-4d35-aa99-1716c811b371",
  "id": "9318c5f5-a7b6-4e6d-b3aa-50f719be3ad9",
  "sourceSystemId": "b4a94c8e-ee3a-45f9-8e5a-e1a960d9a6ed",
  "sourceSystemName": null,
  "projectId": "49e1de48-516b-11ef-9015-0242ac140006",
  "eventCategory": "alerts",
  "customerId": "969e78aa5b31436282fa8976ae8de8d6",
  "createdat": 1731645523277.3901,
  "sourceReceivedAt": 1731645523277.3901,
  "parentEventId": null,
  "objstore_location": null,
  "eventKey": "0f44561717863028bf60d0fedde65e1c",
  "processingState": "Ingested",
  "status": "Completed",
  "processedEventId": "0ba03246-1923-4463-b3f1-5f49e403aca4",
  "triggeredEvent": "RAISE",
  "message": null
}
4.1.8 Alerts Report
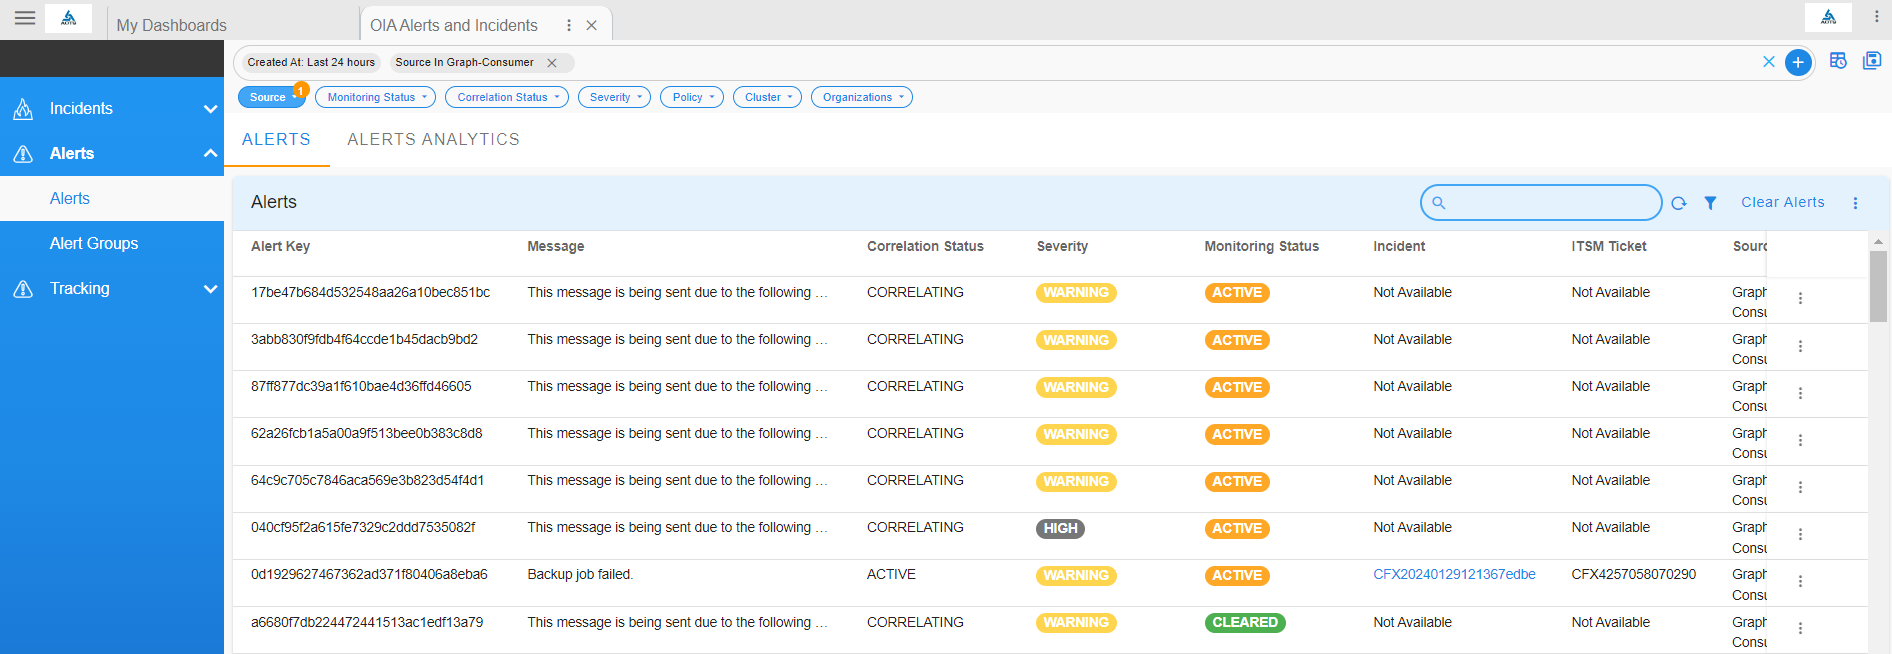
- View all alerts created in the system by clicking on the Alerts tab
Go to Home --> User Dashboards --> select OIA Alerts and Incidents --> Click on Alerts
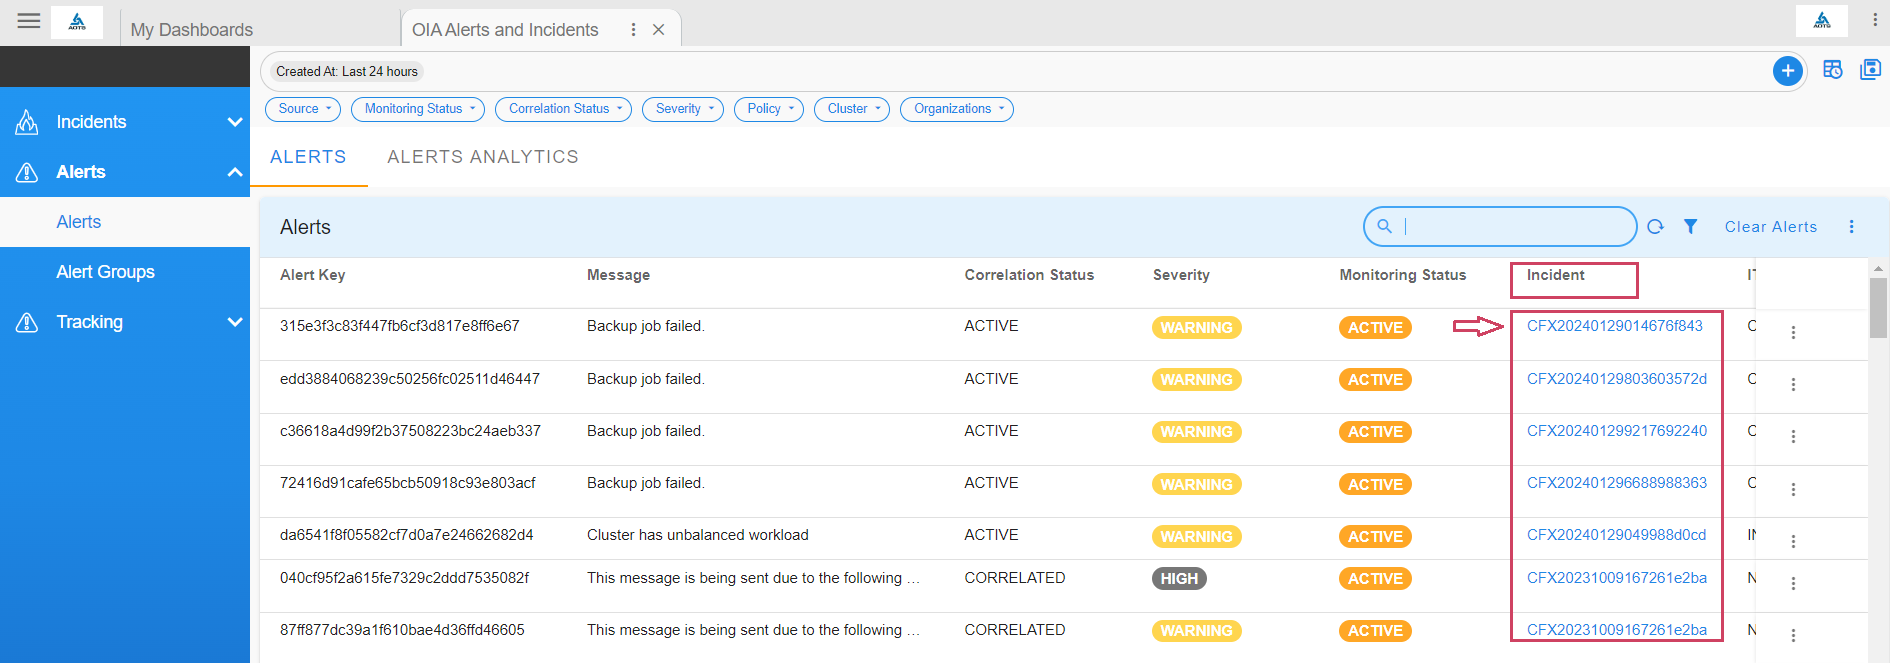
Click on the incident link to view the incident details
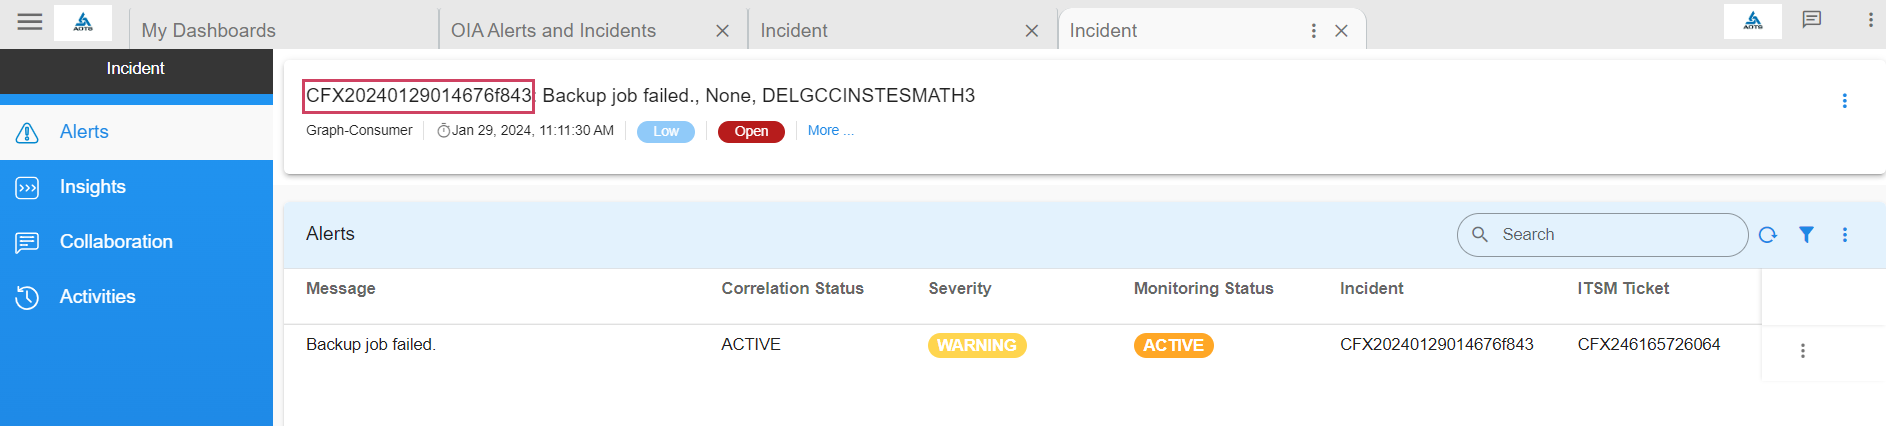
After the user Clicks on the Incident Link
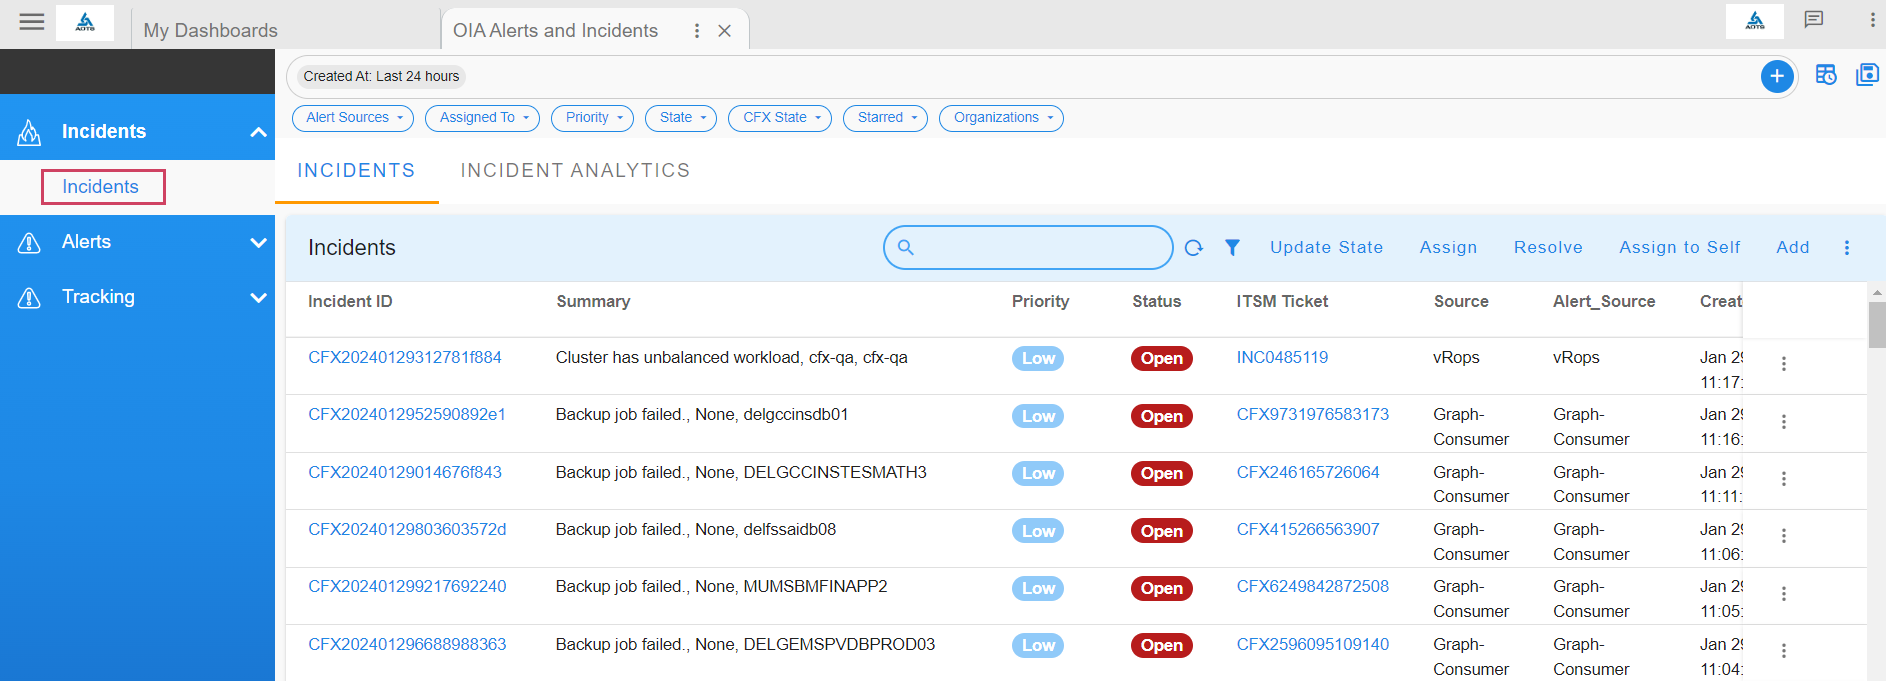
4.1.9 Incidents Report
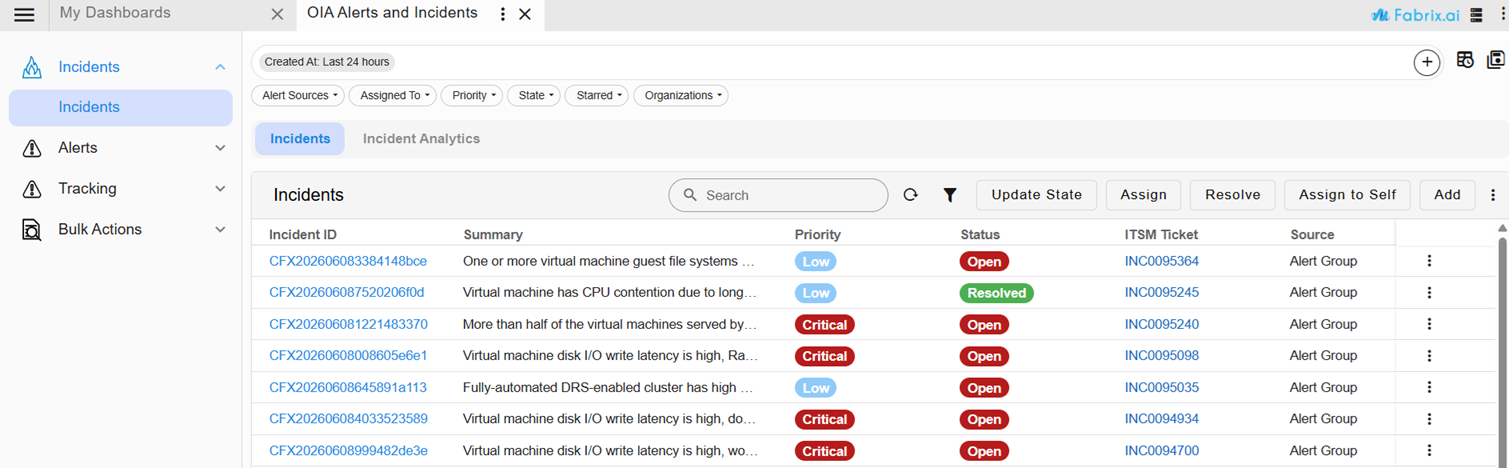
View all incidents created in the system by clicking on the Incidents tab
5. Data Analysis and Stitching
Large enterprise environments have a mix of structured and unstructured IT data sources and many custom IT data parameters defined and implemented across various data sources. For example, IT environments can implement custom attributes like machine type, environment, site code, department name, support group, application ID, etc. Not every tool implements these attributes, making it difficult to understand which operational data sources are relevant for AIOps implementation and which attributes can be gleaned from which sources to enrich raw alert data. This is where the cfxOIA Data Analysis and Stitching module comes into the picture to help establish the below
- Asset Identities
- Enrichment Attributes
- Enrichment Flows
- Baseline Analysis
This module works off of historical alert/event data, ticket data, CMDB data, service mappings, asset management and establishes a data chain that will help in appropriate data source selection and enrichment attributes for AIOps implementation.
6. Alert Enrichment
Raw alert data contains extremely limited information, often consisting of id, severity, message/description, rule name, and asset IP/hostname, etc. This information doesn't provide enough service context (Application or Service name, Environment, machine-type, etc.) or supportability context (NOC id, Site-id, Department, Support-group, etc.) which are essential data for efficient correlation of alerts. cfxOIA performs automated alert data enrichment using a combination of following approaches
- ACE (Automated Context Extraction): Using this method, it extracts useful information like IP Address, DNS name and certain identifiable attributes from the source alert's payload. This doesn't require any external integrations, however, in majority of the scenarios, this may not be sufficient for alert correlation.
- External source lookup: This process looks up information related to the incoming alerts in an external data source (ex: CMDB or Inventory system, CSV etc...) and then adds them as enriched alert attributes. Enriched attributed presents more contextual information to the IT Operations user and also will be used to correlate the alerts.
6.1. Normalization
Alert notifications are ingested from disparate monitoring tools into cfxOIA application and each of them follow different format with different alert attributes. Some of the below attributes (not limited to) are important ones in general related to any incoming alert.
- Alert Timestamp
- Alert Status
- Alert Severity
- Alert Source
- Alert Message
Below are three sample alert notifications payload from VMware vROps, Nagios & AppDynamics. As shown in the below, the alert attributes are completely different from each other.
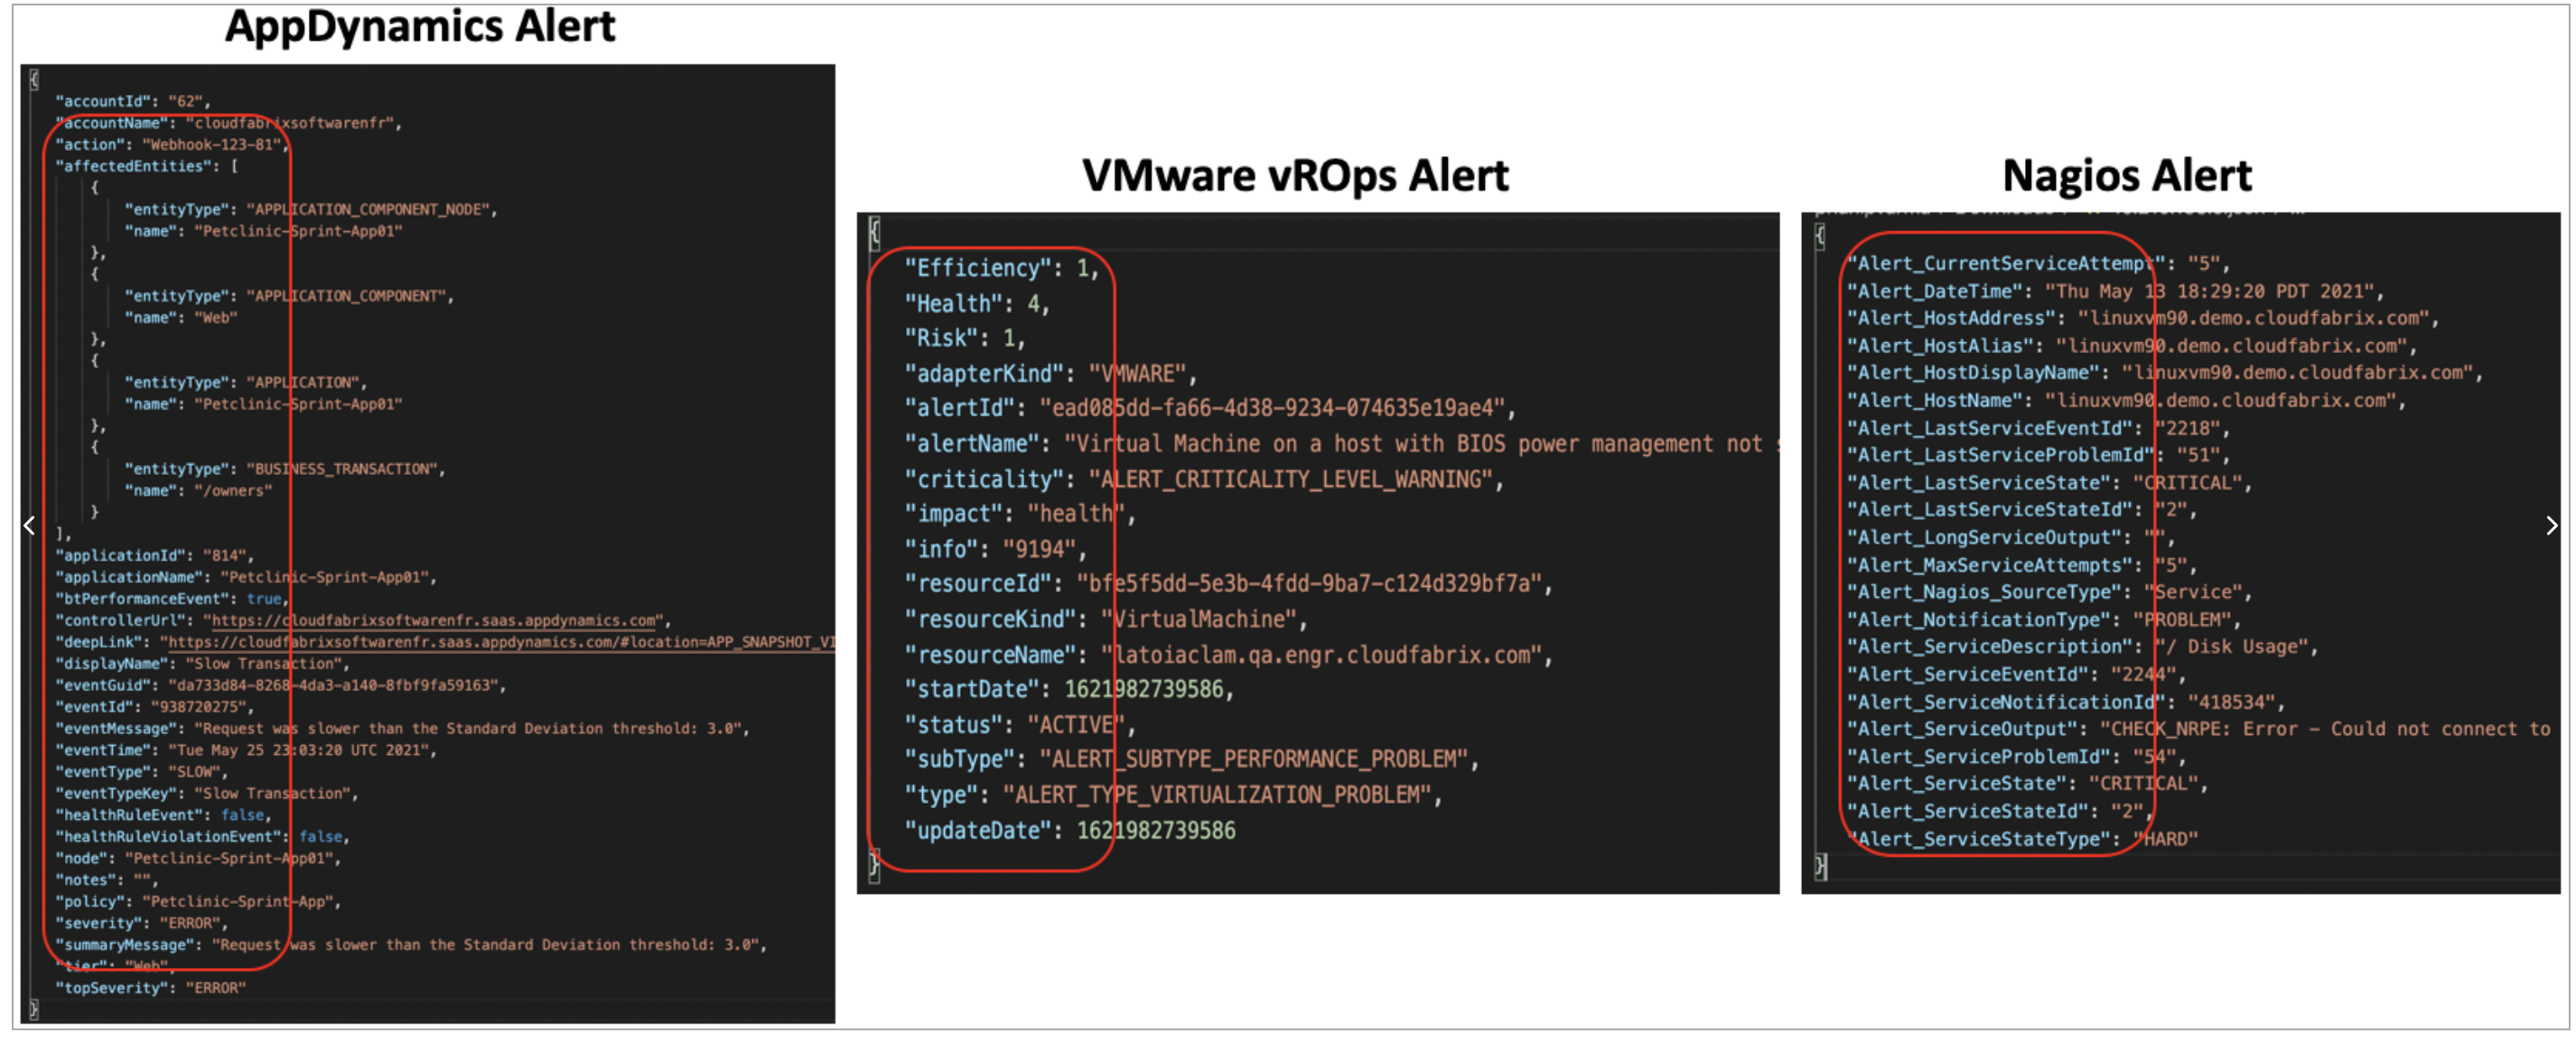
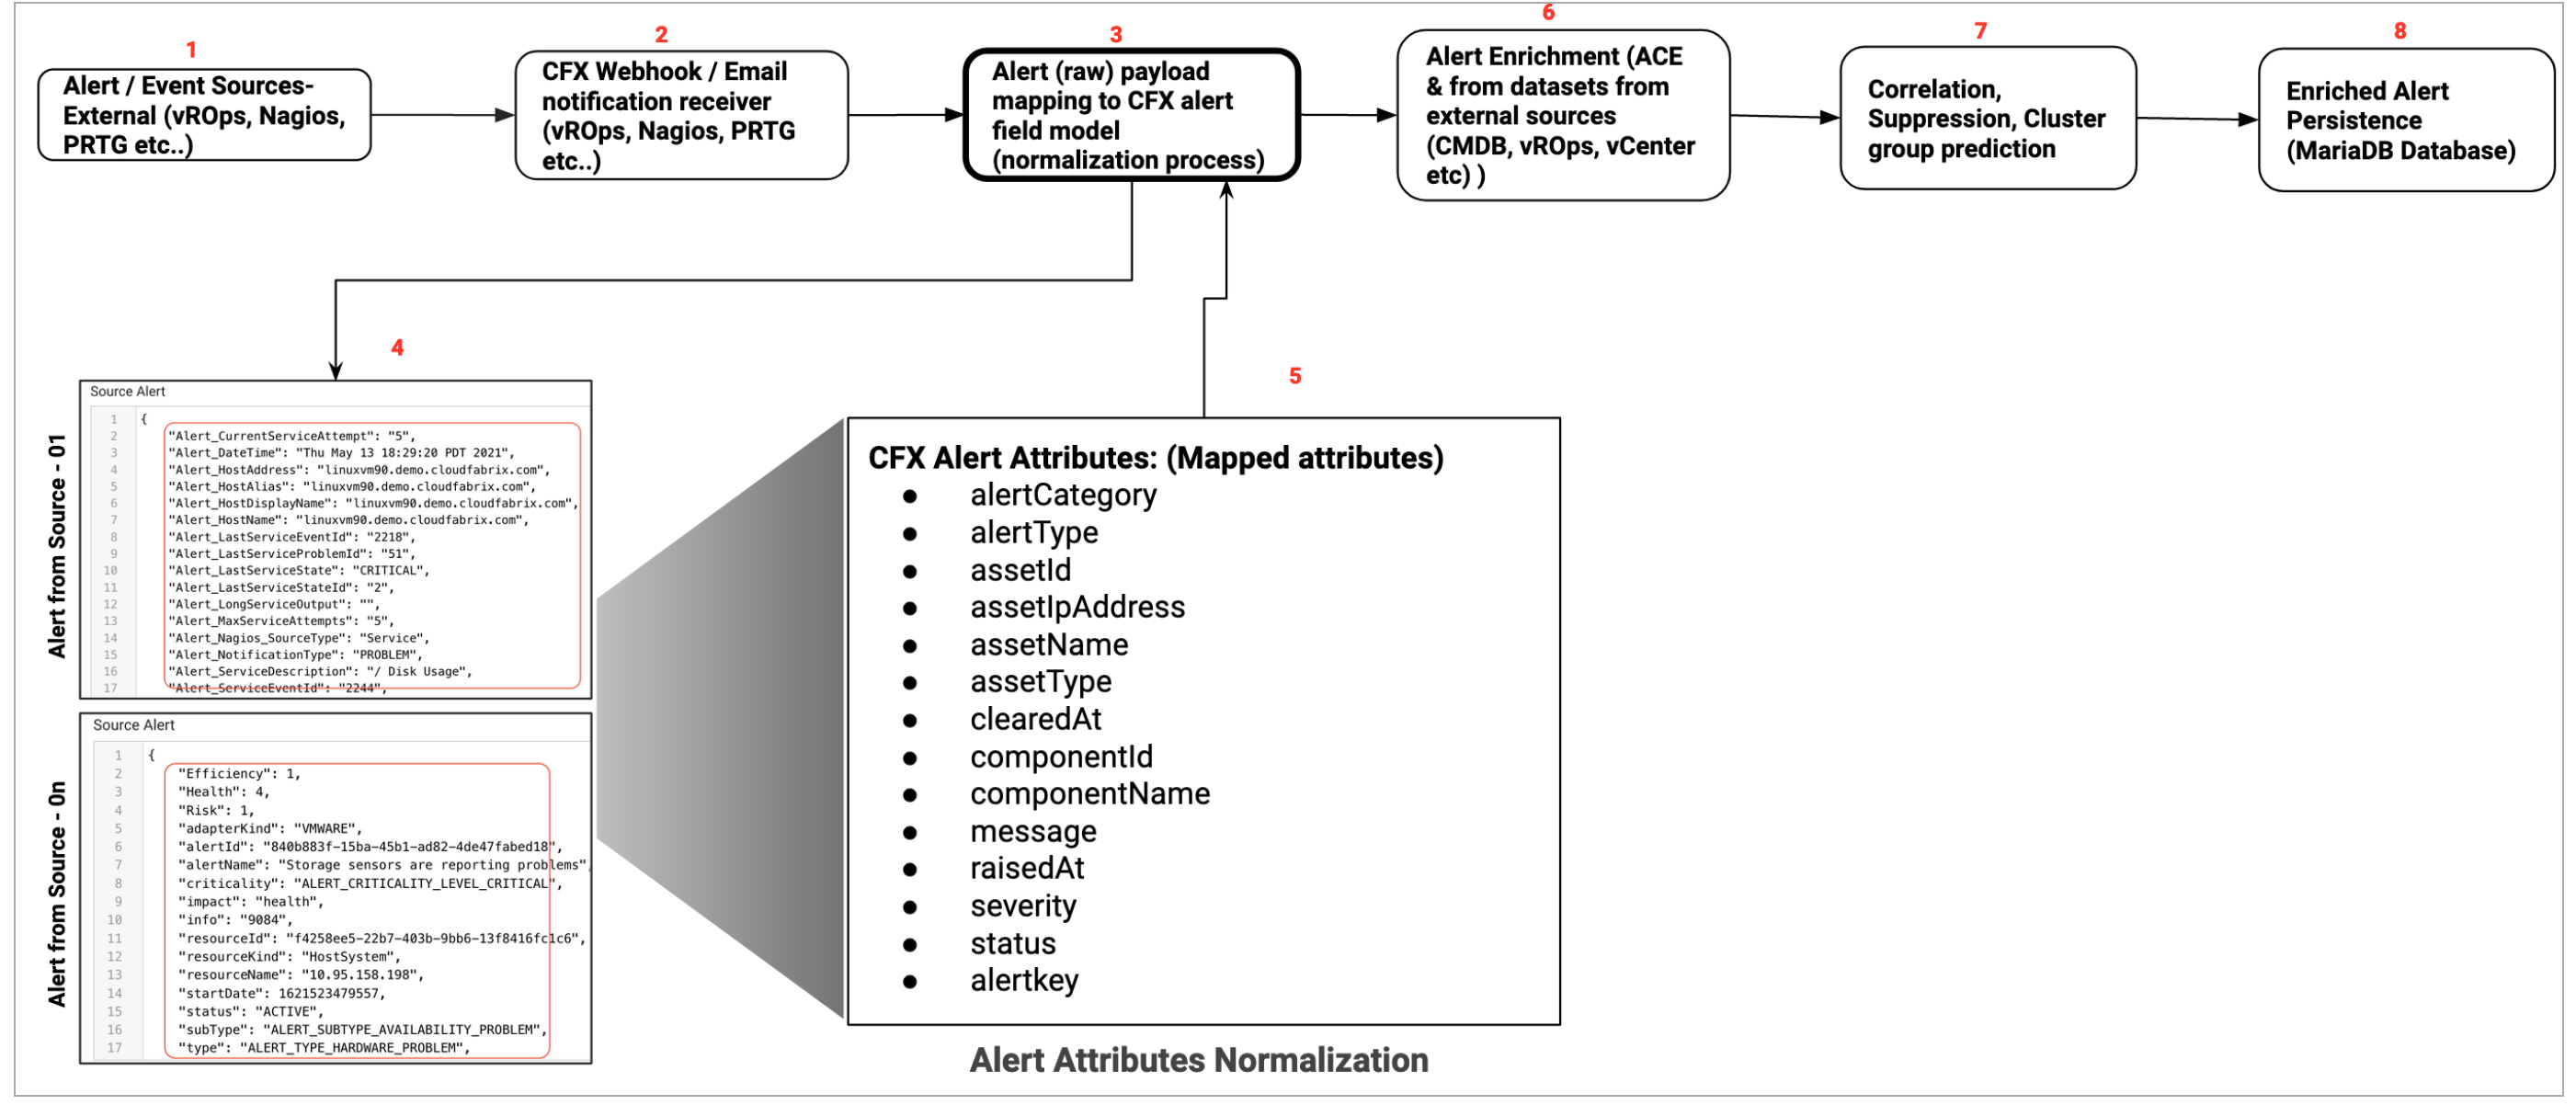
In cfxOIA application, it is a prerequisite to normalize these alert attributes coming from different monitoring tool sources to a common data model. Below are list of attributes which are used as part of the alert mapping process. Every ingested alert will go through Alert mapping process and their's payload attributes are mapped to the below standard attributes.
Info
Not all below attributes are mandatory to be mapped. The attributes that are flagged with * are mandatory ones.
- alertCategory: An attribute which can be used to categorize the alert
- alertType: An attribute to classify type of alert
- assetId: An attribute which can be used to identify the source of alert (Endpoint identity)
- assetIpAddress: An attribute that is used to identify the IP Address of the end point
- assetName*: An attribute that is used to identify the AssetName of the end point (ex: Hostname / Devicename)
- assetType: An attribute that is used to identify type of the Asset or the end point (ex: VM / Server / Storage / CPU / Memory etc)
- clearedAt*: Alert timestamp that is used to identify when the alert was cleared
- componentId: An attribute to associate a sub-component ID of an endpoint from which the alert was generated
- componentName: An attribute to associate a sub-component name of an endpoint from which the alert was generated
- message*: Alert message that states the symptom or problem which has caused the alert
- raisedAt*: Alert timestamp that is used to identify when the alert was occured
- severity*: Alert's severity (Ex: Critical, Warning, Minor etc..)
- status*: Alert's state (Open / Closed / Active / Recovered / Cancelled)
- alertkey*: Alert's unique identifier which is used to identify an incoming alert and to apply alert de-duplication process. It can be taken from a single alert attribute or a combination of alert's attributes
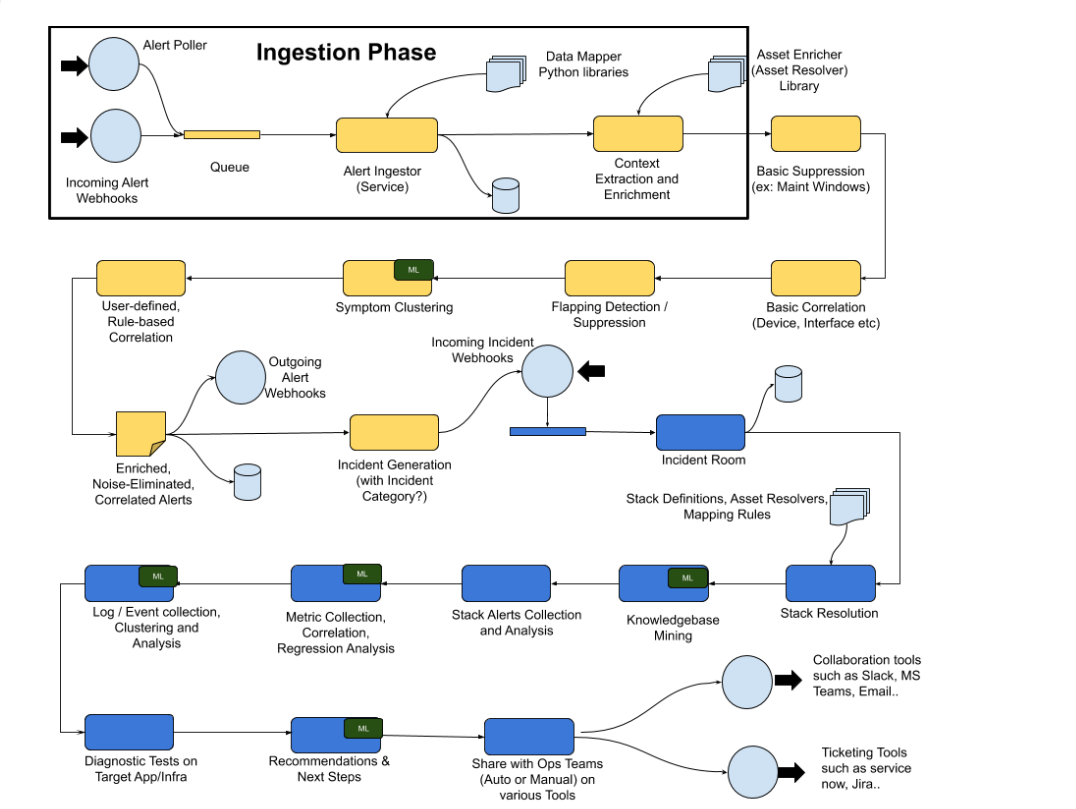
Alert ingestion with alert mapping & normalization process data flow:
6.2. Enrichment
Below flow illustrates different stages of Alert processing from ingestion, alert attributes mapping, alert enrichment, correlation/suppression and persisting into the system's database.
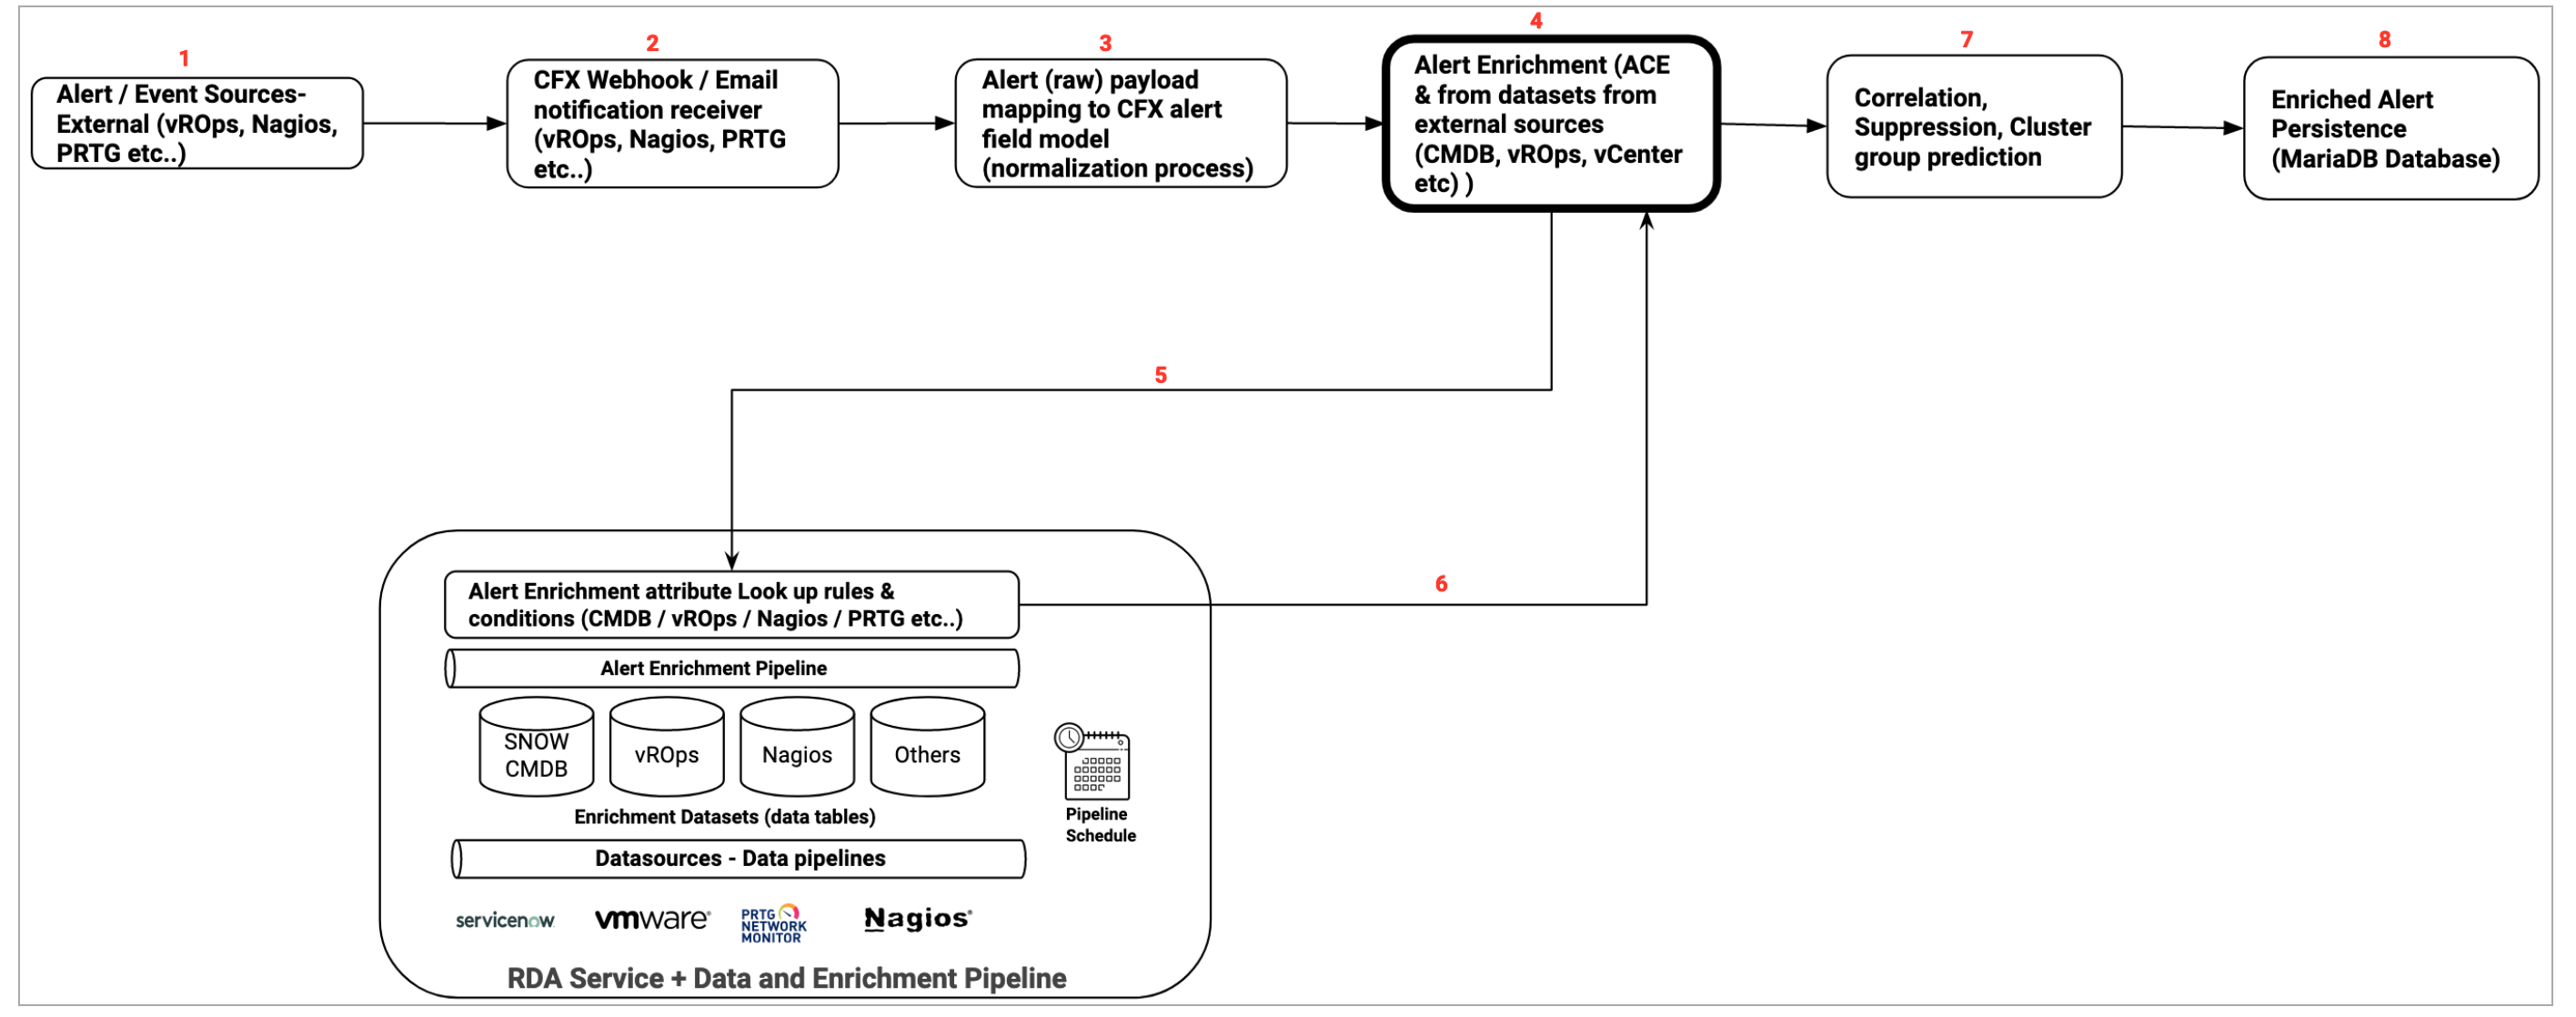
Tip
In the above image illustration, listed enrichment datasources such as SNOW (ServiceNow), Nagios & vROPs are used for a quick reference only. cfxOIA support many datasources for enrichment process.
6.3. Alert Mapper
Alert Mapper normalizes and enriches ingested alert notifications from various sources, such as webhooks, emails, Kafka queues, and other supported transport mechanisms, into a standard alert data model. For detailed configuration information on Alert Mapper, please refer to the document on Json Based Alerts Mapping
7. Alert Correlation
Alert correlation is a process of grouping together related alerts to reduce noise and increase actionability of alerts and events. Correlated alerts are grouped and translated into CFX incidents, which are then routed to ITSM systems for handling by NOC/IT Analysts, who can then login to cfxOIA's Incident Room module to perform swift triage, diagnosis and root cause analysis of an Incident.
cfxOIA's correlation engine provides recommendations for detecting and grouping new alert patterns. Admins can grasp, analyze the recommendations, and convert into Correlation Policies or define new policies altogether. Admins can also implement alert Suppression Policies to suppress alerts that escape during maintenance windows. cfxOIA provides out of box policies to treat well-known operational issues like alert burst scenarios, flapping scenarios, etc.
7.1 Key Points
- Ingested alerts and events are normalized to OIA alert model, to allow addressing most alerts/tool implementations
- Customers can add custom attributes to alert model using enrichment process
- Ingested alerts are enriched with context about application, stack, department, ownership, support-group etc. using a process called alert enrichment.
- Enriched alerts are then evaluated for any correlation or suppression to be performed. Suppression policies are used to suppress alerts that escape maintenance windows.
- Alerts that remain are then evaluated for correlation that is determined by correlation policies, which are setup in 3-ways
- System defined policies: To address well-known behavior like alert burst and alert flapping situations.
- ML driven correlation recommendations: OIA uses unsupervised ML clustering to detect alert patterns and provides list of suggested correlations in the form of Symptom Clusters.
- Admin defined correlation policies: Administrators can define new correlation policies or customize existing policies to meet their needs. For instance, correlation policies allow admins to group alerts across a full-stack or an application instance. Admins can also group alerts across a common infrastructure (like network, storage etc.) or shared services (ex: SSO, DNS etc.).
7.2 How correlation policy works
Correlation policies are in enabled state when created, but they can be disabled. Correlation policies determine how alerts can be grouped together. Most of the correlation policies can be created in an assisted-manner by recommendations provided by cfxOIA's correlation engine with symptom clusters.
A correlation policy can result in one or more instances of alert correlations, each represented by a correlation Alert Group.
Following controls are available to specify correlation behavior.
Minimum Severity of Alert Group:
Severity of a correlated alert group is always determined by the highest severity of alerts that it comprises of. However, admin users can configure if they want a minimum level of severity to correlated alert groups formed by a correlation policy.
Time Boxing:
Time boxing is the concept of grouping related alerts that fall within a certain time window, like 15-mins, 30-mins or 1-hour. The time window is started when first matching alert is detected and closed after the time window expires. Any new matching alert after time window expiration will result into a new correlated alert group instance which leads to a new incident.
Precedence:
Precedence values help determine which policy takes precedence when conflicts arise, which could arise when an alert matches multiple policies. For example, an alert belonging to symptom cluster prod and application CMS can match both policies that are setup to correlated alerts at application level (app-name == CMS) or at symptom cluster level (cluster-name == prod). By providing higher precedence to application-level policy, alerts can will be grouped at application level.
Precedence is a numeric value starting with 10000, and higher values indicate higher precedence and take priority in case of match. Precedence values are optional, if not provided, system provides Precedence values automatically, based on chronological order i.e newly created correlation policies will get higher precedence.
A typical approach would be setup more wider or broad-scope correlation policies with higher precedence and more specific correlation policies to be with lower precedence.
Property Filters:
Narrows down related alert selection criteria using a set of property filters that match property fields with specified values using conditions like (equals, contains, in list of values etc.)
Property filters allow fine grained control of correlation policies to meet organizational processes, administrative domains or functional groups.
Group By:
Related alerts can be grouped by values in a certain attribute. This works best for attributes that are typically of type enumeration, list of values or represent a limited set of identities.
For example, assume Machine-Type attribute has following values Machine-Type = Application / Server / Network / Storage then if the Group By selects Machine-Type as attribute, correlation engine will automatically group alerts which have
With two group by attribute selections indicated above, following alert group correlations will be
"Machine-Type == Application and Environment == Prod" into one group.
"Machine-Type == Application and Environment == UAT" into one group.
"Machine-Type == Server and Environment == Prod" into one group.
"Machine-Type == Server and Environment == UAT" into one group.
"Machine-Type == Storage and Environment == Prod" into one group.
"Machine-Type == Storage and Environment == UAT" into one group.
"Machine-Type == Network and Environment == Prod" into one group.
"Machine-Type == Network and Environment == UAT" into one group.
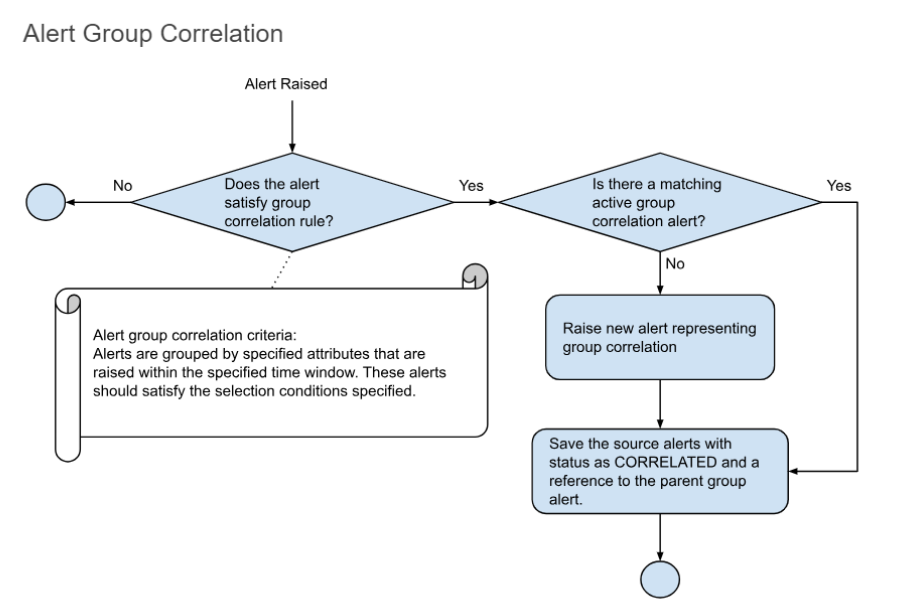
7.3 Correlation Group Policy
7.3.1 Alert Group Correlation Diagram
Tip
Some screenshots are normal some screenshots needs zooming, Please click on those screenshots below to enlarge and again to go back to the actual page please click on the back arrow button on the top left.
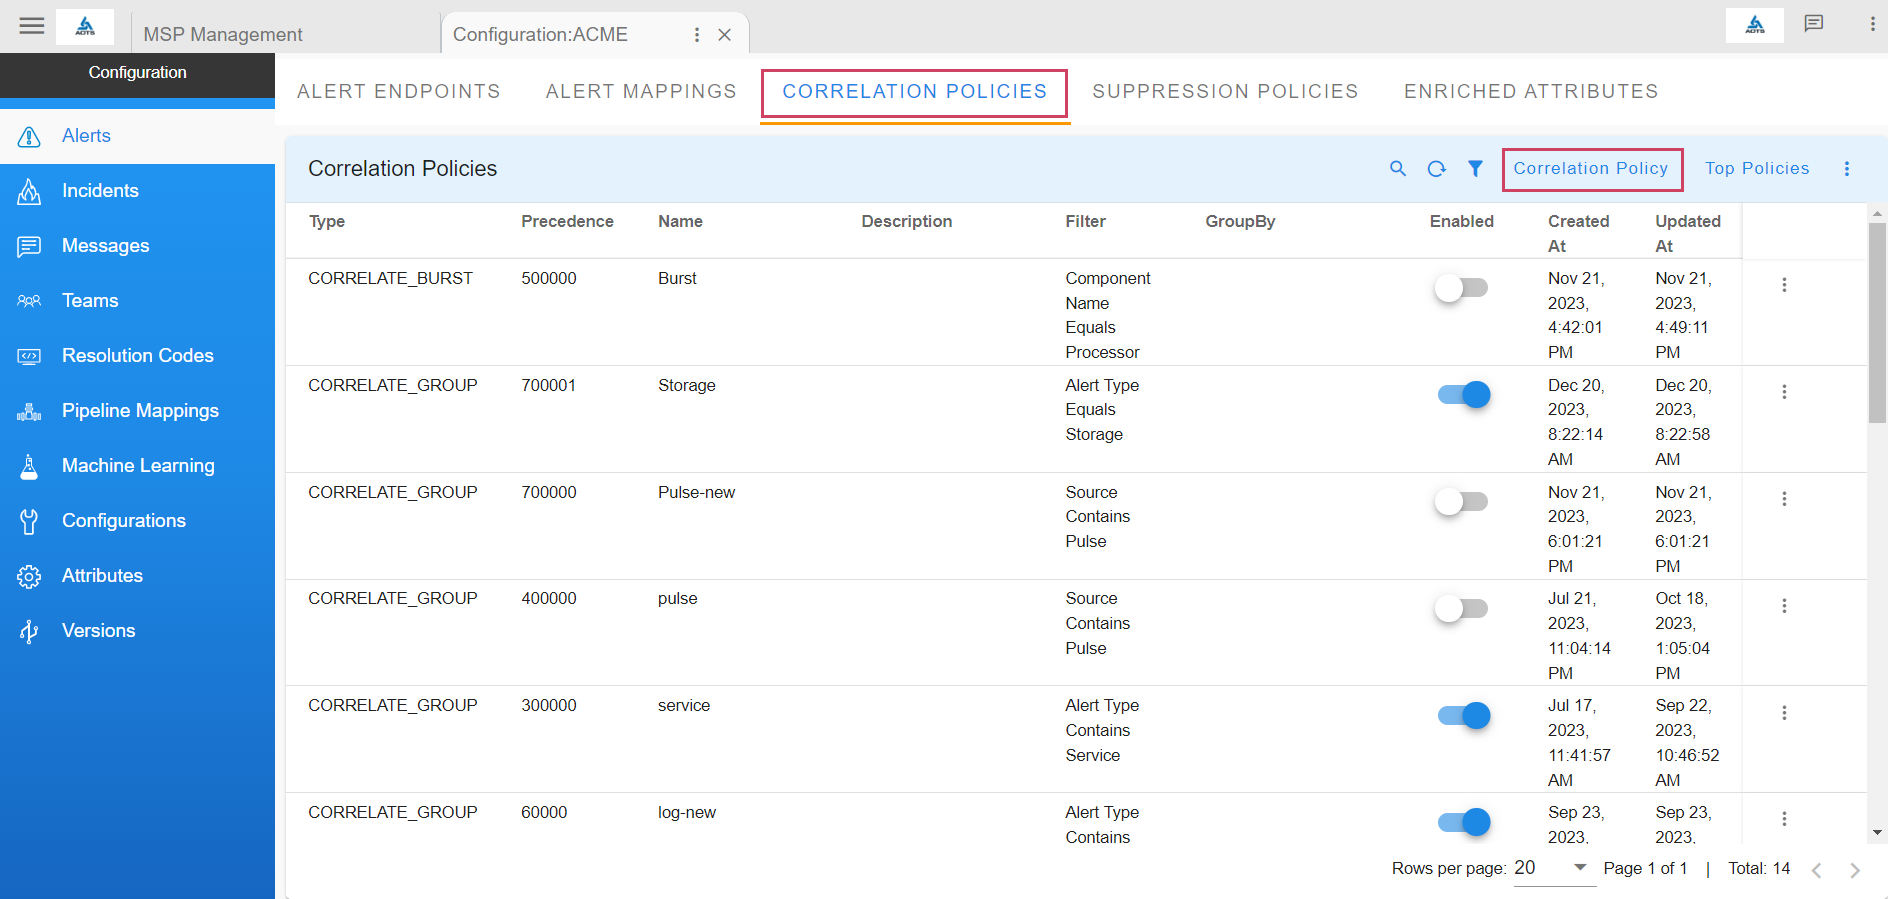
7.3.2 Correlation Use Case
-
Correlation is the process to correlate alerts generated from different sources and to reduce the noise of alerts, One of the ways to achieve this is to define correlation policy and get alerts correlated to one alert-group.
-
Alerts can be filtered using the policy filter and can be grouped using the GROUP BY methods of the correlation policy definition.
Creating and Updating Correlation Policies
Home --> Administration --> Organization --> Click on Configure --> click Correlation Policies --> Add all required credentials
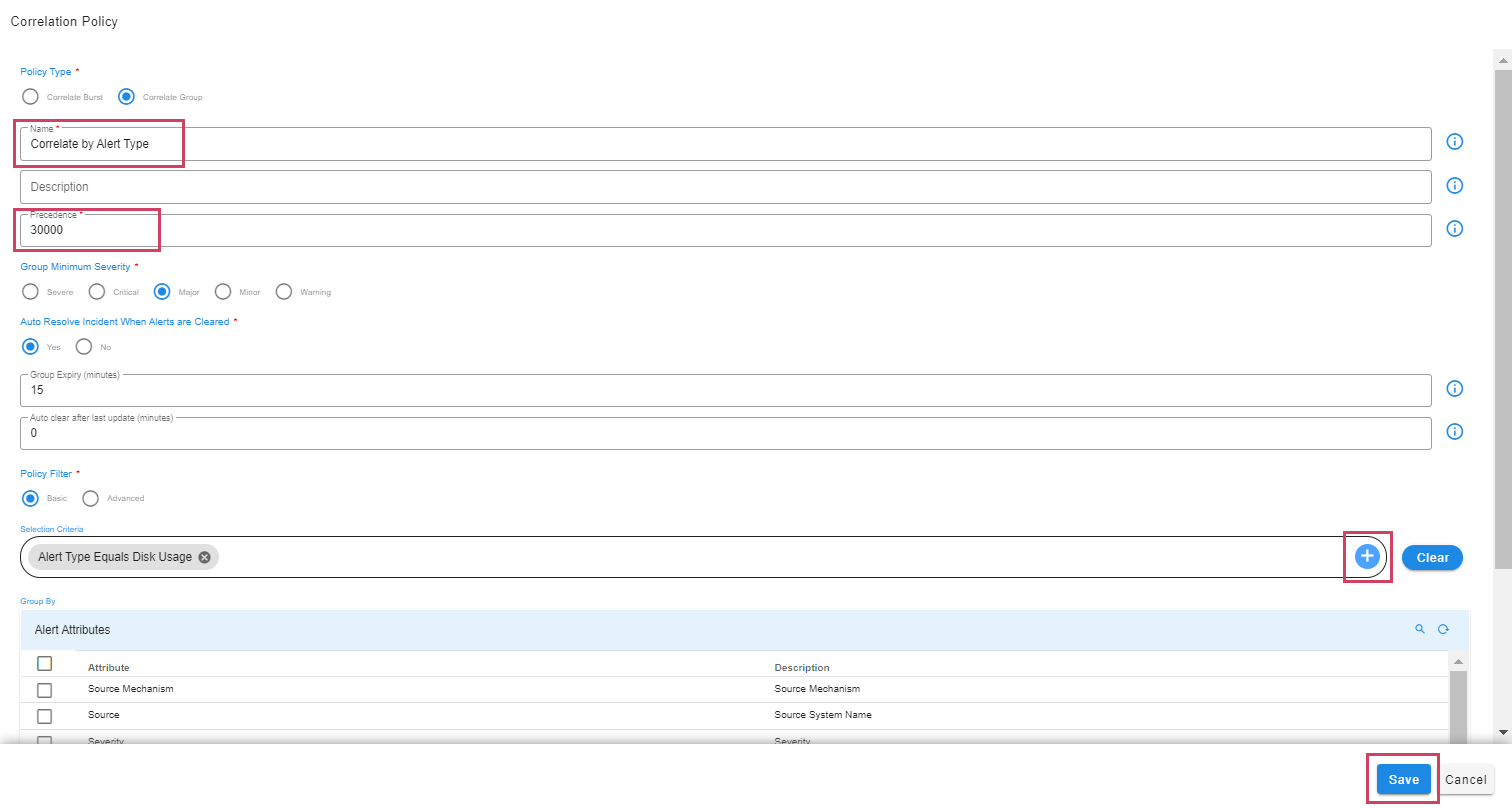
7.3.3 Policy Definition Attributes
7.3.3.1 Precedence
-
Each policy has to be defined with a precedence. Policy applicability happens based on the defined precedence for incoming alerts.
-
Below are the allowed values for precedence:
a) Minimum Value: 10
b) Max Value: 1000000
7.3.3.2 Auto Resolve Incident When Alerts are Cleared
-
When an auto resolve is defined as Yes for a policy, alert-group/incident is auto cleared on clear of all the children alerts.
-
Allowed values are Yes/No
-
When auto resolve is defined as No group will remain active even though all children in the group are CLEARED.
7.3.3.3 Group Expiry
-
Group expiry is defined in minutes, which defines a window for alerts to get correlated to an alert group.
-
For example if group expiry is defined as 15 mins, if a group is created at 10:00 then the group window is opened till 10:15. All the alerts received in between 10:00 to 10:15 are correlated to the group created at 10:00.
Below is the sample explanation on alert group with expiry
Time |
10 minute window | Alerts in Incident | Alert Group State | Incident State |
|---|---|---|---|---|
| 10:03:00 | 2 Alerts raised, Alert Group is created - valid till 10:13:00, Incident is created - Incident 1 | 2 | Open | Open |
| 10:05:00 | 2 Alerts cleared | 2 | Open | Open |
| 10:07:00 | 3 Alerts raised | 5 | Open | Open |
| 10:12:00 | 3 Alerts cleared | 5 | Open | Open |
| 10:13:00 | Alert Group is closed | 5 | Closed | Resolved(If all the children are cleared) |
In the Above Sample Incident 1 is cleared if the group is expired and all the children are cleared in the group. If any one of the children is in ACTIVE state then alert-group/Incident will remain in the open state.
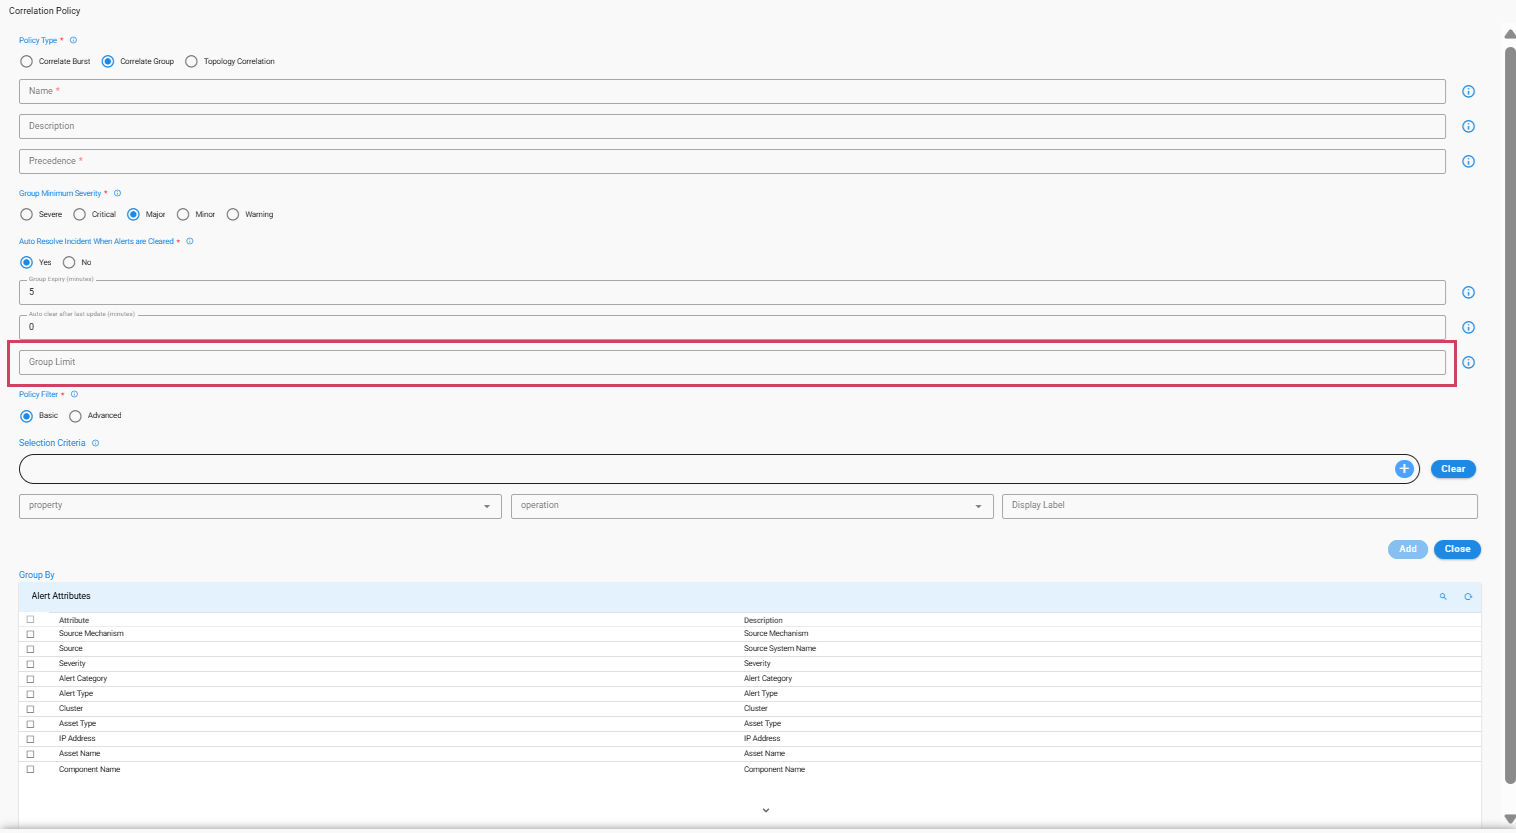
7.3.3.4 Group Limit
A Group Limit can now be set to restrict the number of alerts linked to a single incident. Once this limit is reached, a new incident is created, and any additional alerts are correlated to this new incident.
-
When creating a policy, the maximum Group Limit is capped at 50,000.
-
If a Group Limit is not specified
- Alerts will continue to be added until the group expires.
- If the group expiry is set to 0, all incoming alerts will be linked to a single incident until that incident is resolved.
Note
For instructions on configuring the Group Limit, please refer to the attached screenshot.
When Group Limit Is Exceeded
- Once the group reaches its defined limit, Choose option for handling subsequent alerts: either open a new incident or mark these additional alerts as Suppressed.
Two actions are available when group limit is reached:
1. Open New Incident: A new incident is created, and all additional incoming alerts are correlated with this newly created incident.
2. Suppress Correlated Alerts: Once the group limit is reached, alerts are suppressed and marked with the status CORRELATED_SUPPRESSED.
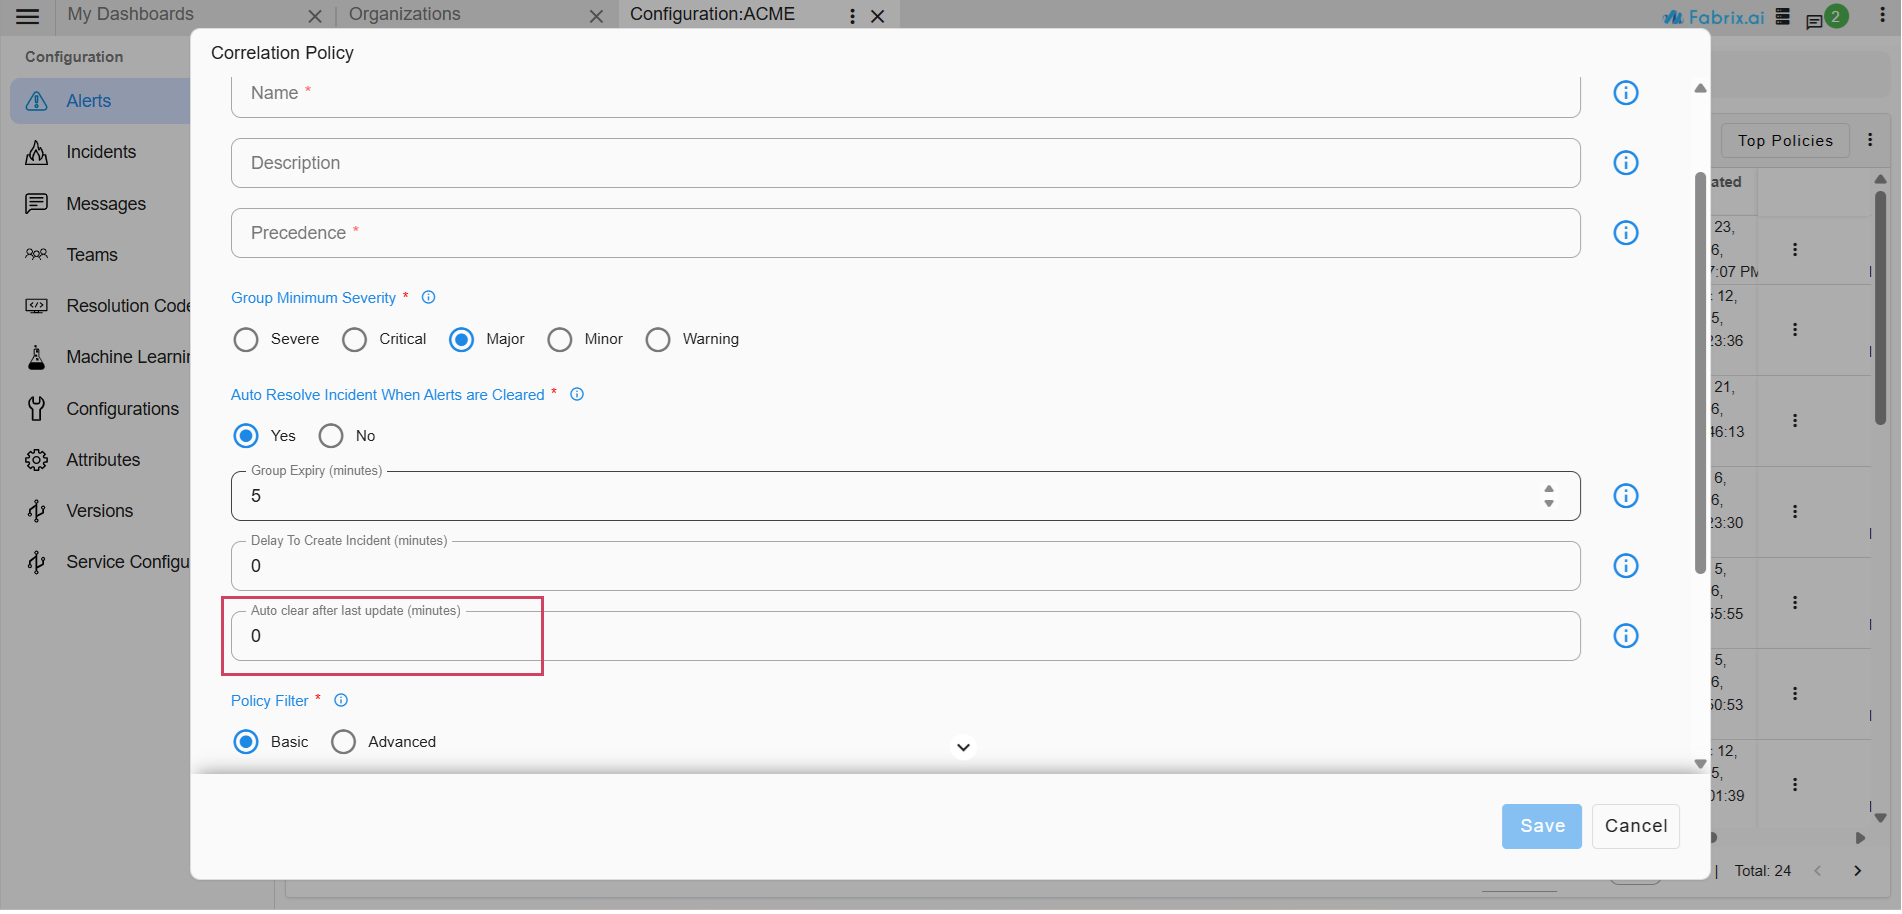
7.3.3.5 Auto Clear after last update
-
Auto clear an Incident happens if no new alerts gets correlated to the incident till the prescribed Auto clear interval.
-
For example if a correlation group is created at 10:00 and auto clear is defined as 20 minutes then the group will be auto cleared if no alert is received until next 20 minutes(i.e 10:20).
7.3.3.6 Policy Filter
- Please refer to the Policy Filter Field Documentation Here
7.3.3.7 Group By
-
Policy can be defined to have multiple attributes as group by, Unique incidents will be created using the group by attributes.
-
Enriched Attributes can be used as a group by Attributes. Please refer Using Enriched Attributes as filter attributes to define a policy section on how to enable the enriched attributes to use as a group by attribute.
7.3.4 FAQ’s
-
Can we have one incident created for a policy and correlate all the alerts to one incident ?
We can define a policy with zero expiry minutes. Incoming alerts filtered with the policy will get correlated to one incident and the incident will be cleared when all the alerts are cleared.
-
Can an incident be active even though all the children are cleared?
Incidents will be in active state when a policy is defined with auto resolve No, even though all the alerts of an incident are cleared.
7.4 Topology Correlation
Topology Correlation harnesses the topology insights generated by Fabrix.ai(CFX) to intelligently associate alerts from various sources. This process involves analyzing the complex relationships stored within the GraphDB to understand dependencies among infrastructure components, applications, and services. By leveraging these topological connections, CFX groups related alerts, offering several key benefits.
-
Reducing Alert Noise: Consolidates multiple alerts related to a single issue, minimizing alert fatigue.
-
Accelerating Root Cause Analysis: Enables quick identification of the most probable root cause, streamlining incident resolution.
-
Enhancing Incident Management: Provides a clearer understanding of an incident’s impact and scope, facilitating better prioritization and resource deployment.
-
Topology Correlation relies on the
node_id,node_type, andgraph_db_namevalues within an alert. These values are populated during the enrichment process, a prerequisite for execution. Further details can be found in the Prerequisites section. -
Alert policies assume that any alerts are enriched with a valid
node_idandnode_typefrom either a Dataset or GraphDB, and that these are part of the topology graph DB.i ) For incidents to be created and alerts to undergo the correlation process, the enriched node_id and node_type must be present in the graph database. If the node_id does not exist in the graph database, alerts will remain in a CORRELATING state.
ii ) If an alert (A1) for node N1 is already correlated to an incident (I1), and a new alert (A2) also for node N1 arrives, it will be correlated to the same incident (I1) as long as I1 has not expired or been cleared. If incident I1 has expired or been cleared, alert A2 will be correlated to a new incident (I2) that will be created.
7.4.1 Prerequisites
To ensure successful processing and correlation of alerts with topology information, the following conditions must be fulfilled.
-
GraphDB and Topology Correlation: For an alert policy to include topology correlation, a Graph DB is essential. It must be selected when creating the policy; otherwise, the policy cannot be established, and topology correlation for alerts will not be achieved.
-
Node Identification: For successful Topology Correlation processing, alerts must include
node_idandnode_typeattributes. These attributes are identified using Dataset enrichment or Graph DB enrichment, which are supported in Mapper. -
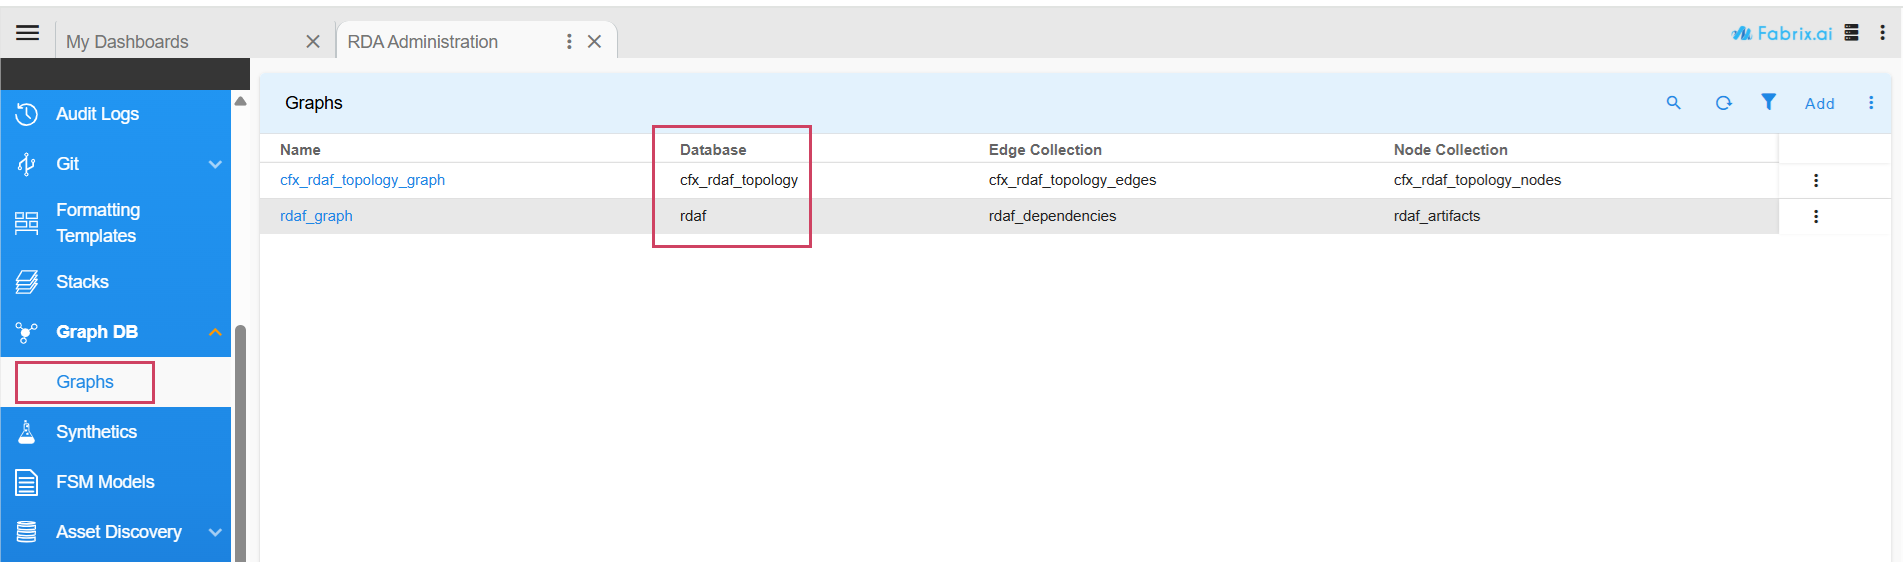
Graph Database Name: The alert mapper must be updated to include the static attribute
graph_db_name, which specifies the database containing the enriched alerts withnode_idandnode_type.
To locate or configure graph_db_name: Navigate through: Home → Configuration → RDA Administration → Graph DB → Graphs
Important
-
Correlation alerts, by design, correlate directly connected nodes even if a relationship map is absent or does not define relations for the node type selected as the parent.
-
LAYER MAPPING IN TOPOLOGY CORRELATION:
- The relationship definition must be expanded to incorporate
layer_mappingat the root, alongside therelation_mapattribute within therelationshipdefinition. This mapping will specify the layer andlayer_precedencefor eachnode_type. The alert with the lowest precedence value will be selected as the parent of the incident. Consequently, the created incident will be updated using the parent alert's message, severity, and layer details.- The topology correlation has been updated to prioritize
layer_precedencewhen selecting a correlation parent. Specifically, during the processing of a batch of alerts fetched from the database, the alert with the lowestlayer_precedenceis now chosen as the correlation parent. If thenode_layerattribute is not available for any alerts in the batch, the system will revert to selecting the first alert in the batch as the correlation parent.Note: To enable alert correlation based on
layer_precedence, you must first perform Layer mapping to apply the necessary layer attribute map. A sample of this layer mapping, as defined within the Relationship Map, is provided below. For more details on the Relationship Map, please click here.- The
layer_precedencemust be uniquely defined within the relationship map for the specifiednode_type``` "layer_mapping": { "Switch": { "layer": "Networking", "layer_id": 0, "layer_precedence": 0 }, "vSwitch": { "layer": "Networking", "layer_id": 1, "layer_precedence": 1 }, "Hypervisor": { "layer": "Networking", "layer_id": 2, "layer_precedence": 2 }, "VM": { "layer": "Application", "layer_id": 7, "layer_precedence": 7 } }, ```
For additional information on RelationshipMap within Graph DB, you can refer to the Graph DB Documentation
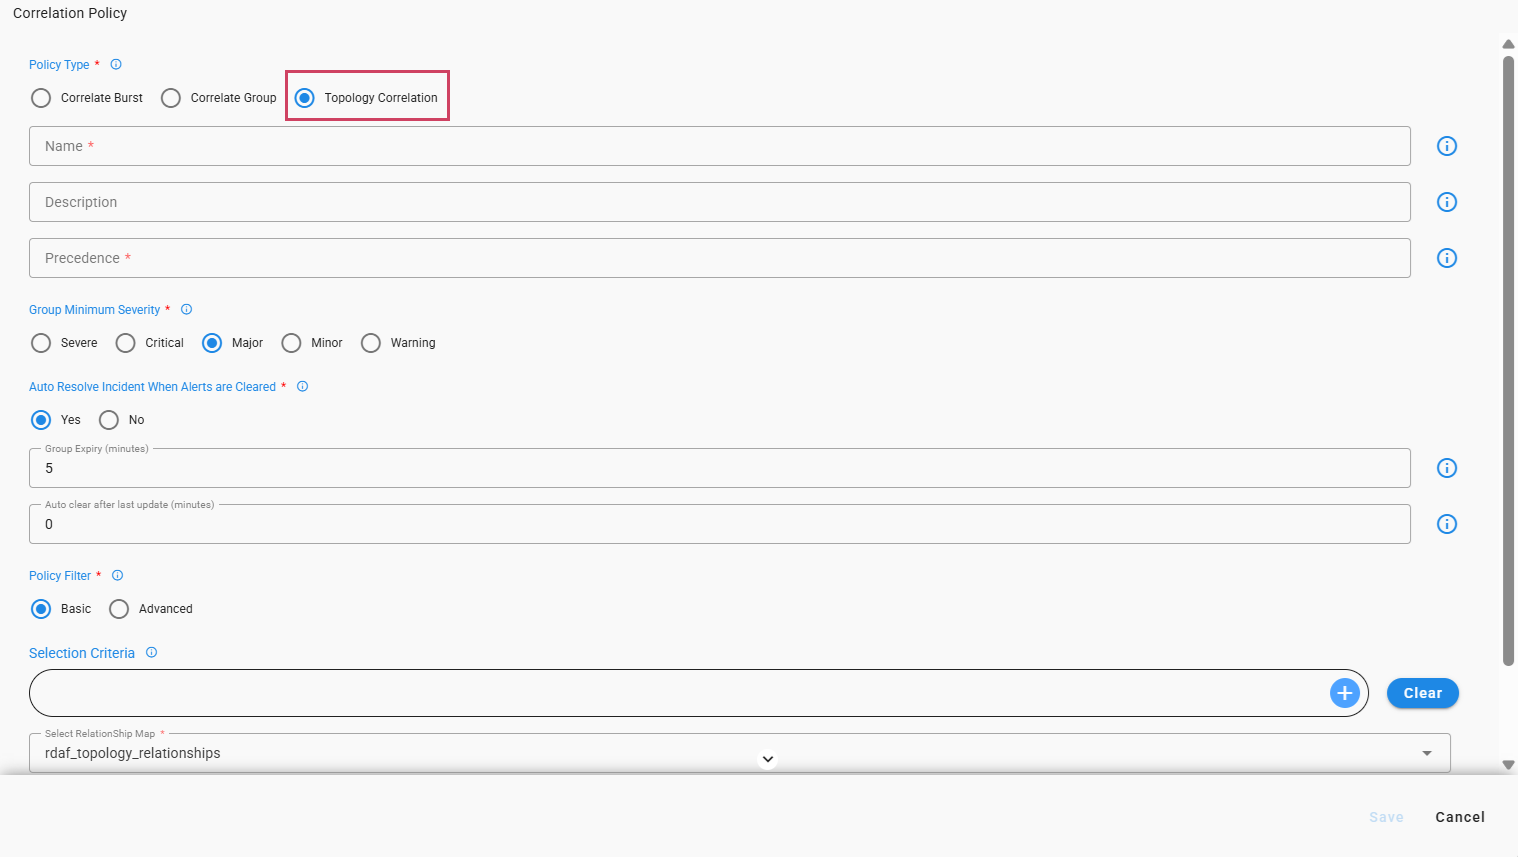
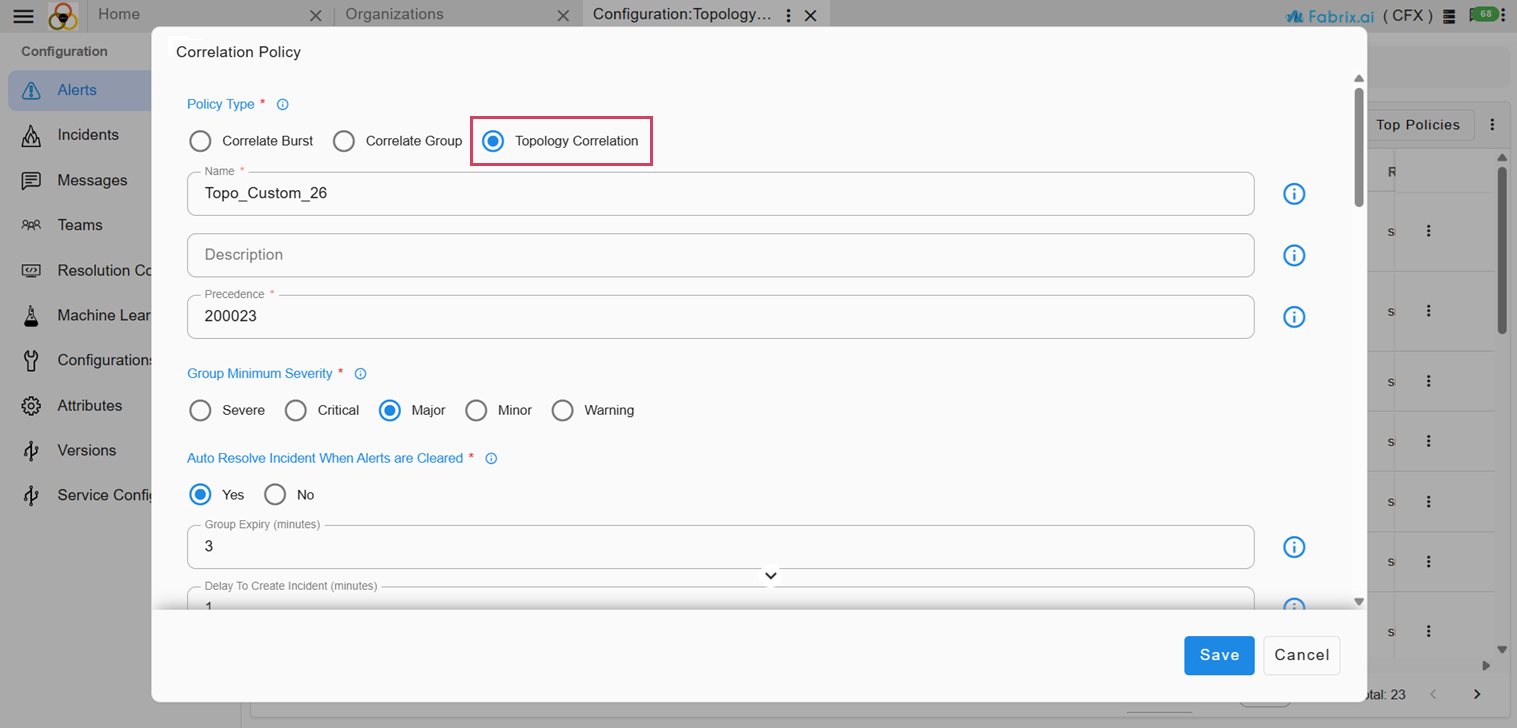
7.4.2 Policy Definition Attributes
7.4.2.1 Precedence
-
Each policy has to be defined with a precedence. Policy applicability happens based on the defined precedence for incoming alerts.
-
Below are the allowed values for precedence:
a) Minimum Value: 10
b) Max Value: 1000000
7.4.2.2 Auto Resolve Incident When Alerts are Cleared
-
When an auto resolve is defined as Yes for a policy, alert-group/incident is auto cleared on clear of all the children alerts.
-
Allowed values are Yes/No
-
When auto resolve is defined as No group will remain active even though all children in the group are CLEARED.
7.4.2.3 Group Expiry
-
Group expiry is defined in minutes, which defines a window for alerts to get correlated to an alert group.
-
For example if group expiry is defined as 15 mins, if a group is created at 10:00 then the group window is opened till 10:15. All the alerts received in between 10:00 to 10:15 are correlated to the group created at 10:00.
Below is the sample explanation on alert group with expiry
Time |
10 minute window | Alerts in Incident | Alert Group State | Incident State |
|---|---|---|---|---|
| 10:03:00 | 2 Alerts raised, Alert Group is created - valid till 10:13:00, Incident is created - Incident 1 | 2 | Open | Open |
| 10:05:00 | 2 Alerts cleared | 2 | Open | Open |
| 10:07:00 | 3 Alerts raised | 5 | Open | Open |
| 10:12:00 | 3 Alerts cleared | 5 | Open | Open |
| 10:13:00 | Alert Group is closed | 5 | Closed | Resolved(If all the children are cleared) |
In the Above Sample Incident 1 is cleared if the group is expired and all the children are cleared in the group. If any one of the children is in ACTIVE state then alert-group/Incident will remain in the open state.
7.4.2.4 Delay To Create Incident (minutes)
- Incident creation is delayed until the defined correlation delay expires. However, if an alert from a lower network layer is received during this time, the incident will be created immediately, bypassing the delay.
7.4.2.5 Auto Clear After Last Update
-
An incident will automatically be cleared if no new alerts are correlated to it within the specified Auto Clear interval.
-
For example, if a correlation group is created at 10:00 and the Auto Clear interval is set to 20 minutes, the group will be automatically cleared at 10:20 unless a new alert is received during that time.
7.4.2.6 Policy Filter
- Please refer to the Policy Filter Field Documentation Here
7.4.2.7 Select RelationShip Map
-
To effectively correlate alerts and understand their topological relationship, select a relationship map. This map uses the node_id and node_type to analyze alerts and determine how they are connected within your system's topology.
-
For more information on the Relationship Map, Click Here.
7.4.2.8 Select Graph
-
Select a Graph, which has topology discovered by Fabrix.ai with the detailed connections and dependencies between various infrastructure components, applications, and services as represented in the topology.
-
For more information on Graph Databases, Click Here.
7.4.2.9 Custom Correlation Parent Script
-
Enable the checkbox to define an inline MAKO script that overrides the built-in correlation parent selection logic.
-
This script runs following the execution of the standard correlation parent selection logic. If the script fails to return a parent, the system's default selection will be utilized.
-
Currently, Topology correlation identifies the primary source of related alerts by verifying topological relationships and selecting the node with the highest precedence. To resolve the environment-specific issues, a mechanism is required to integrate custom logic into the standard correlation process. This will allow for more accurate determination of the appropriate source node for an Incident.
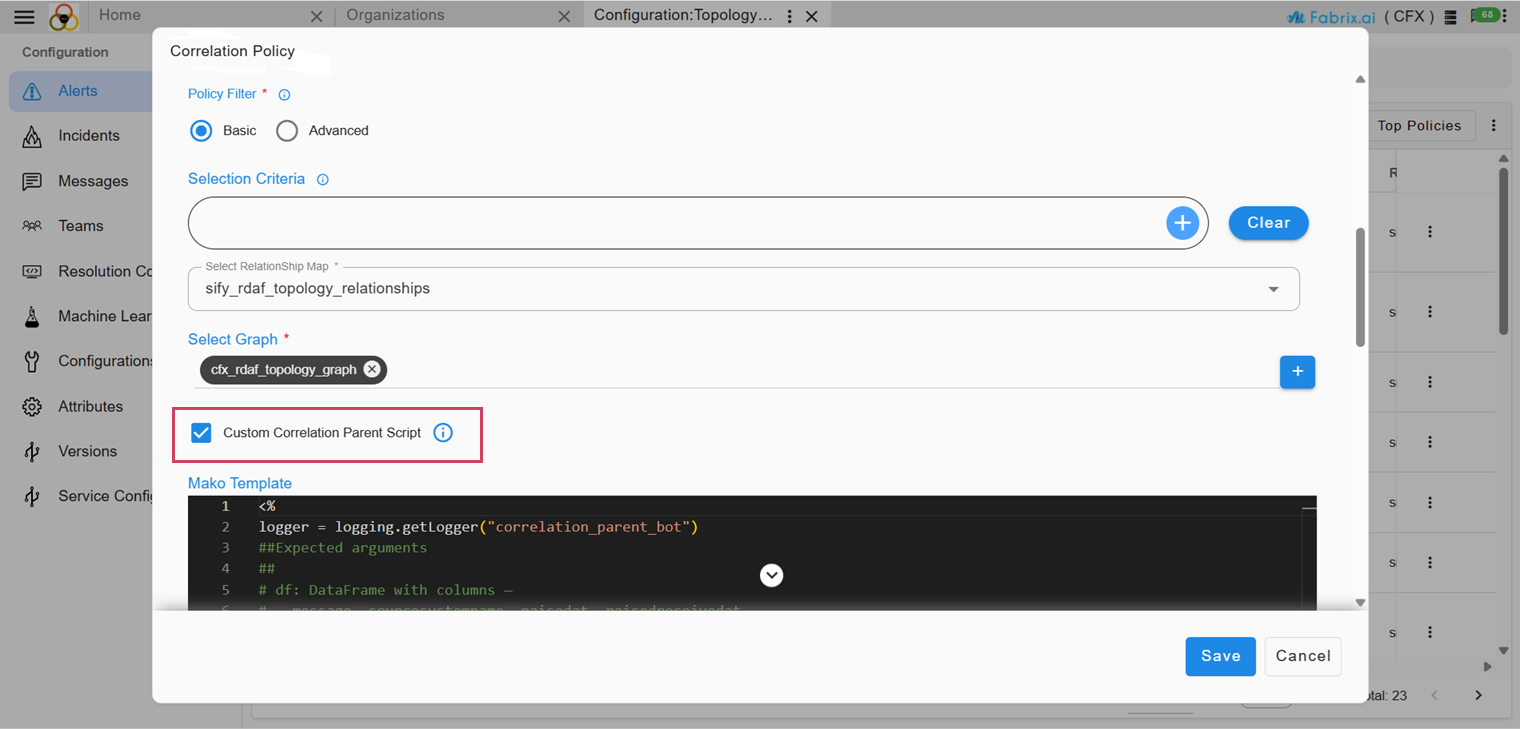
7.4.2.10 MAKO Template
Python editor to define script to define custom correlation parent, note that this script will take precedence over the system-determined parent during incident generation.
What is a MAKO template?
-
A MAKO template consists of a Python-based script that processes specific inputs to generate a defined output.
-
The script identifies and determines the appropriate parent alert using the alerts data passed as input.
Sample MAKO Template
<%
logger = logging.getLogger("correlation_parent_bot")
##Expected arguments
##
# df: DataFrame with columns —
#   message, sourcesystemname, raisedat, raisedreceivedat,
#   severitylabel, sourcestatus, status, assetipaddress,
#   assetid, assetname, node_id, node_type, layer_precedence
#
# action_name: "resolveParent"
SEVERITY_RANK = {
    "SEVERE": 0,
    "CRITICAL": 1,
    "MAJOR": 2,
    "MINOR": 3,
    "WARNING": 4,
    "NOTIFICATION": 5,
    "INFORMATION": 6,
    "UNKNOWN": 9,
    "EVENT": 10,
}
REQUIRED_COLUMNS = {
    "message",
    "sourcesystemname",
    "raisedat",
    "raisedreceivedat",
    "severitylabel",
    "sourcestatus",
    "status",
    "assetipaddress",
    "assetid",
    "assetname",
    "node_id",
    "node_type",
    "layer_precedence",
}


def _fail(reason):
    return [{"rda_status": "Fail", "rda_reason": reason, "parent_alert": None}]


def _severity_rank(label):
    return SEVERITY_RANK.get(str(label).lower().strip(), 5)


def _layer_rank(precedence):
    try:
        return int(precedence)
    except (TypeError, ValueError):
        return 9999


#Method to select based on the sorting the severity and layer_precedence
def _sort_key(row):
    ##Primary: severity (critical wins)
    ##Secondary: layer_precedence (lower int = higher authority, e.g. application > infra)
    return (
        _severity_rank(row.get("severitylabel")),
        _layer_rank(row.get("layer_precedence")),
    )


#Method to select using the message of an alert
def selectParent(row):
    sp = None
    #if 'cfx-oia-cluster-01' in row.get('message'):
    if 'VM' in row.get('message'):
        sp= row
    return sp


def resolveParent(alerts_input_df):
    missing = REQUIRED_COLUMNS - set(alerts_input_df.columns)
    if missing:
        return _fail(f"Missing required columns: {missing}")


    if alerts_input_df.shape[0] == 0:
        return _fail("Empty input data received")


    rows = json.loads(alerts_input_df.to_json(orient="records"))
    if len(rows) == 0:
        return _fail("Empty input data received")
#To determine the parent based on severity and layer precedence, please uncomment the following method.
    #sorted_rows = sorted(rows, key=_sort_key)
    #parent = sorted_rows[0]


#The sample code provided below identifies a parent alert by evaluating its message content.
    parent = None
    for row in rows:
        parent = selectParent(row)
        if parent:
            break

    if parent:
        logger.info(f'resolveParent:: selected node_id={parent.get('node_id')}, severity={parent.get('severitylabel')}, "layer_precedence={parent.get('layer_precedence')}, asset={parent.get('assetname')}')
    else:
        logger.info('NO PARENT SELECTED BY THE SCRIPT')

    return buildResponse(parent)


def buildResponse(parent):
    response = {}
    response["rda_status"] = "Success"
    response["rda_reason"] = None
    response['selected_parent'] = parent
    return [response]


try:
    output["value"] = resolveParent(df)
except Exception as e:
    logger.error(f"Exception processing bot", exc_info=True)
    output["value"] = _fail(f"Exception: {str(e)}")


%>
MAKO Template Input
- The MAKO template script receives a list of alerts in a CORRELATING state along with the current correlation parent as its execution input.
Use the following input payload to test the script from the UI.
MAKO Template Sample Input
{
   "input": [
      {
         "id": "9006c157-45a3-47b4-980b-e560e386ac64",
         "alertkey": "6510a9b6f7fd97b4ca206bb1cbf52fb6",
         "customerid": "eac6f329954944e3a1a9588f314e361f",
         "projectid": "2594ff02-0e59-11f1-af9b-0242ac120006",
         "environmentid": "eac6f329954944e3a1a9588f314e361f",
         "assetid": "R5-N6K-01_FOC2124R0S6",
         "componentid": "40ba7c39-7bd5-42d0-948f-8cd3afd75adf",
         "alertcategory": "Switch",
         "alerttype": "Memory Pool Usage",
         "severity": 2,
         "assettype": "switch",
         "componenttype": "switch",
         "assetipaddress": "10.95.133.60",
         "assetname": "cfx-qa-VM-VDS-LACP",
         "componentname": "Processor",
         "sourcemechanism": "SNMP",
         "sourceeventid": "5650c095-2ad0-423c-a583-7bdd92ea7fbb",
         "eventid": "a909f8ce-3163-4c06-82b2-23d809ff5eb8",
         "status": "CORRELATING",
         "sourcestatus": "ACTIVE",
         "message": "R5-N6K-01 Swtich is down with critical",
         "createdby": "OIA",
         "updatedby": "OIA",
         "sourceeventreceivedat": 1782892758524,
         "raisedreceivedat": 1782892758524,
         "lastraisereceivedat": 1782892758524,
         "createdat": 1782892767090,
         "updatedat": 1782892767103,
         "raisedat": 1572431646363,
         "sourcesystemname": "Pulse-Topo",
         "sourcesystemtype": "Webhook HTTP Service",
         "sourcesystemid": "944864d2-3c93-4ed5-8e55-32d5b518f7a9",
         "iscorrelationparent": 0,
         "correlationparent": null,
         "attributes": "{\"mapper_id\": \"3db79487-dbed-4e13-9575-a50bbfcbf5b1\", \"alertDeepLink\": \"https://10.95.159.64/ui/index.action#configure/alerts/outbound-settings/instances\", \"graph_db_name\": \"cfx_rdaf_topology\", \"node_type\": \"Switch\", \"stack_name\": \"cfx_rdaf_topology\", \"node_id\": \"R5-N6K-01\", \"matched_graphdbs\": \"cfx_rdaf_topology\", \"node_label\": \"R5-N6K-01\", \"rda_pstream_id\": \"82b5dc7ee803cd94c7d0abe96bb57b9f\"}",
         "groupKey": "5319e39c933cb62a00d7af36245622de",
         "node_id": "R5-N6K-01",
         "node_type": "Switch",
         "node_md5_hash": "33076563170297036a14df1d3dcc3ea7",
         "layer_precedence": 0
      }
   ],
   "params": {
      "existing_correlation_parent": {
         "id": "1183f258-3bcc-4729-b01b-34d58e2bce8b",
         "alertkey": "5319e39c933cb62a00d7af36245622de",
         "customerid": "eac6f329954944e3a1a9588f314e361f",
         "projectid": "2594ff02-0e59-11f1-af9b-0242ac120006",
         "environmentid": "eac6f329954944e3a1a9588f314e361f",
         "assetid": "5b6845fd-c5ce-4426-b579-362d7c21a03b-1782892305477",
         "componentid": "5b6845fd-c5ce-4426-b579-362d7c21a03b_R5-N6K-01",
         "alertcategory": "Switch",
         "alerttype": "Topo_Cor_No",
         "severity": 2,
         "assettype": "switch",
         "assetipaddress": "10.95.133.60",
         "assetname": "Topo_Cor_No-2026-07-01 07:51:24.011000",
         "componentname": "Topo_Cor_No",
         "sourcemechanism": "CORRELATION",
         "sourceeventid": "5820c146-2852-41ff-a07a-ca93b42dbb99",
         "status": "ACTIVE",
         "sourcestatus": "ACTIVE",
         "message": "R5-N6K-01 Swtich is down with critical",
         "severitylabel": "MAJOR",
         "createdat": 1782892305477,
         "updatedat": 1782892305654,
         "raisedat": 1782892305477,
         "correlationparentexipredat": 1782892905477,
         "incidentid": "CFX20260701488371169d",
         "sourcesystemname": "Alert Group",
         "sourcesystemid": "Alert Group",
         "iscorrelationparent": 1,
         "causenotes": "Alerts for 600 seconds",
         "site": "CFX20260701488371169d_batch_20260701075145293180",
         "attributes": "{\"mapper_id\": \"3db79487-dbed-4e13-9575-a50bbfcbf5b1\", \"alertDeepLink\": \"https://10.95.159.64/ui/index.action#configure/alerts/outbound-settings/instances\", \"graph_db_name\": \"cfx_rdaf_topology\", \"node_type\": \"Switch\", \"stack_name\": \"cfx_rdaf_topology\", \"node_id\": \"R5-N6K-01\", \"matched_graphdbs\": \"cfx_rdaf_topology\", \"node_label\": \"R5-N6K-01\", \"rda_pstream_id\": \"489bf219b1b53287ca3f126e4cc1c447\", \"layer_id\": 0, \"layer_name\": \"Networking\", \"layer_precedence\": 0, \"assignment_groups\": [], \"alert-asset-name\": \"cfx-qa-VM-VDS-LACP\", \"incidentAnalytics\": {\"alert_sources\": \"Pulse-Topo\", \"alerts\": 1}}"
      }
   }
}
MAKO Template Output
- The script's output determines whether the execution was a success or failure and identifies the selected parent alert. If no parent is designated, a value of "None" can be returned. In cases where "None" is returned, the system defaults to using its own correlation parent selection logic for the alert.
MAKO Template Sample Output
Run Test
- Executes the custom Python script using the provided input data to test the logic.
Verify
- Validates the Python code's syntax and structure. This process compiles the script, identifies potential compilation errors, and reports any issues to ensure functional integrity prior to saving.
Format
- Automatically formats the Python script, applying standard indentation and coding conventions to enhance readability and maintainability.
Imports
Sample Script Imports
- Below are the essential modules for executing the Python script. These default imports are automatically added when a new template is initialized:
MAKO Template Sample Script Imports
Sample Input
- Utilize this sample input to test the script and confirm the logic before its application to alerts.
7.5 Correlation Burst Policy
The Correlation Burst policy is designed to manage clusters of alerts generated within a defined time window (for example, 60 seconds). If the number of alerts within this period reaches or exceeds a set threshold (such as 10 alerts), the burst criteria is met. Alerts can be filtered using policy filters and grouped using the GROUP BY options in the correlation policy configuration.
Path to create a Correlation Burst policy : Configuration → Apps Administration → Project Settings → Alerts → Correlation Policies → Create New Correlation Policy
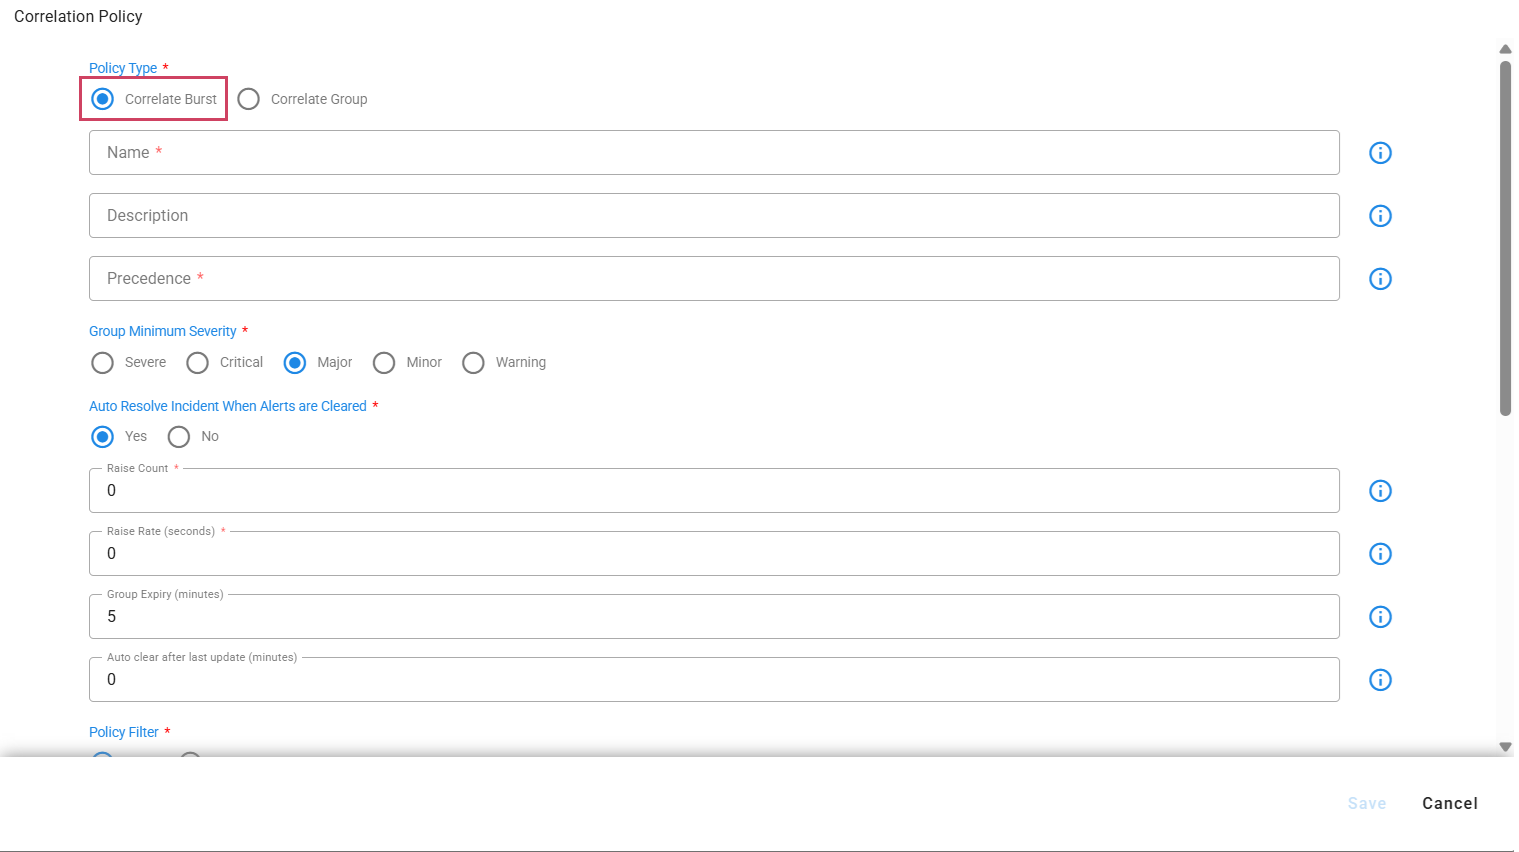
7.5.1 Policy Definition Attributes
7.5.1.1 Precedence
-
Each policy has to be defined with a precedence. Policy applicability happens based on the defined precedence for incoming alerts.
-
Below are the allowed values for precedence:
a) Minimum Value: 10
b) Max Value: 1000000
7.5.1.2 Auto Resolve Incident When Alerts are Cleared
-
When an auto resolve is defined as Yes for a policy, alert-group/incident is auto cleared on clear of all the children alerts.
-
Allowed values are Yes/No
-
When auto resolve is defined as No group will remain active even though all children in the group are CLEARED.
7.5.1.3 Raise Count
- Number of alerts raised by the source system when a burst happens.
7.5.1.4 Raise Rate(Seconds)
- A burst event is identified when the specified time window (e.g., 60 seconds) reaches or exceeds the minimum number of alerts (e.g., 10 alerts) issued by the source system, with all alerts being correlated to a single incident.
7.5.1.5 Group Expiry
-
Group expiry is defined in minutes, which defines a window for alerts to get correlated to an alert group.
-
For example if group expiry is defined as 15 mins, if a group is created at 10:00 then the group window is opened till 10:15. All the alerts received in between 10:00 to 10:15 are correlated to the group created at 10:00.
Below is the sample explanation on alert group with expiry
Time |
10 minute window | Alerts in Incident | Alert Group State | Incident State |
|---|---|---|---|---|
| 10:03:00 | 2 Alerts raised, Alert Group is created - valid till 10:13:00, Incident is created - Incident 1 | 2 | Open | Open |
| 10:05:00 | 2 Alerts cleared | 2 | Open | Open |
| 10:07:00 | 3 Alerts raised | 5 | Open | Open |
| 10:12:00 | 3 Alerts cleared | 5 | Open | Open |
| 10:13:00 | Alert Group is closed | 5 | Closed | Resolved(If all the children are cleared) |
In the Above Sample Incident 1 is cleared if the group is expired and all the children are cleared in the group. If any one of the children is in ACTIVE state then alert-group/Incident will remain in the open state.
7.5.1.6 Auto Clear after last update
-
Auto clear an Incident happens if no new alerts gets correlated to the incident till the prescribed Auto clear interval.
-
For example if a correlation group is created at 10:00 and auto clear is defined as 20 minutes then the group will be auto cleared if no alert is received until next 20 minutes(i.e 10:20).
7.5.1.7 Policy Filter
- Please refer to the Policy Filter Field Documentation Here
7.5.1.8 Group By
- Policies can be configured with multiple attributes as grouping criteria. Unique incidents will be generated based on these specified group-by attributes.
8. Alert Suppression
8.1 Suppression Policy
-
Alerts can be suppressed from a source when no action is required. It's also possible to suppress alerts for a defined period by setting a schedule and filters. Once the suppression window expires, these alerts will be revived.
-
For instance, during application downtime, an alert monitoring system might generate alerts that don't require action from the admin team; these can be suppressed by configuring suppression policies.
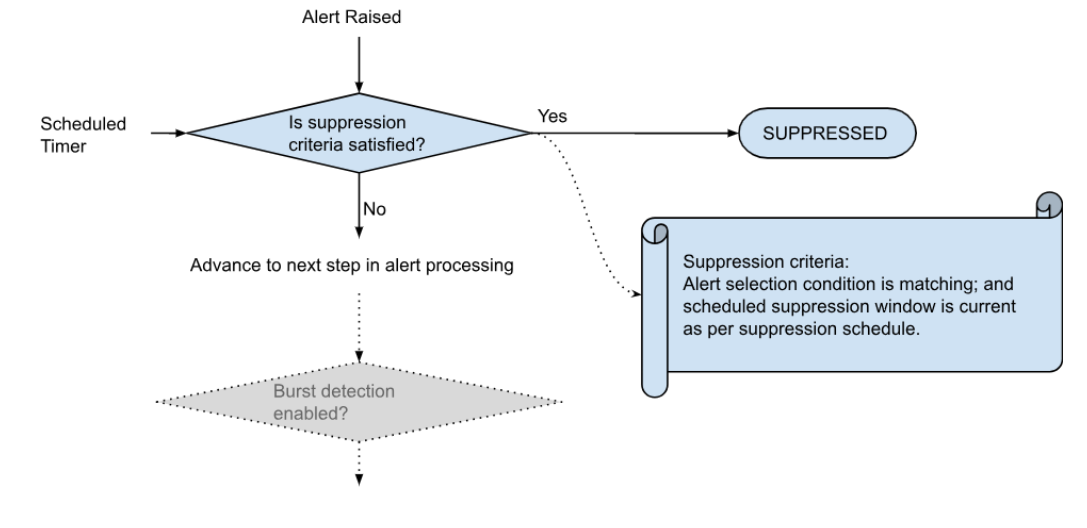
Suppression Policy Flow Diagram
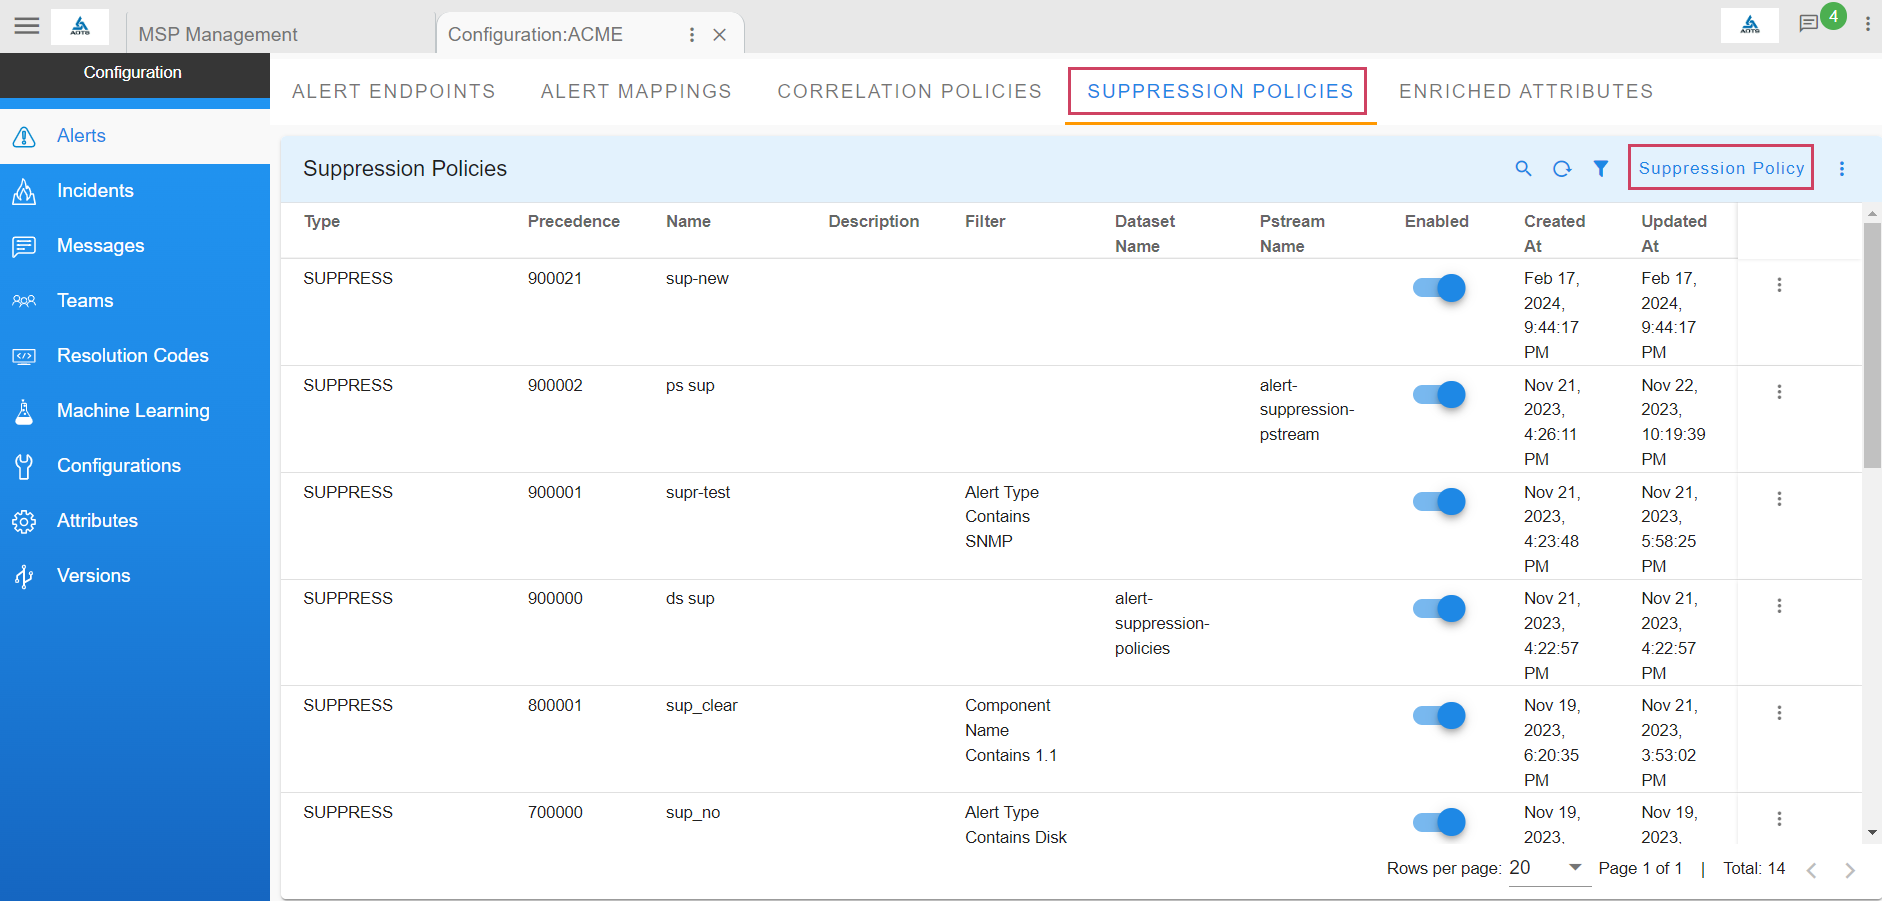
Go to Home --> Administration --> Organization --> Click on Configure --> SUPPRESSION POLICIES --> Click on Suppression Policy
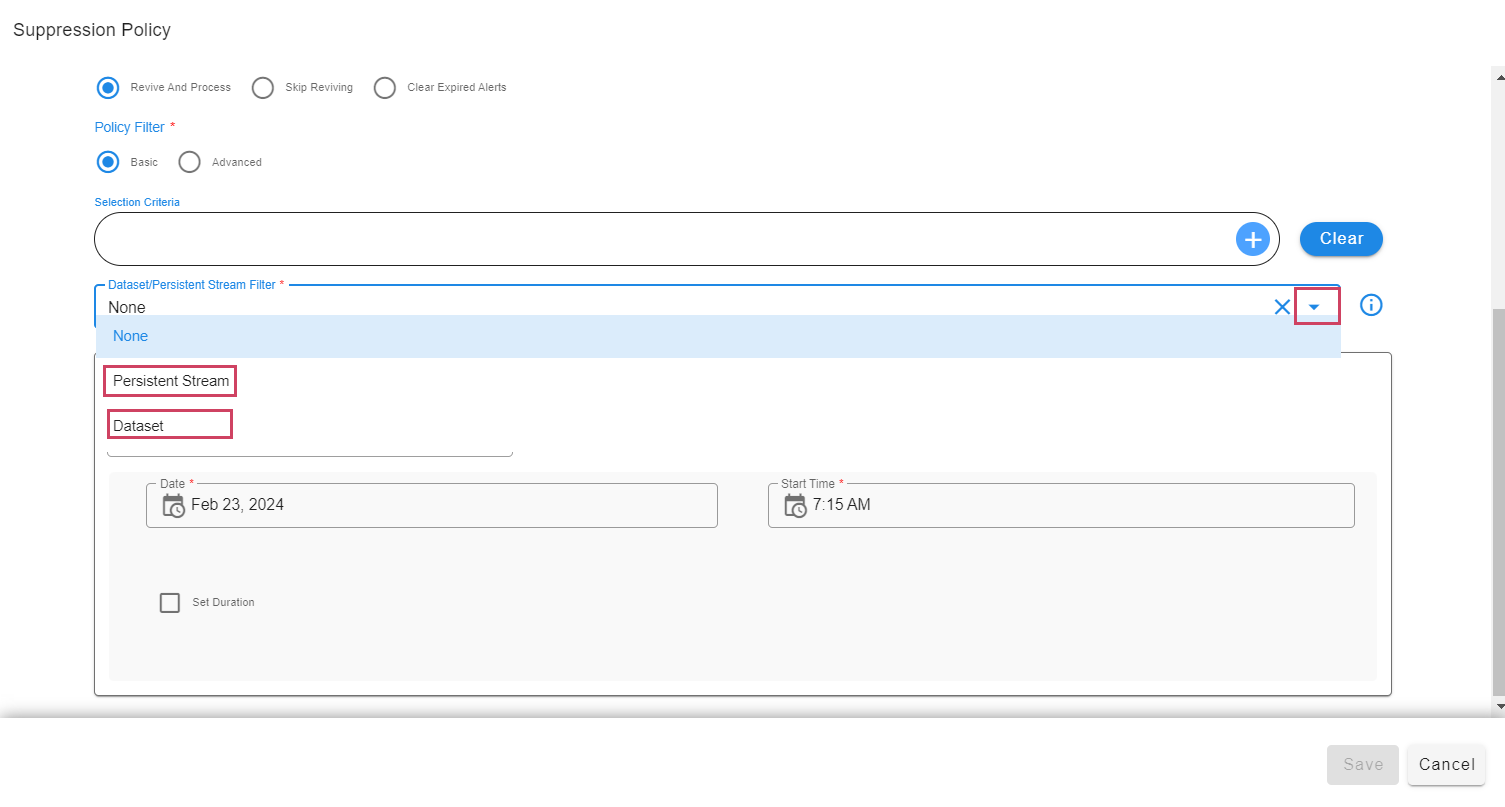
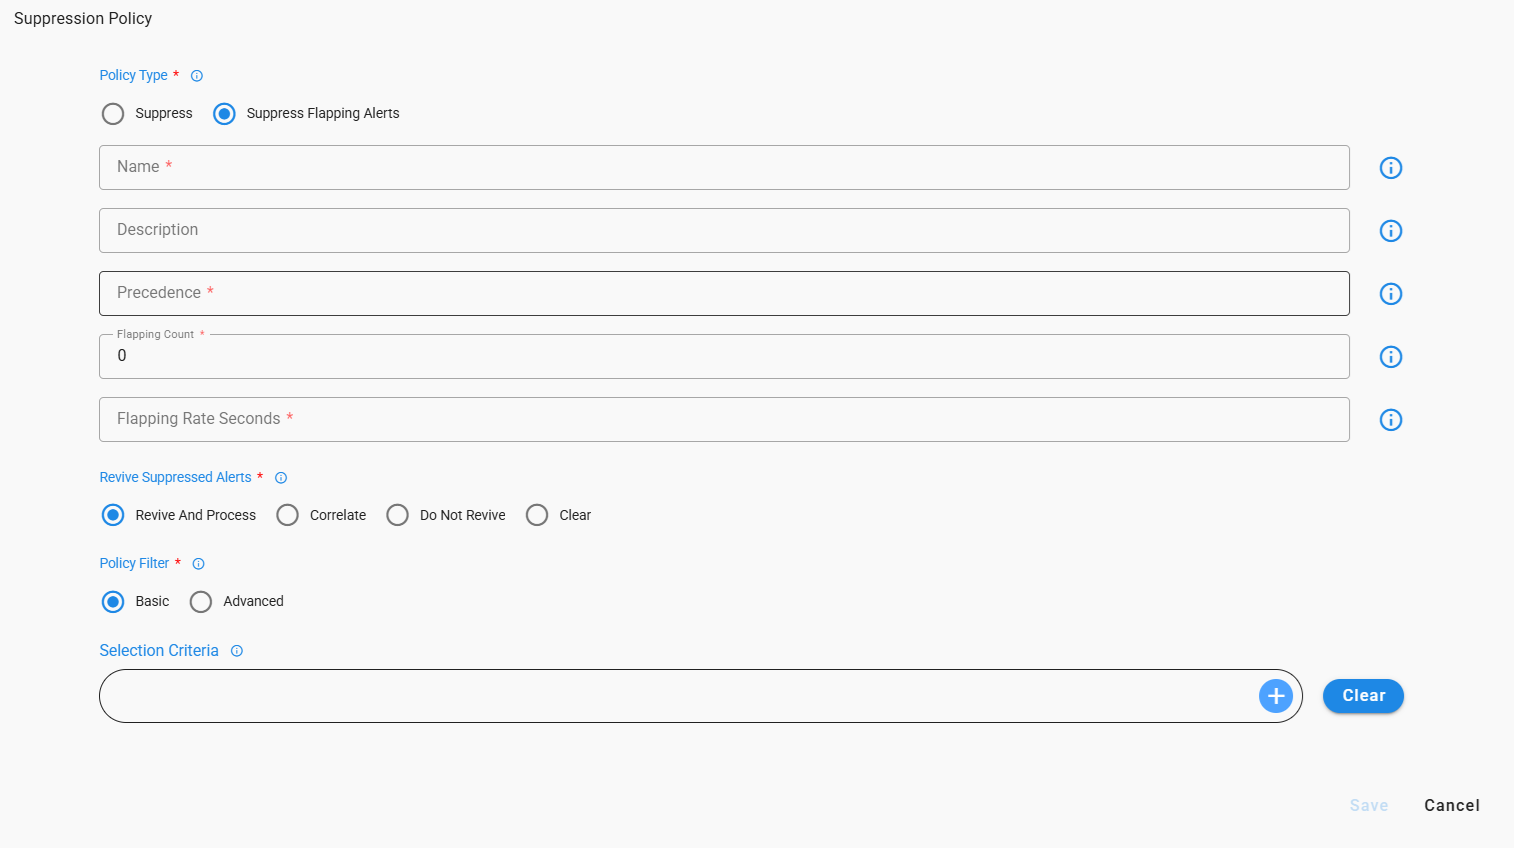
Suppression Policy Form
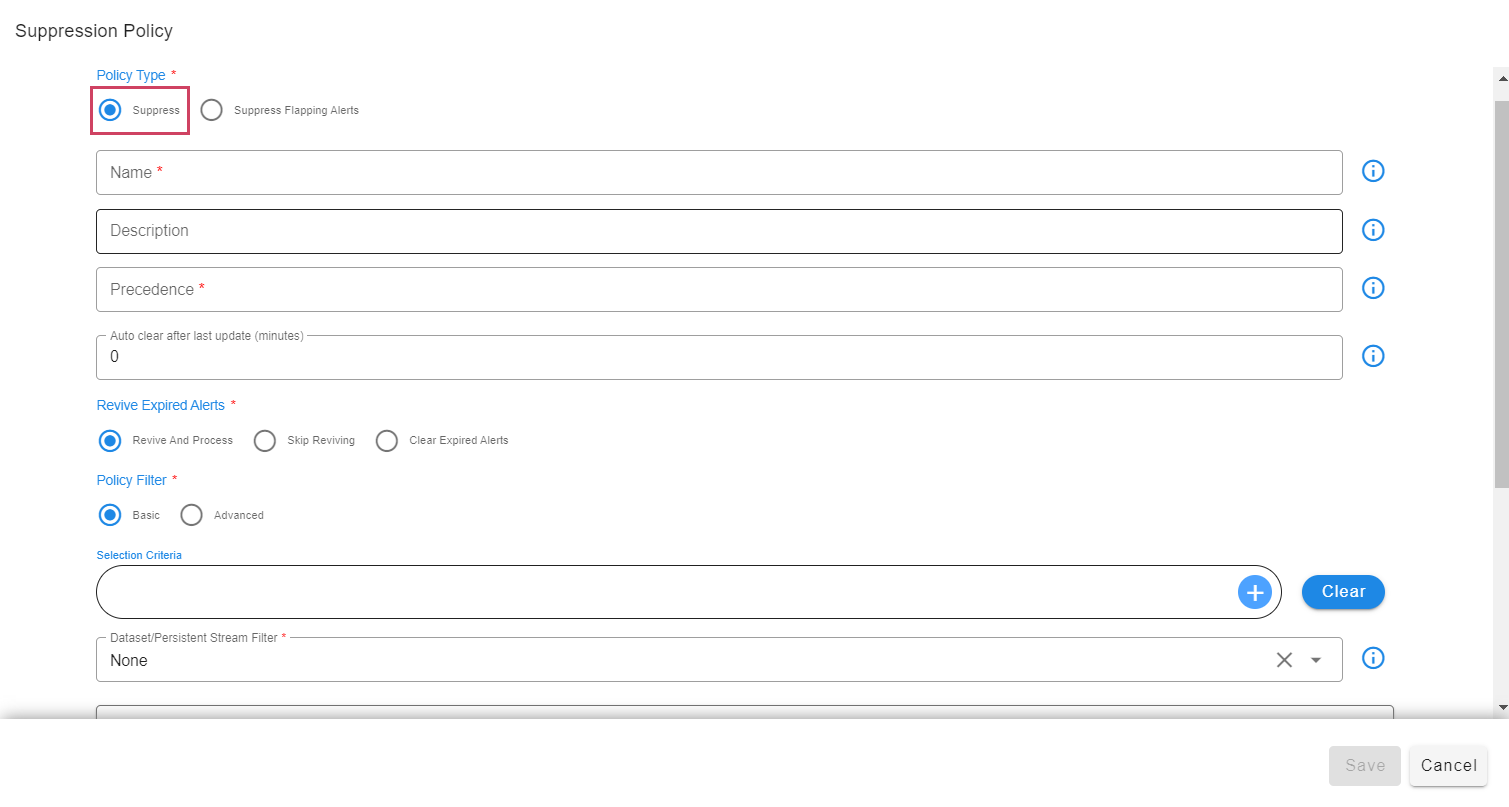
8.1.1 Defining Suppression Policy
8.1.1.1 Policy Type
- Select Policy Type as Suppress in order to Create a suppression policy.
8.1.1.2 Precedence
-
Each policy has to be defined with a precedence. Policy applicability happens based on the defined precedence for incoming alerts.
-
Below are the allowed values for precedence:
a) Minimum Value: 10
b) Max Value: 1000000
8.1.1.3 Revive Expired Alerts
-
Suppressed alerts are revived once the suppression window is expired to further process alert either to correlate or create an incident.
-
User can control the revival process of suppressed alerts using below options
a) Revive And Process: Revives and processes alerts, applying all Suppression/Correlation policies.
b) Correlate: Applies Correlation Policies, skipping Suppression policies, to create incidents for alerts.
c) Do Not Revive: Prevents the revival of suppressed alerts.
d) Clear: Clears any suppressed alerts that have been revived.
Note
For more information on Policy Filters, Filter Attributes & Enriched Attributes please Click Here
8.1.1.4 Dataset/Persistent Stream Filters
-
We can define Dataset/Pstream based filter additional to the Basic/Advanced filters.
-
Select option to use Dataset/PStream filter for a policy
8.1.1.4.1 Dataset Filter
-
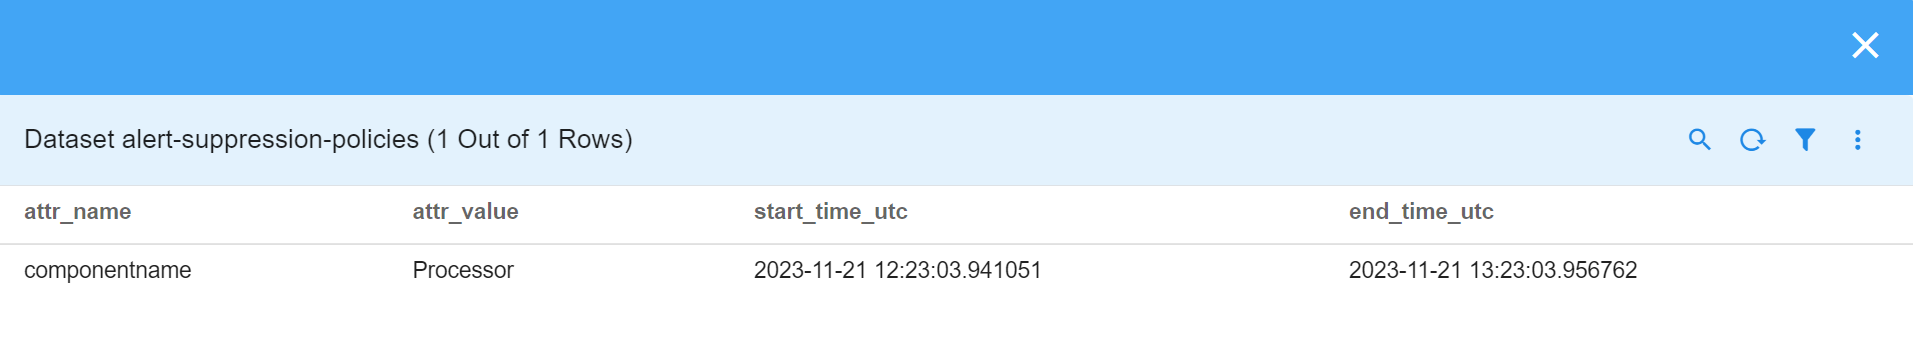
Dataset filter is used to suppress alerts for the defined duration using start_time and end_time for a particular attribute with multiple attribute values.
-
Each dataset can contain only one attribute on which a filter can be applied, for example if a dataset is created with attr_name ip address attribute then the dataset can have different values with start_time and end_time with different attribute values.
-
Sample structure of the dataset filter is below:
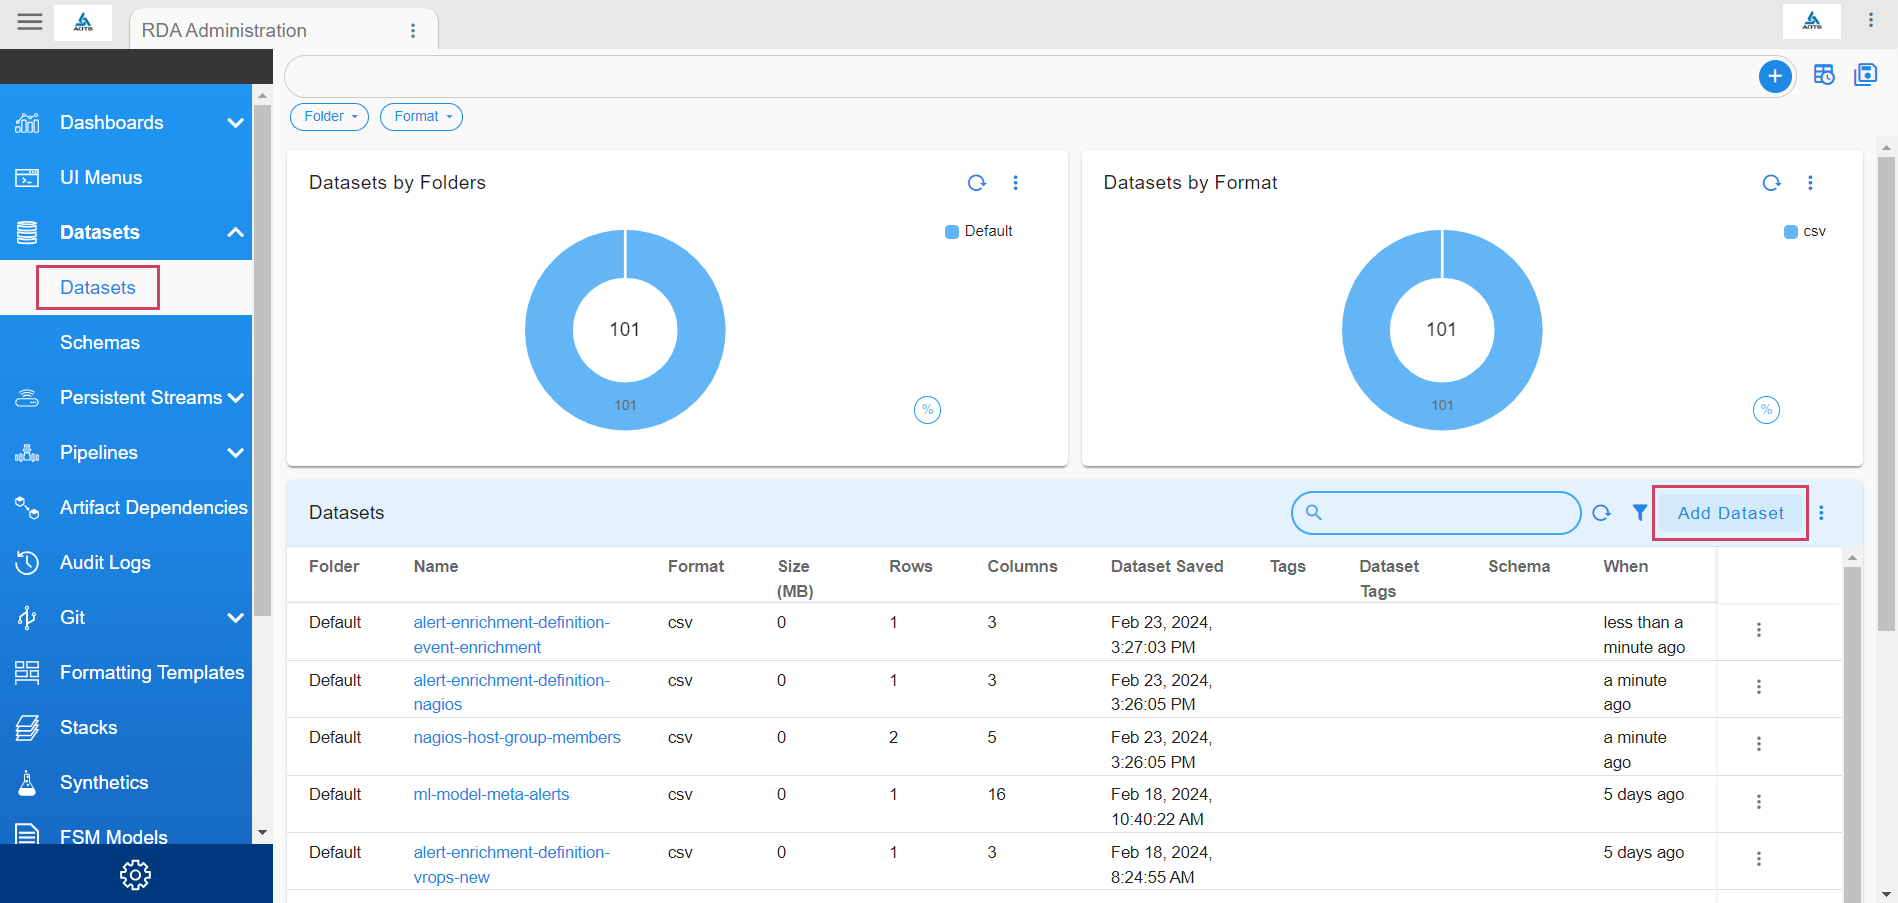
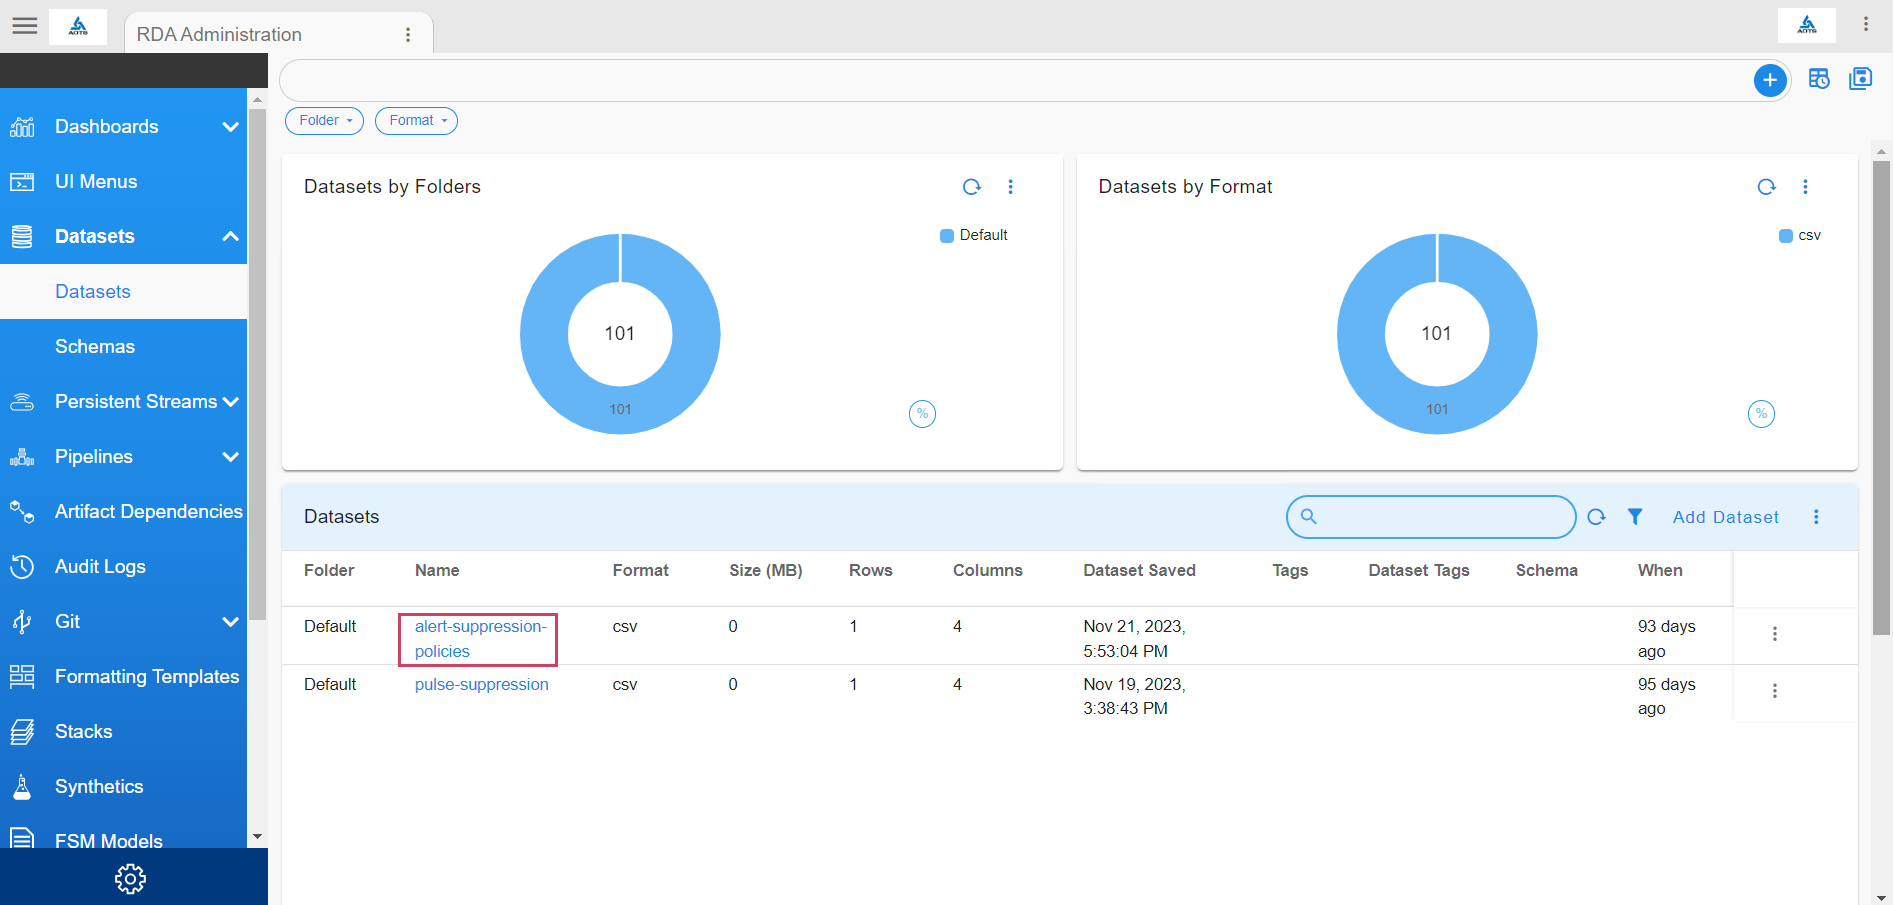
Dataset can be created in couple of ways:
- Upload a csv or json file with the defined structure from path Go to Configuration -> RDA Administration -> Dataset -> Datasets -> Add Dataset.
- We can create a dataset using a pipeline. Sample pipeline definition to create a dataset:
@dm:empty columns="attr_name,attr_value,start_time_utc,end_time_utc"

--> @dm:addrow attr_name = 'componentname' and attr_value = 'Processor'

--> @dm:map to="start_time_utc" and func="evaluate" and expr="utcnow()"

--> @dm:map to="end_time_utc" and func="evaluate" and expr="utcnow() + timedelta(minutes=60)"

--> @dm:save name="alert-suppression-policies"
Reference for building a pipeline please Click Here
- A dataset filter can be applied with the combination of Basic Filter
8.1.1.4.2 Persistent Stream Filter
-
PStream filter is used to suppress alerts for the defined duration using start_time and end_time for a particular attribute with multiple attribute values.
-
PStream can contain only one attribute on which a filter can be applied, for example if a pstream is created with attr_name ip address attribute then the dataset can have different values with start_time and end_time with different attribute values.
Sample structure of the dataset filter is below:
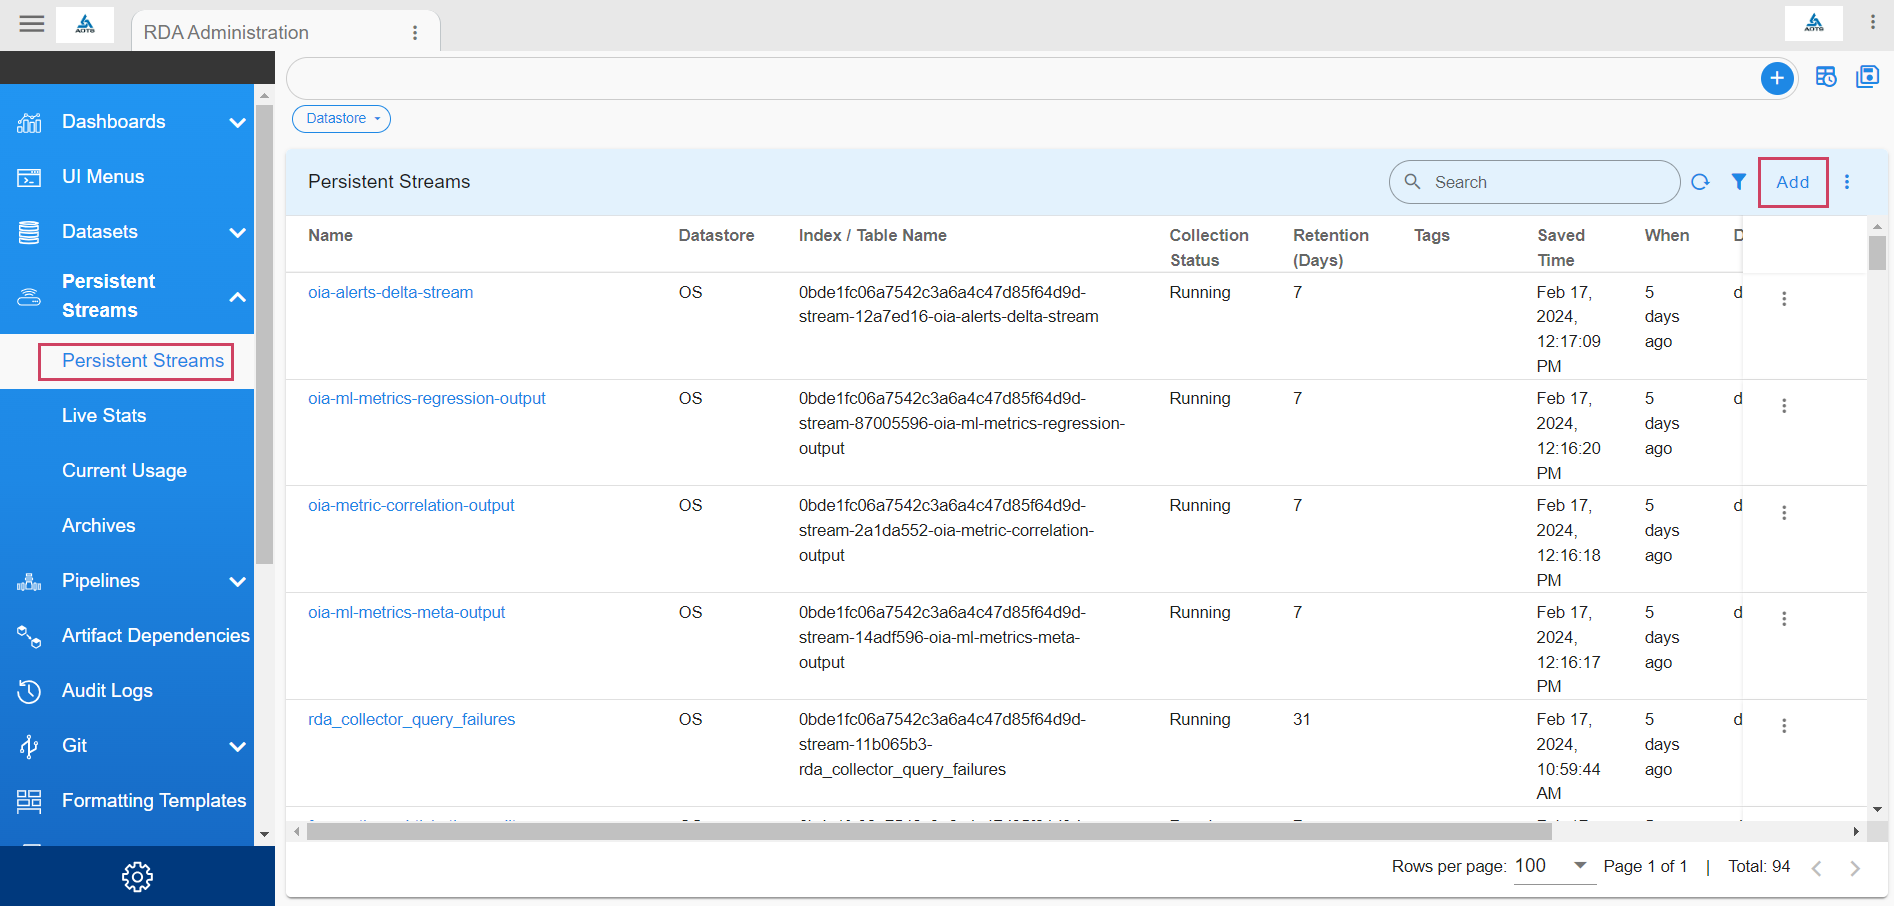
- Create a PStream Go to Configuration ->RDA Administration -> Persistent Streams -> Persistent Streams -> Add
We need to specify the attribute name the pstream will be holding the data while creating a pstream. Below is the sample structure of adding an attribute to the pstream meta-data.
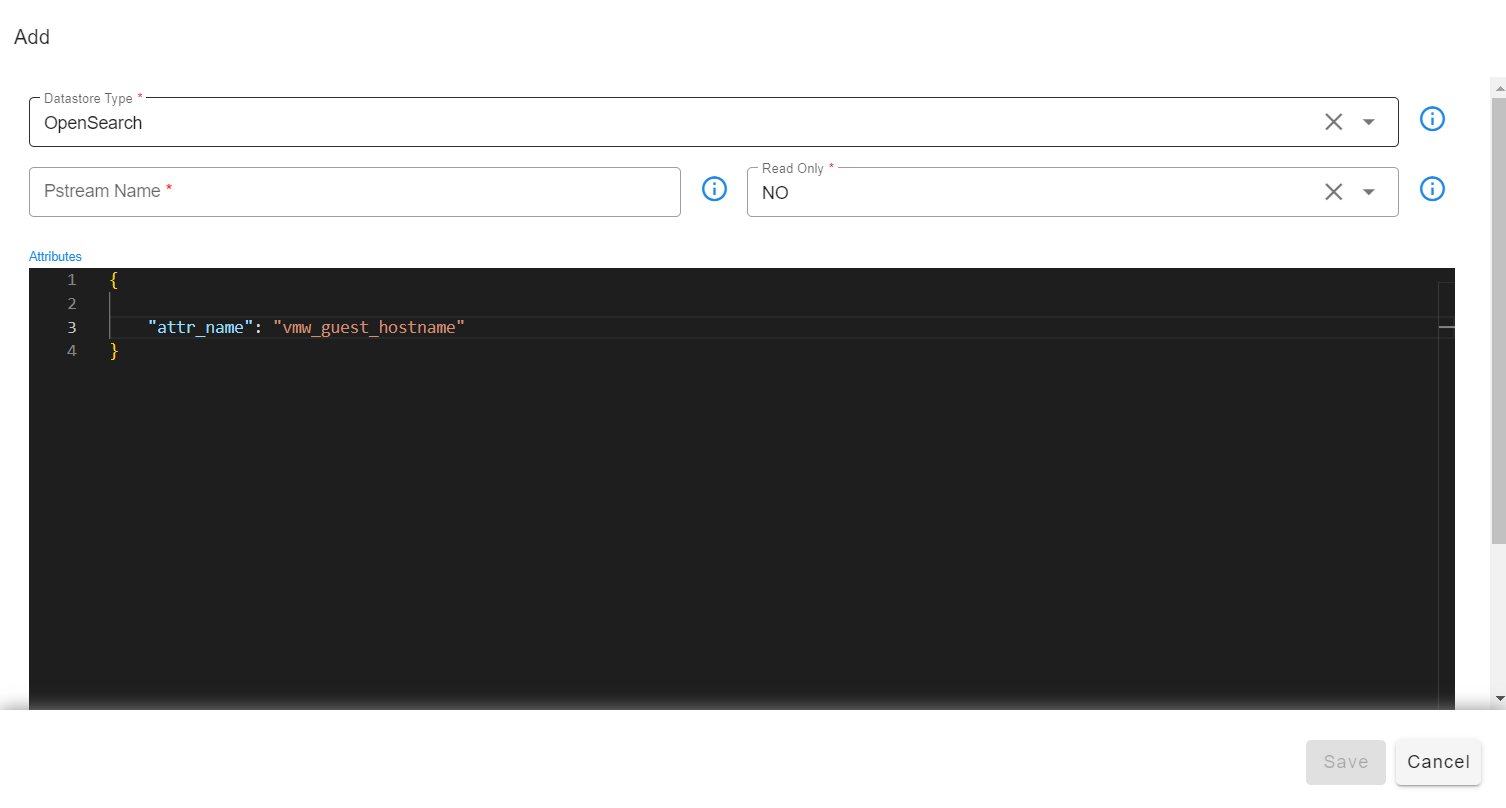
-
Defining the attribute name while creating the pstream is necessary, as the pstream filtering will be done based on the attr_name defined while creating the pstream.
-
Data to the pstream can be written using a pipeline. Sample pipeline to write data to the pstream is below
@dm:empty columns="attr_name,attr_value,start_time_utc,end_time_utc"

--> @dm:addrow attr_name = 'componentname' and attr_value = 'Processor'

--> @dm:map to="start_time_utc" and func="evaluate" and expr="utc_time_now_as_isoformat()"

--> @dm:map to="end_time_utc" and func="evaluate" and expr="(utcnow() + timedelta(minutes=60)).isoformat()"

--> @rn:write-stream name="alert-suppression-policies"
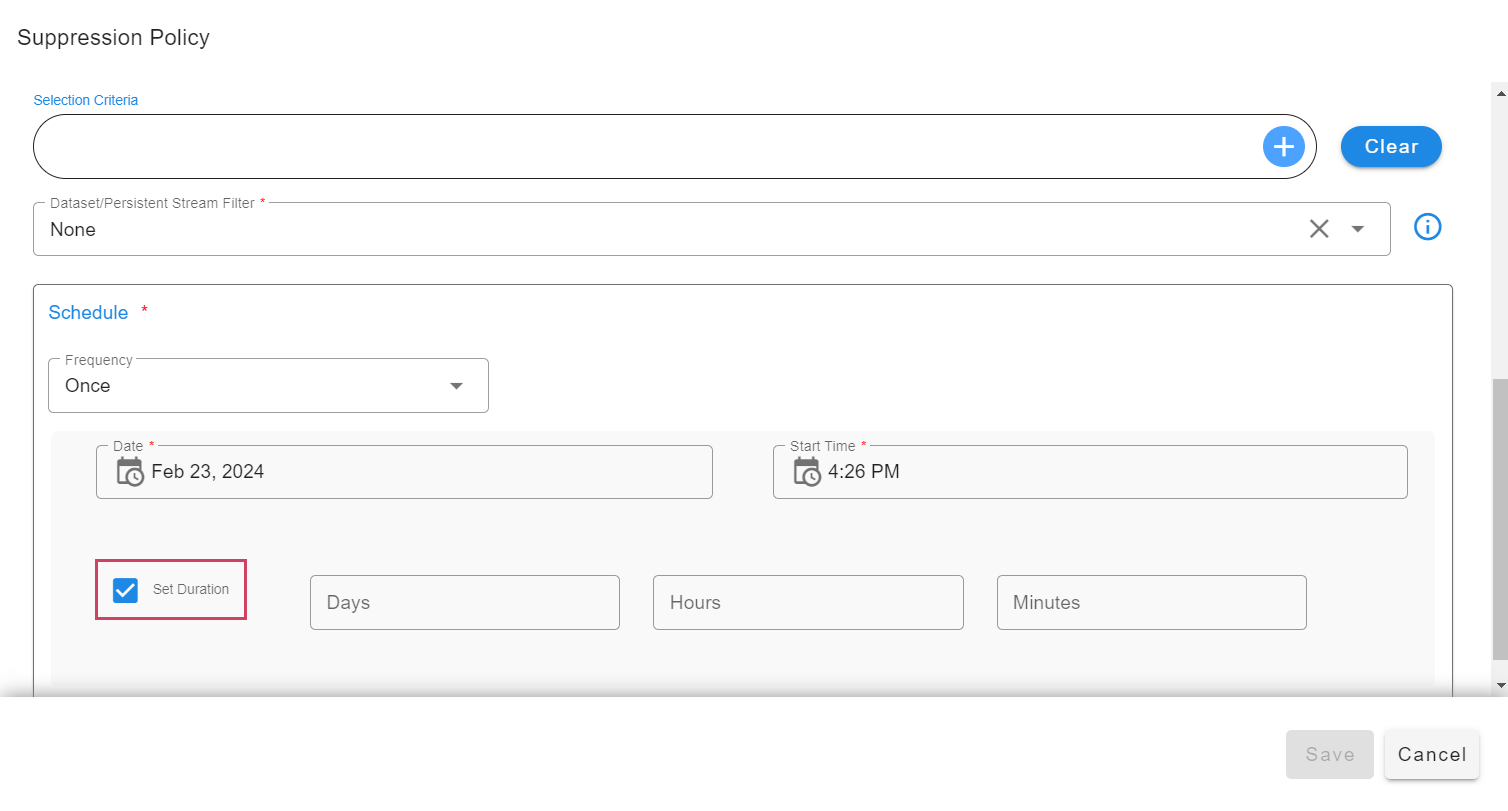
8.1.1.5 Schedule
-
We can define a schedule and duration for a policy using the Schedule option.
-
Incoming alerts will be suppressed for the defined schedule duration and gets revived once the duration is elapsed based on the Revive Expired Alerts configuration.
-
Supported schedule Frequency
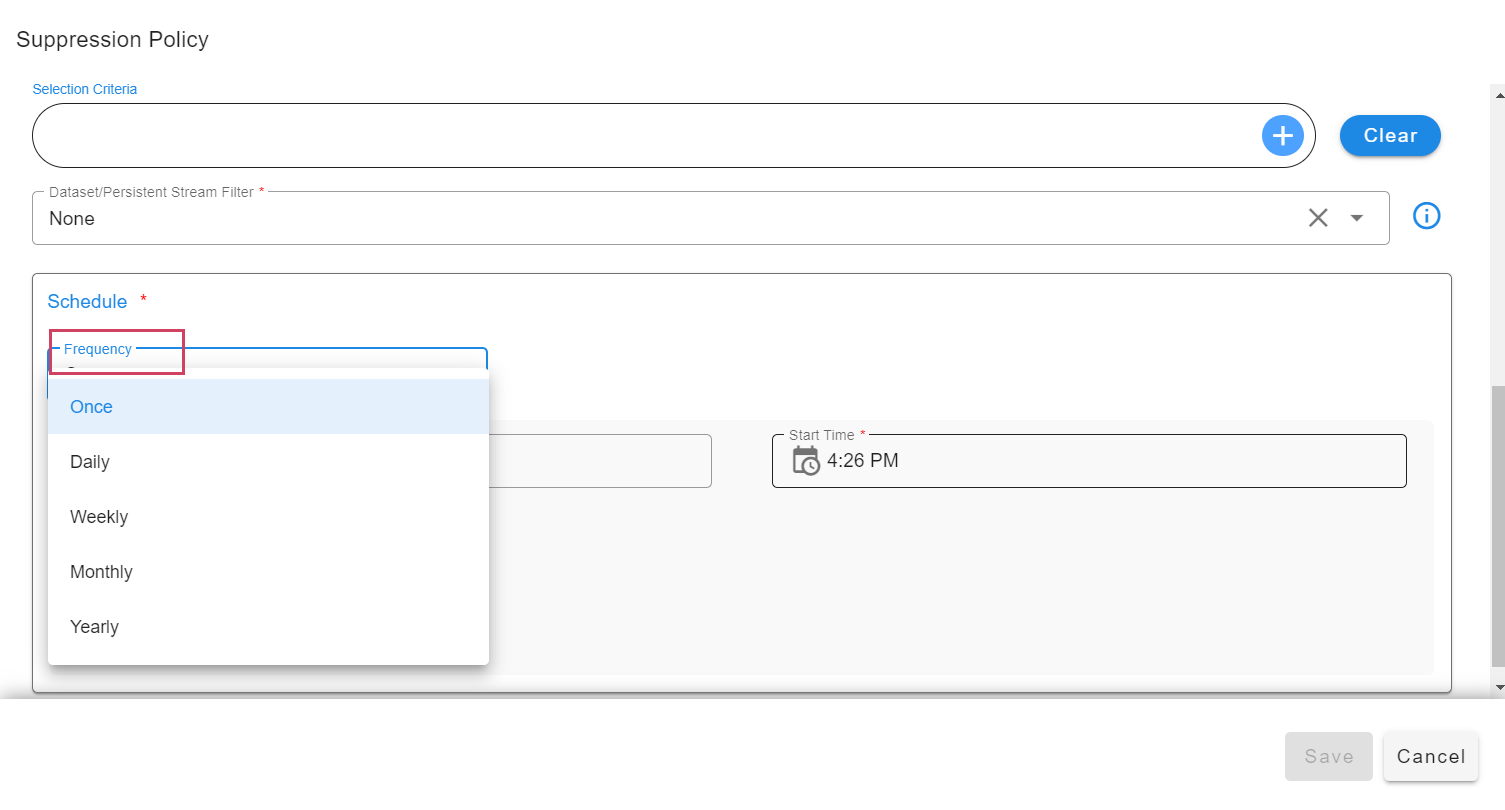
- Schedule can have duration along with the start time. Duration can be configured to suppress alerts for the specified amount of time. For example, if a schedule frequency is defined as once and duration is specified as below, then alerts will be suppressed for 10 days and 2 hours starting from the given start time of the schedule.
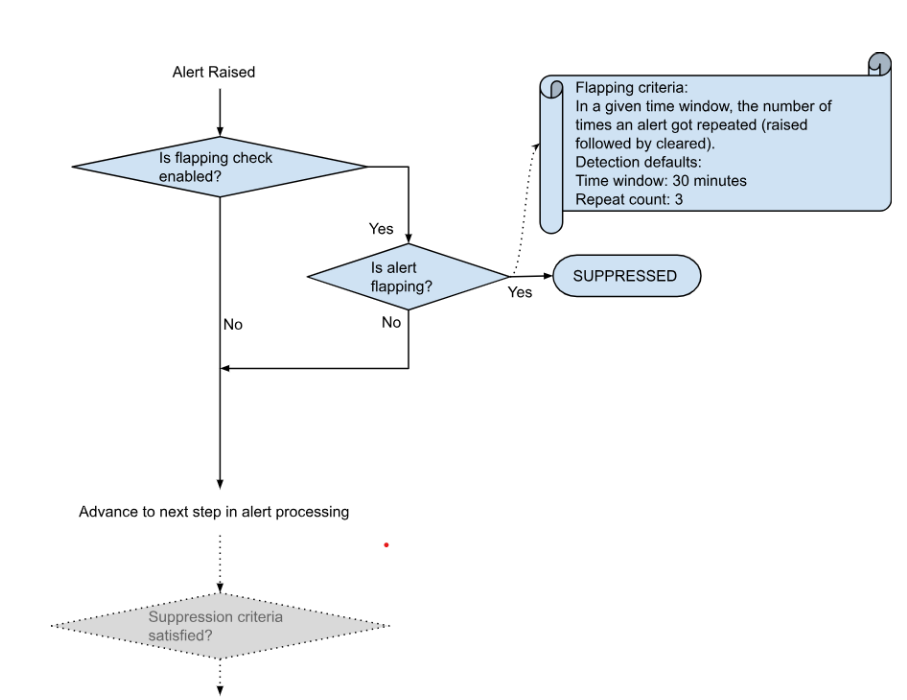
8.2 Flapping Policy
Alerts can be suppressed from a source when no action is required, particularly during flapping events.
These suppressed alerts will reactivate once the suppression window expires.
For example, if a VM goes offline and online repeatedly due to scheduled maintenance and the system keeps triggering alerts, you can apply a Suppress Flapping Policy.
Flapping Policy Flow Diagram
Go to Home --> Administration --> Organization --> Click on Configure --> SUPPRESSION POLICIES --> Click on Suppression Policy --> Select Suppress Flapping Alerts
Suppression Policy Form
8.2.1 Policy definition Attributes
8.2.1.1 Policy Type
- Select Policy Type as Suppress in order to Create a suppression policy.
8.2.1.2 Precedence
-
Each policy has to be defined with a precedence. Policy applicability happens based on the defined precedence for incoming alerts.
-
Below are the allowed values for precedence:
a) Minimum Value: 10
b) Max Value: 1000000
8.2.1.3 Flapping Count and Flapping Rate Seconds
-
Number of alerts can be reported as raise and clear consecutively in the specified Flapping rate seconds.
-
Flapping Rate Seconds is the time window in which an alert got repeated(raise followed by cleared).
8.2.1.4 Revive Expired Alerts
-
Suppressed alerts are revived once the suppression window is expired to further process alert either to correlate or create an incident.
-
User can control the revival process of suppressed alerts using below options
a) Revive And Process: Revives and processes alerts, applying all Suppression/Correlation policies.
b) Correlate: Applies Correlation Policies, skipping Suppression policies, to create incidents for alerts.
c) Do Not Revive: Prevents the revival of suppressed alerts.
d) Clear: Clears any suppressed alerts that have been revived.
8.2.1.5 Policy Filter
- Please refer to the Policy Filter Field Documentation Here
9. Policy Filter
-
Policy filters can be defined in order filter of the ingested alert to get correlated based on certain criteria.
-
Supported policy types
a) Basic
b) Advanced
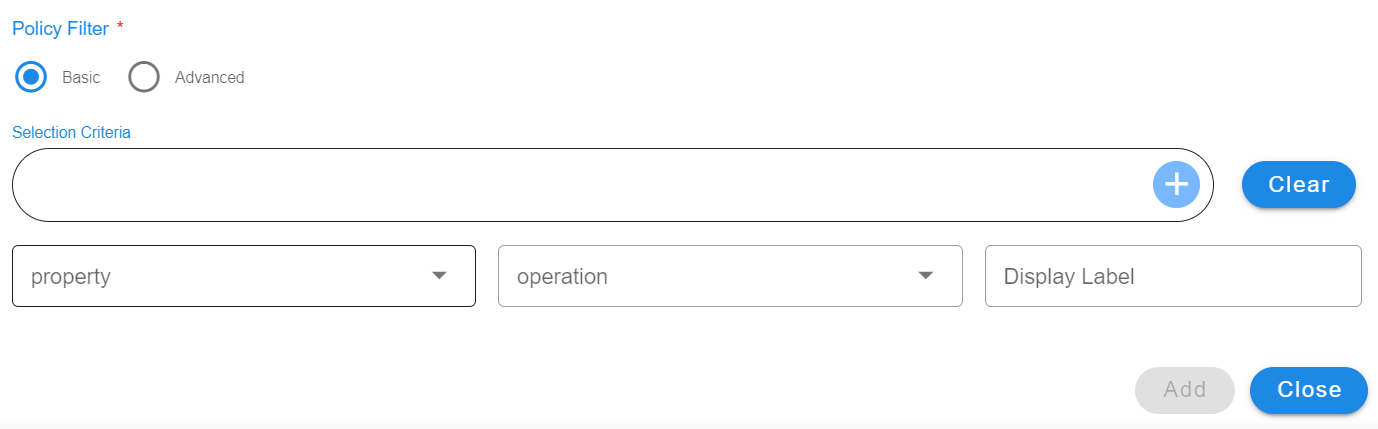
9.1 Basic
-
Filter which can be defined using UI supported filter widget. Default operator AND is used when multiple conditions are defined in filter.
-
Below is the sample basic format
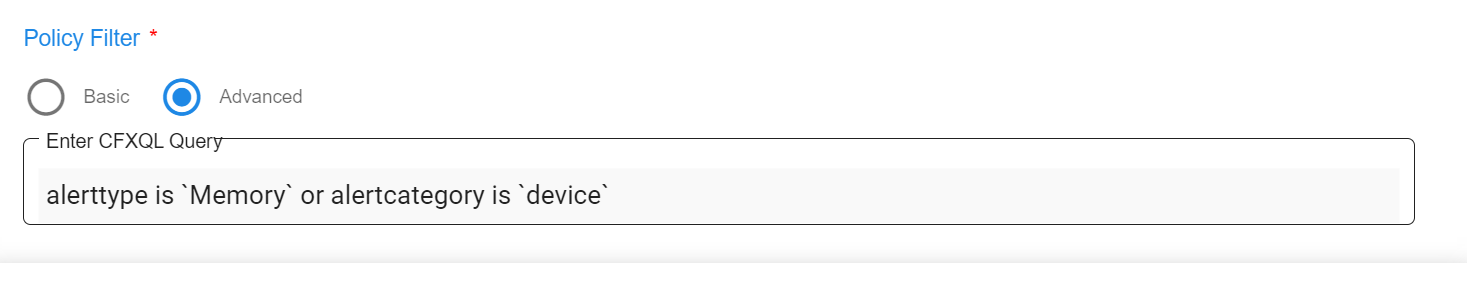
9.2 Advanced
-
Advanced can be defined using CFXQL language, when we want to specify multiple conditions with OR/AND operations.
-
Reference for CFXQL query format click here
-
Characters which needs to be escaped in the value of a defined filter.
-
Create an advanced filter using the attribute names listed in the "Filter Attributes Used to Define Filter" section below.
CharactersUsecase ( with escape Characters ) Examples $ test$123 Message contains 'Error logging\$123' ^ test^123 Message contains 'Error logging\^123' * test*123 Message contains 'Error logging\*123' ( test(123 Message contains 'Error logging\(123' ) test)123 Message contains 'Error logging\)123' + test+123 Message contains 'Error logging\+123' [ test[123 Message contains 'Error logging\[123' ' test'123 Message contains 'Error logging\'123' ? test?123 Message contains 'Error logging\?123' -
Below is the sample for advanced filter using CFXQL
9.3 Filter Attributes Used to Define Filter
| Attribute Name | Attribute Label |
|---|---|
| sourcemechanism | Source Mechanism |
| sourcesystemname | Source |
| severitylabel | Severity |
| alertcategory | Alert Category |
| alerttype | Alert Type |
| clusterlabel | Cluster |
| assettype | Asset Type |
| assetipaddress | IP Address |
| assetname | Asset Name |
| componentname | Component Name |
| message | Message |
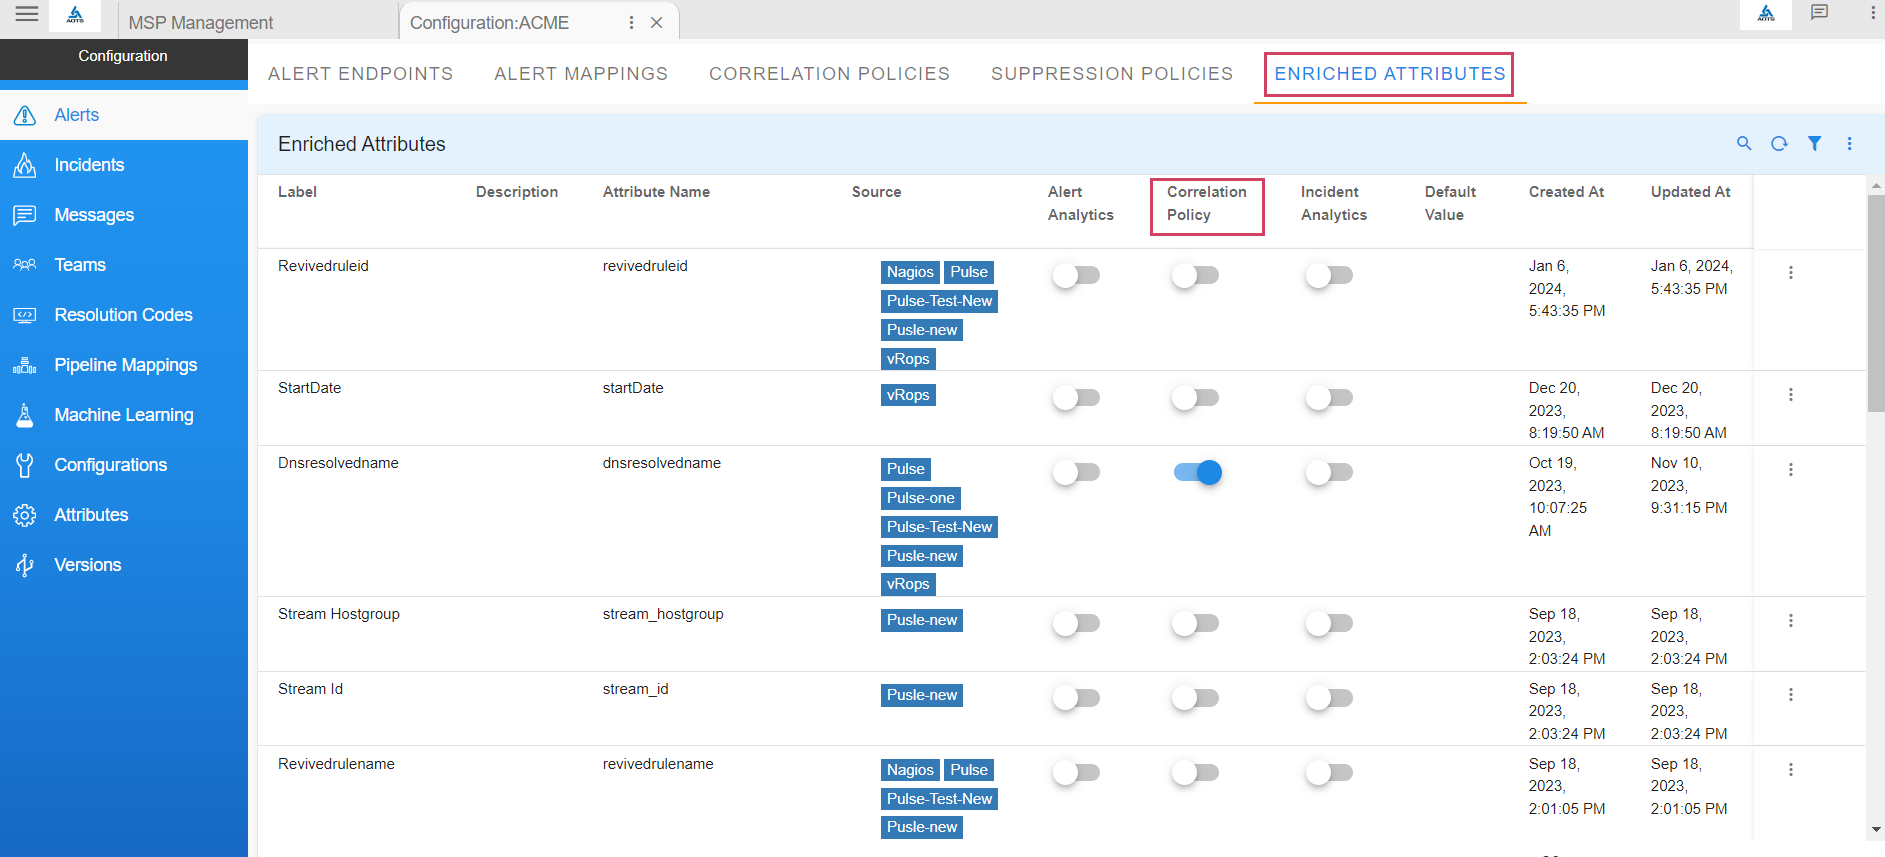
9.4 Using Enriched Attributes as Filter Attributes to Define Policy
-
Enriched attributes of an alert can be used to define filters by enabling them from the Enriched Attributes management section.
-
Path to manage enriched attributes of alerts: Home → Administration → Organization → Configure → Alerts → ENRICHED ATTRIBUTES → toggle switch under Correlation Policy
10. Configuration
10.1 Manage OIA Configuration Properties
10.1.1 Overview
OIA supports updating configuration properties that can be updated through Configuration UI. For example Alerts & Incidents Data Retention and Auto Delete Ingestion Tracker Events etc.
-
Configuration properties can be updated at Global and Organization level.
[a]. Properties which are enabled at Global cannot be changed at Organization level.
[b]. Properties with Global as False can be updated at Organization level.
[c]. Property can be customized at the Organization level for which Global is False.
-
Path to update configuration properties
[a]. Organizational Level
Navigation Path : Home Menu → Configuration → Apps Administration → Configure → Configuration → OIA Configuration → Configuration Properties
[b]. Global Level
Navigation Path : Home Menu → Administration → Configurations → Configs


10.1.2 Configure Property(DB Configuration Change)
- Path to update Configuration Property : Home Menu → Configuration → Apps Administration → Configure → Configuration → OIA Configuration → Configuration Properties → Update


Alerts & Incidents Data Retention
- Property to define - How many days Alerts & Incidents data has to be retained in the system before removal.
Note
Pstream retention and this property should be the same in order to avoid functionality impact.
10.1.3 Configure Alerts PStream Retention
-
Here user can find the steps to update pstream retention days for Alerts stream
-
Path to update configurations for pstream : Home Menu → Configuration → RDA Administration → Persistent Streams→ Persistent Streams → oia-alerts-stream → Edit

- Update retention_days property value to 90 Days in json.

10.1.4 Configure Incident PStream Retention
-
Here user can find the steps to update pstream retention days for Incident stream
-
Path to update configurations for pstream : Home Menu → Configuration → RDA Administration → Persistent Streams→ Persistent Streams → oia-incidents-stream → Edit

- Update retention_days property value to 90 Days in json.

10.1.5 Configuring Wait Queue Time for ITSM Ticket Updates
Path to update Configuration Property : Home Menu → Administration → Configurations → Update as shown in the screenshot below

10.1.6 Configuring Source Event Updater Interval Hours
Path to update Configuration Property : Home Menu → Administration → Configurations → Update as shown in the screenshot below

10.1.7 Configuring Source Event Updater Lag Count
Path to update Configuration Property : Home Menu → Administration → Configurations → Update as shown in the screenshot below

Note
The above mentioned configuration changes are applicable across all the projects in the system
10.1.8 Maximum Child Events per Source Event
Starting from RDAF 8.2.1, a new configuration parameter, Ingester maximum mapped events, has been introduced on the OIA Configuration Parameters page.
This parameter controls the maximum number of child (embedded) events that can be mapped and processed from a single source event.
Purpose
Some source events may contain multiple embedded child events within a single payload. The Ingester maximum mapped events parameter defines the maximum number of such embedded events that the system will process from a single source event.
If an incoming source event contains more embedded events than the configured limit:
- The event will not be processed.
- An error message will be generated.
- The error will be displayed on the Tracking Events page.
Configuration Parameter

If the parameter is configured with a value of 500, any incoming source event containing more than 500 embedded events will not be processed further.
An error similar to the following will be displayed on the Tracking Events page:

Default Value
The default value is 500.
This value has been determined based on internal performance testing using the following configuration:
| Parameter | Value |
|---|---|
| Enrichment Variables | 10 |
| Enrichment Datasets | 10 |
| Total Dataset Size | 140 MB |
| Total Rows Across Datasets | 636,600 |
| Total Columns Across Datasets | 5 |
| Dataset Refresh Frequency | Every 1 Hour |
Performance Reference
Under a lighter workload configuration consisting of:
- One dataset of size 4.9 MB
- 50,000 rows
- 5 columns
The system was able to process up to 3,000 embedded events within a single source event.
Warning
-
Increasing the Maximum Embedded Events value beyond the tested limits may impact system stability and performance.
-
If higher limits are required, additional VM and service resources may need to be allocated.
-
Contact Fabrix.ai Support before modifying this parameter beyond the recommended values.
11. Incident Management
cfxOIA creates Incident for every correlated Alert Group and sends them to ITSM tools (such as ServiceNow, PagerDuty, etc.) for further processing by IT Analysts, NOC/SOC Engineers, or Tier-1/Tier-2 Engineers. cfxOIA provides a module called Incident Room that AIOps operators and ITSM operators can use to accelerate incident analysis and resolution. The Incident room provides all the relevant context, data, insights, and tools at one place for incident resolution.
Learn more about:
11.1 Incident Mapping
11.1.1 Incident Endpoints
11.1.1.1 Endpoint Role
-
Source
Examples: Reading data from Webhooks, Kafka
-
Target
Examples: Creating/Updating ITSM tickets
11.1.1.2 Endpoint to Mapping
-
One to One
One Endpoint Mapped to one Incident Mapping
-
One to Many
a) One Endpoint mapped to more than one incident mapping.
b) Incident payload fields could be used to prepare condition that should be met before applying the mapping for current event. For example, alert-source on incident payload could be used.
11.1.1.3 Mapping Conditions
-
Mapping without Condition
This is typically mapped to one end point. All Incidents will use this single mapping and prepare similar payloads to submit to ITSM.
-
Mapping with Condition
This helps in creating different ITSM payloads as per defined condition. Conditions could be based on alert source mechanism or some other field.
11.1.1.4 Mapping Examples
Mapping helps in preparing the payload that will be used in sending to ITSM. System will receive Incident payload as the base and users, using this endpoint mapping, could customize the base payload and update or create new fields.
1) Passing All the fields as it is, no additional fields needed.
{
  "mappings": [
    {
      "to": "status",
      "from": "state",
      "func": {
        "map_values": {
          "New": "New",
          "Assigned": "New",
          "OnHold": "On Hold",
          "On Hold": "On Hold",
          "Resolved": "Resolved",
          "Closed": "Resolved",
          "Cancelled": "Canceled",
          "default": "New"
        }
      }
    }
  ],
  "keepUnmapped": true
}
- This means, if a field is NOT defined here in this mapping it will not be sent to the next step i.e. creating/updating ITSM ticket.
{
    "conditions": [
        {
            "on": "alert_source",
            "op": "matches",
            "expr": "Corestack"
        }
    ],
    "mappings": [
        {
            "to": "customerid",
            "from": "customerid"
        },
        {
            "to": "publish-stream-type",
            "func": {
                "evaluate": {
                    "expr": "'KAFKA'"
                }
            }
        }
    ],
    "keepUnmapped": false
}
11.1.2 Teams
A Team is required for listening to Incident events and route it to corresponding Endpoints. Team helps users to configure what to listen on like Incident Creates, Incident Resolutions etc. Additionally the team supports one source of Incident or all or specific set of Incident sources. System will perform a 3-way check to make sure Incident source matches Team source and also matches corresponding Endpoint source. If a source is not set, the corresponding team will be applied for all the Incidents and pick an endpoint with a similar rule to match.
11.1.3 Condition
This gets run prior to applying any mapping. It can be used to filter and pick applicable input data based on the incoming data. For each set of data, like alert_source in our below example, we can dynamically pick the most applicable mapper.
When evaluating source-related filtering, the following order of precedence is used:
| Priority | Source Field(s) | Condition |
|---|---|---|
| 1 | itsm_source |
Always checked first; takes priority if present |
| 2 | Alert_Source or Alert_source or alert_source |
Used if itsm_source is not present |
| 3 | endpoint_source |
Fallback if neither of the above is present |
11.1.4 Mandatory Fields
By default except for mappings and keepUnmapped, everything else is optional. However, based on downstream applications like ServiceNow, PagerDuty, some fields are
required.
- For ServiceNow and PagerDuty
{
    "to": "customerid",
    "from": "customerid"
  },
  {
    "to": "roomid",
    "from": "roomid"
  },
  {
    "to": "projectid",
    "from": "projectId"
  },
  {
    "to": "team_id",
    "from": "team_id"
  },
  {
    "to": "team_name",
    "from": "team_name"
  },
  {
    "to": "tool_name",
    "from": "tool_name"
  },
  {
    "to": "incidentid",
    "from": "incidentid"
  }
11.1.4.1 Mandatory Fields ServiceNow
Here user can find information on additional mandatory Fields for creating ServiceNow incident
{
    "to": "state",
    "from": "state",
    "func": {
      "map_values": {
        "New": "New",
        "Assigned": "New",
        "OnHold": "On Hold",
        "On Hold": "On Hold",
        "Resolved": "Resolved",
        "Closed": "Resolved",
        "Cancelled": "Canceled",
        "default": "New"
      }
    }
  },
  {
    "to": "ticketStatus",
    "from": "state"
  },
  {
    "to": "impact",
    "from": "priority",
    "func": {
      "map_values": {
        "1 - Critical": "Total Loss of Service",
        "2 - High": "Partial Loss",
        "3 - Moderate": "Partial Loss",
        "4 - Low": "No Impact",
        "5 - Planning": "No Impact",
        "default": "No Impact"
      }
    }
  },
  {
    "to": "urgency",
    "from": "priority",
    "func": {
      "map_values": {
        "1 - Critical": "P1",
        "2 - High": "P2",
        "3 - Moderate": "P3",
        "4 - Low": "P3",
        "5 - Planning": "P4",
        "default": "P3"
      }
    }
  },
  {
    "to": "notes_text",
    "func": {
      "evaluate": {
        "expr": "'getAlertsAsNotes'"
      }
    }
  },
  {
    "to": "notes_author",
    "func": {
      "evaluate": {
        "expr": "'CFX'"
      }
    }
  },
  {
    "to": "channel",
    "func": {
      "evaluate": {
        "expr": "'Fault Management'"
      }
    }
  },
  {
    "to": "account",
    "func": {
      "evaluate": {
        "expr": "'The Tata Power Company Limited'"
      }
    }
  },
  {
    "to": "shortDescription",
    "from": "_tmp_ci_aa_alert_email_sub"
  },
  {
    "to": "description",
    "func": {
      "evaluate": {
        "expr": "'getDescription'"
      }
    }
  }
11.1.4.2 Configurable Mandatory Fields
The following configuration helps define mandatory fields for each action. Based on the processing event, the applicable fields are selected and validated. If any required field is missing, the system will report it and stop further processing.
{
    "to": "mandatory_fields",
    "func": {
      "evaluate": {
        "expr": "'{\"CREATE\":[\"short_description\", \"state\", \"description\"], \"UPDATE\": [\"comments\"], \"CLEAR\":[\"comments\"], \"RESOLUTION\":[\"state\",\"resolved_at\"]}'"
      }
    }
}
11.1.4.3 Functional Fields
The following are optional, however important for preparing payload based on changes to the source transaction.
alert_changes: A list that is helpful to show how many new alerts are correlated in this latest update event.
clear_alerts: A list of all cleared alert-ids. It helps us to prepare notes/comments with a list of alert subjects that were cleared.
incident_changes: List of incident model fields changed in the latest update.
exclude_on_clear: For ServiceNow, we don't have to send state, priority etc fields when they are not changed. So on clear event, we want to send only a comment and not touch other fields on ITSM.
exclude_on_update: Similar to exclude_on_clear, we remove fields that are NOT updated. By default the system will send state and priority. However, if they are not changed in current update even we will remove them before sending to ITSM.
{
    "to": "alert_changes",
    "from": "alert_changes"
  },
  {
    "to": "clear_alerts",
    "from": "clear_alerts"
  },
  {
    "to": "incident_changes",
    "from": "incident_changes"
  },
  {
    "to": "exclude_on_clear",
    "func": {
      "evaluate": {
        "expr": "'[\"description\",\"summary\",\"short_description\",\"shortDescription\",\"priority\",\"impact\",\"state\",\"urgency\",\"ticketStatus\"]'"
      }
    }
  },
  {
    "to": "exclude_on_update",
    "func": {
      "evaluate": {
        "expr": "'[\"description\",\"summary\",\"short_description\",\"shortDescription\",\"priority\",\"impact\",\"state\",\"urgency\",\"ticketStatus\"]'"
      }
    }
  }
Support has been added for the following outbound mapping fields to control which fields are included in ITSM requests for different incident actions:
Note
Do not configure exclude_on_create and include_on_create within the same mapping. If both are specified, include_on_create takes precedence.
The same behavior applies to the following pairs:
exclude_on_update and include_on_update
exclude_on_clear and include_on_clear
include_on_createSpecifies the list of fields to be sent for all Create actions. Only the fields listed here will be included in the outbound request.
{
  "to": "include_on_create",
  "func": {
    "evaluate": {
      "expr": "'[\"description\",\"summary\",\"shortDescription\",\"priority\",\"impact\",\"state\",\"urgency\",\"comments\"]'"
    }
  }
}
include_on_resolutionSpecifies the list of fields to be sent for all Resolution actions. Only the fields listed here will be included in the outbound request.
{
  "to": "include_on_resolution",
  "func": {
    "evaluate": {
      "expr": "'[\"close_code\",\"close_notes\",\"resolved_at\",\"resolved_by\",\"state\",\"comments\",\"user_comments\",\"sys_id\",\"ticketId\",\"number\",\"ticketNumber\",\"assigned_to\"]'"
    }
  }
}
include_on_clearSpecifies the list of fields to be sent for all Clear actions. Only the fields listed here will be included in the outbound request.
{
  "to": "include_on_clear",
  "func": {
    "evaluate": {
      "expr": "'[\"comments\",\"sys_id\",\"ticketId\",\"number\",\"ticketNumber\"]'"
    }
  }
}
delay_between_actions: Configure the following to add an additional delay, default 1 sec, between Create and Resolved state updates. This is applicable only when ITSM ticket is not existing until Resolve update is processed. System will attempt to create a new ITSM first then give a gap of specified number of seconds and then make a Resolve update call on the new ITSM ticket.
allow_state_reopen: If the ITSM system wants all forms of state updates including reopen after Resolved/Closed, then the following should be set to True. Default is False, system wont post reopen state updates to ITSM.
cfx_to_itsm_status: This is useful when translating latest incident status to corresponding ITSM status.{
"to": "cfx_to_itsm_status",
"func": {
"evaluate": {
"expr": "'{\"New\":\"1\",\"Open\":\"1\",\"Assigned\":\"2\",\"OnHold\":\"3\",\"OnHold\":\"3\",\"Resolved\":\"6\",\"Closed\":\"7\",\"Cancelled\":\"8\"}'"
}
}
}
itsm_to_cfx_status: This is useful when translating the ITSM status back to CFX status.
{
  "to": "itsm_to_cfx_status",
  "func": {
    "evaluate": {
      "expr": "'{\"4\":\"Resolved\",\"5\":\"Closed\",\"6\":\"Resolved\",\"7\":\"Closed\"}'"
    }
  }
}
retry_interval: Retry interval in seconds, default 5, when ITSM create or update failed. Delay between each retry.
skip_retry_on_keywords: List of keywords that should not go through retry when found in ITSM action response. Default [not available,invalid,inactive state,operation failed,doctype]
{
  "to": "skip_retry_on_keywords",
  "func": {
    "evaluate": {
      "expr": "'[\"not available\",\"invalid\",\"inactive state\",\"operation failed\",\"doctype\"]'"
    }
  }
},
Note
These fields are newly introduced. If the application does not find the new mapping field/s, the system will continue to work as before.
update_itsm_fields: Key fields such as summary, description, and priority are generally not updated once a ticket is created. However, if an update is required in certain cases, it is supported via this outbound mapping configuration. If the application includes the updateITSMFields flag, the outbound processor will forward the listed fields to ITSM.
When the source application includes the updateITSMFields flag and its value evaluates to True, the outbound processor forwards the configured fields to the ITSM platform for update.
{
  "to": "update_itsm_fields",
  "func": {
    "evaluate": {
      "expr": "('[\"short_description\",\"description\",\"priority\",\"impact\",\"urgency\",\"state\",\"category\"]') if (updateITSMFields and (updateITSMFields == 'True' or updateITSMFields == 1 or updateITSMFields == '1')) else '[]'"
    }
  }
}
Note
If updateITSMFields is not provided or evaluates to False, no additional ITSM fields will be updated.
create_ticket_then_append_notes : Enable/Disable the 2-step process. Applicable to all customer mappings. Default: false. This helps with creating ticket first and then post notes (comments) to the ticket
Note
When create_ticket_then_append_notes is set to true, please ensure that 'comments' is not included in the exclude_on_create section.
create_ticket_then_append_notes_delay : When 2-step process is enabled, specify the delay between the two actions. Longer delay would impact performance of the creation process. Default: 0.1 sec.
create_ticket_then_append_notes_fields : When 2-step process is enabled, specified list of fields will be deferred for updating in the second-step. Default: comments and work_notes.
    {
      "to": "create_ticket_then_append_notes_fields",
      "func": {
        "evaluate": {
          "expr": "'[\"comments\",\"work_notes\"]'"
        }
      }
    },
11.1.5 Supported Functions
11.1.5.1 JSON Parsing and Traversing
11.1.5.2 Mapping
{
    "to": "configuration_items",
    "from": "configuration_items",
    "func": {
      "jsonDecode": {}
    }
  },
  {
    "to": "_tmp_ci_aa",
    "from": "configuration_items",
    "func": {
      "valueRef": {
        "path": "alert_attributes"
      }
    }
  },
  {
    "to": "_tmp_ci_aa",
    "from": "_tmp_ci_aa",
    "func": {
      "jsonDecode": {}
    }
  },
  {
    "to": "_tmp_ci_aa_assetName",
    "from": "_tmp_ci_aa",
    "func": {
      "valueRef": {
        "path": "assetName"
      }
    }
  }
11.1.5.3 Split
 {
    "from": "assetName",
    "to": "asset_shortname",
    "func": [
      {
        "split": {
          "sep": "."
        }
      },
      {
        "valueRef": {
          "path": "0"
        }
      }
    ]
  }
11.1.5.4 RegEx
{
    "from": "_tmp_body",
    "to": "message",
    "func": [
      {
        "match": {
          "expr": ".*Failure Reason:?\\s?(?P<message>.*?)\\n",
          "flags": [
            "DOTALL"
          ]
        }
      },
      {
        "when_null": {
          "value": "Backup job failed."
        }
      }
    ]
  }
11.1.5.5 DateTime Function
{
    "from": "_tmp_time",
    "to": "raisedAt",
    "func": [
      {
        "datetime": {
          "tzmap": {
            "IST": "Asia/Kolkata"
          }
        }
      }
    ]
  }
11.1.5.6 If-Else Condition
{
    "to": "_tmp_ci_aa_assetName",
    "func": {
      "evaluate": {
        "expr": "_tmp_ci_aa_assetName if _tmp_ci_aa_assetName else _tmp_ci_aa_assetNameL"
      }
    }
  }
11.1.5.7 Function
Apply a function to a field
11.1.5.8 Join Multiple fields
{
    "from": [
      "assetName",
      "comcell_name",
      "backup_job_id"
    ],
    "to": "key",
    "func": {
      "join": {
        "sep": "#"
      }
    }
  }
11.1.5.9 Map
{
    "to": "state",
    "from": "state",
    "func": {
      "map_values": {
        "New": "New",
        "Assigned": "New",
        "OnHold": "On Hold",
        "On Hold": "On Hold",
        "Resolved": "Resolved",
        "Closed": "Resolved",
        "Cancelled": "Canceled",
        "default": "New"
      }
    }
  }
11.1.5.10 Constant
11.1.5.11 Concat
{
    "to": "Title",
    "func": {
      "evaluate": {
        "expr": "(_tmp_ci_aa_status + ' in ' + _tmp_ci_aa_ResolvedDuration +
        ':' + _tmp_ci_aa_Hostname + ' by ' + _tmp_ci_aa_RecoveryName) if
        (_tmp_ci_aa_status != '' and _tmp_ci_aa_ResolvedDuration != '' and
         _tmp_ci_aa_Hostname != '' and _tmp_ci_aa_RecoveryName != '' and
          (_tmp_ci_aa_status == 'CLEARED' or _tmp_ci_aa_status=='RESOLVED')) else ''"
      }
    }
  }
11.1.6 Custom Implementation
11.1.6.1 Description Body
Approach 1
Sometimes it is required to concat multiple fields to prepare one field and then send it to ITSM.
Example: Description field could consist of fields from Incident level and parent alert level.
{
    "to": "desc_fields",
    "func": {
      "evaluate": {
        "expr": "'{\"tmp_ci_aa_alert_email_body\":
\"Description\",\"shortDescription\": \"Short
Description\",\"serviceIdentifier\": \"Service Identifier\",\"channel\":
\"Channel\",\"category\": \"Category\",\"priority\":
\"Priority\",\"alert_source\": \"Alarm Source\"}'"
      }
    }
  },
  {
    "to": "description",
    "func": {
      "evaluate": {
        "expr": "'getDescription'"
      }
    }
  }
When preparing a description field, the application will fetch a list of fields defined in desc_fields and for each defined field, it looks in the payload at both Incident Level and Alert Level.
Approach 2
Use desc_template to support any format. Two template types are supported: Jinja and Regex.
1) Type: jinja
- Using a Named Template (
name)
The system loads an existing saved template by name and uses it to prepare the content.
For more information on how to create formatting template click here
{
  "to": "desc_template",
  "func": {
    "dictionary": {
      "type": "jinja",
      "name": "snow-description-template"
    }
  }
}
- Using an Inline Template (
template)
Provide the template string directly in the mapping configuration.
{
  "to": "desc_template",
  "func": {
    "dictionary": {
      "type": "jinja",
      "template": "{\"description\":\"{{org_description | e}}\", \"reporter\":\"{{reporter}}\"}"
    }
  }
}
2) Type: regex
- Use a regex-style template string with $variable placeholders. Provide the template string directly in the mapping configuration.
{
  "to": "desc_template",
  "func": {
    "dictionary": {
      "type": "regex",
      "template": "Alert ID : $alert_source_event_id <br>IP Address : $assetipaddress <br>Message : $message <br>"
    }
  }
}
11.1.6.2 Notes/Comments
Sometimes the user needs to send a different set of fields based on the Incident state. Here is an example of such a use case.
Approach 1: alert_fields — List Style
Use alert_fields to render alert field information in a list style. Fields can be defined per Incident state (e.g., ACTIVE, CLEARED).
{
    "to": "alert_fields",
    "func": {
      "evaluate": {
        "expr": "'[{\"ACTIVE\":{\"alert_source_event_id\": \"Alert ID\", \"assetipaddress\": \"IP Address\", \"message\": \"Message\", \"alert_severity\": \"Severity\", \"sourcestatus\": \"Status\", \"assetname\": \"Device\", \"alert_open_time\": \"EventTime\", \"alert_type_key\": \"Event\", \"HostGroup\": \"HostGroup\", \"Tags\": \"Tags\", \"alert_os_version\": \"OS Type & Version\", \"alert_trigger_message\": \"Detail Message\"}},{\"CLEARED\":{\"alert_source_event_id\": \"Alert ID\", \"message\": \"Message\", \"assetipaddress\": \"IP Address\",\"sourcestatus\": \"Status\",\"assetname\": \"Device\", \"alert_cleart_time\": \"EventTime\", \"HostGroup\": \"HostGroup\",\"Tags\": \"Tags\", \"alert_detail_message\": \"Detail Message\", \"alert_type_key\": \"Monitor Type\", \"Title\":\"Title\", \"LastEventTime\":\"LastEventTime\", \"ProblemResolvedTime\":\"ProblemResolvedTime\"}}]'"
      }
    }
  },
  {
    "to": "comments",
    "func": {
      "evaluate": {
        "expr": "'getAlertsAsNotes'"
      }
    }
  }
A simpler example with fewer fields:
    {
      "to": "alert_fields",
      "func": {
        "evaluate": {
          "expr": "'[{\"ACTIVE\":{\"message\": \"Message\",\"alerttype\": \"Alert Type\",\"raise\": \"Raise Payload\"}},{\"CLEARED\":{\"message\": \"Message\",\"alerttype\": \"Alert Type\",\"clear\": \"Clear Payload\"}}]'"
        }
      }
    }
Approach 2: alert_template — Custom Format (Regex / Jinja)
Use alert_template to support any format. Two template types are supported: Regex and Jinja.
1) Type: regex (Default)
Use a regex-style template string with $variable placeholders, defined per Incident state.
    {
      "to": "alert_template",
      "func": {
        "evaluate": {
          "expr": "'[{\"ACTIVE\":{\"template\":\"Alert ID : $alert_source_event_id IP Address : $assetipaddress Message : $message\"}},{\"CLEARED\":{\"template\":\"Title : $Alert_Status in $Alert_ResolvedDuration:$Alert_Hostname by $Alert_RecoveryName Alert ID : $alert_source_event_id Message : $message Problem Resolved Time : $Alert_RecoveryTime on $Alert_RecoveryDate \"}}]'"
        }
      }
    }
2) Type: jinja
- Using a Named Template (
name)
The system loads an existing saved template by name and uses it to prepare the content, defined per Incident state.
    {
      "to": "alert_template",
      "func": {
        "evaluate": {
          "expr": "'[{\"ACTIVE\":{\"type\":\"jinja\", \"name\":\"snow-alerts-raise-template\"}},{\"CLEARED\":{\"type\":\"jinja\", \"name\":\"snow-alerts-clear-template\"}}]'"
        }
      }
    }
Example Jinja Templates
The following named templates can be referenced by name in alert_template or desc_template mappings.
Used for preparing the Description field at the Incident level.
{
  "description": "{{org_description | e}}",
  "source": "{{source}}",
  "category": "{{category}}",
  "reporter": "{{reporter}}"
}
Used for formatting Alert information when the Incident state is CLEARED.
{
  "Message": "{{message | e}}",
  "Alert Type": "{{alerttype}}",
  "Asset IP": "{{assetipaddress}}",
  "Asset Name": "{{assetname}}",
  "Severity": "{{severitylabel}}",
  "Created": "{{createdat | millis_to_iso}}",
  "SourceMechanism": "{{sourcemechanism}}",
  "Status": "{{sourcestatus}}",
  "AlertId": "{{id | e}}",
  "Clear Payload": "{{sourcepayload | decompress}}"
}
Used for formatting Alert information when the Incident state is ACTIVE.
{
  "Message": "{{message | e}}",
  "Alert Type": "{{alerttype}}",
  "Asset IP": "{{assetipaddress}}",
  "Asset Name": "{{assetname}}",
  "Severity": "{{severitylabel}}",
  "Created": "{{createdat | millis_to_iso}}",
  "SourceMechanism": "{{sourcemechanism}}",
  "Status": "{{sourcestatus}}",
  "AlertId": "{{id}}",
  "Raise Payload": "{{sourcepayload | decompress}}"
}
11.1.6.3 Specific Field from Alert
Our base payload fields are from Incident model. However application fetches alerts for the given incident, We support accessing the alert fields using following convention.
11.1.6.4 Notification
Application supports posting the confirmation to RDA Persistent Stream. This helps any downstream application to listen and respond as needed by the business logic. Based on the defined set of fields and stream name, application will prepare and payload and write it to the stream.
{
    "to": "notify-itsm-action-fields",
    "func": {
      "evaluate": {
        "expr": "'[\"summary\",\"incidentid\",\"customerid\",\"roomid\",\"projectid\",\"sourcekey\",\"state\"]'"
      }
    }
  },
  {
    "to": "notify-itsm-action-stream",
    "func": {
      "evaluate": {
        "expr": "'itsm_ticket_kafka_stream'"
      }
    }
  },
  {
    "to": "publish-stream-type",
    "func": {
      "evaluate": {
        "expr": "'KAFKA'"
      }
    }
  }
11.1.7 Skip ITSM Ticketing
Important
-
If
itsm_ticketis explicitly provided with value "false", ITSM ticketing will be skipped. -
In this scenario, the following fields are mandatory:
- notify-itsm-action-fields
- notify-itsm-action-stream
Suppose user wants to skip the ITSM ticketing for this alert source, user can set the following fields and save the incident mapping
{
    "to": "itsm_ticket",
    "func": {
      "evaluate": {
        "expr": "'false'"
      }
    }
  },
  {
    "to": "itsm_ticket_override",
    "from": "itsm_ticket_override"
  }
To skip ticketing when short_description is missing, the following configuration also shows the reason why ticketing was skipped.
{
  "to": "itsm_ticket",
  "func": {
    "evaluate": {
      "expr": "'true' if short_description else 'false'"
    }
  }
},
{
  "to": "itsm_ticket_override",
  "func": {
    "evaluate": {
      "expr": "'true' if short_description else 'false'"
    }
  }
},
{
      "to": "itsm_ticket_skip_reason",
      "func": {
        "evaluate": {
          "expr": "'Skipping reason goes here' if itsm_ticket == 'false' else ''"
        }
      }
}
11.1.8 Custom Integrations Using Dynamic Bots
11.1.8.1 Creating Dynamic Bot & Writing Template Code
For detailed instructions on creating Dynamic Bots and writing template code, please click here
11.1.8.2 Creating ITSM Specific Dynamic Bot
Navigation: Configuration -> RDA Administration -> Pipelines -> Dynamic Bots -> Add Bot
-
Bot Name: User-defined name for the Dynamic Bot.
-
MAKO Template: Template code used by the bot. For example:
template.json.
template.json
<%
logger = logging.getLogger("itsm_ticket")

##Expected arguments
##
# From Application
##Create
### df, source, action_name, secret_name

##Update
### df, source, action_name, secret_name

##GetData
##df[ticket_id,sys_id,number], source, action_name, secret_name

##GetURL
##df[ticket_id,sys_id,number], source, action_name, secret_name


def _getColumnValue(df, columnName, parseAsJson=True):
    ##tricky part: include_on_create/update/clear is inside the input DF. So get that first and then apply. If multiple rows in DF, all of the rows would have same constant value for this column: include_on_create
    colVal = None
    try:
        if columnName in df.columns:
            colVal = str(df[columnName].iloc[0])
        if parseAsJson and colVal and isinstance(colVal, str):
            colVal = json.loads(colVal)
    except Exception as e:
        logger.error(f"Exception parsing {colVal}. Error: {e}")
        colVal = None
    return colVal


##
# From Config
##action_name, instance, host, table_name, source, alerts_count, itsm_resolve_retry_delay, itsm_resolve_retry_count, itsm_action_retry_count, itsm_action_retry_interval, delay_between_dbl_actions, lookup_call_retry_count, lookup_call_retry_delay


def create(url):
    logger.info(f"create::source {source}")
    request_timeout = 30
    if df is None or df.shape[0] == 0:
        return [
            {
                "rda_reason": "Empty Input Data Received",
                "rda_status": "Fail",
                "sys_id": None,
                "ticketId": None,
                "number": None,
                "url": None,
                "elapse_time_ms": 0,
                "rda_row_update_status": None,
                "attempt_count": 1,
            }
        ]
    if (
        "state" not in df.columns
        and "description" not in df.columns
        and "short_description" not in df.columns
    ):
        return [
            {
                "rda_reason": "Missing required fields (state, description, short_description) to perform this action",
                "rda_status": "Fail",
                "sys_id": None,
                "ticketId": None,
                "number": None,
                "url": None,
                "elapse_time_ms": 0,
                "rda_row_update_status": None,
                "attempt_count": 1,
            }
        ]
    stf = int(datetime.datetime.now().timestamp() * 1000)
    include_on_create = _getColumnValue(df, "include_on_create", True)
    if include_on_create is None:
        include_on_create = []
    if include_on_create and len(include_on_create) > 0:
        ##If datafram filter operation is not expensive, do this:
        jr = df.loc[:, df.columns.isin(include_on_create)].to_json(orient="records")
        rows = json.loads(jr)
        ##(fastest for large DataFrames)
        # df = df[df.columns.difference(include_on_create)]
    else:
        rows = json.loads(df.to_json(orient="records"))
    ##if datafram filter operation is expensive, do this:
    # rows = [{k: v for k, v in row.items() if k in include_on_create} for row in rows]
    ##After this, rows will have fewer columns to work with and send to itsm.
    session = requests.Session()
    session.headers.update(
        {"Content-Type": "application/json", "Accept": "application/json"}
    )
    if source:
        session.headers["source"] = source
    if table_name:
        session.headers["Table-Name"] = table_name
    logger.debug("Session created with headers: {}".format(session.headers))
    rtn = []
    incidentid = None
    for row in rows:
        st = int(datetime.datetime.now().timestamp() * 1000)
        temp_row = json.loads(json.dumps(row))
        incidentid = temp_row.get(
            "incidentid", temp_row.get("incident_id", temp_row.get("incidentId"))
        )
        logger.debug(
            f"URL: {url}, Secret: {secret_name}, Incident: {incidentid}, Data: {temp_row}"
        )
        try:
            data = session.post(
                url,
                rda_secret_name=secret_name,
                verify=False,
                data=json.dumps(temp_row),
                timeout=request_timeout,
            )
            res = processResponse(data)
            ed = int(datetime.datetime.now().timestamp() * 1000)
            res["elapse_time_ms"] = ed - st
            rtn.append(res)
        except Exception as e:
            logger.exception(f"Error creating ITSM ticket for incident {incidentid}. Exception {e}", exc_info=True)
    edf = int(datetime.datetime.now().timestamp() * 1000)
    logger.info(f"END. Elapse Time {(edf-stf)}. incidentid {incidentid}")
    return rtn


def applyFilter(inclusionList=None, exclusionList=None, jsonData=None):
    filtered = jsonData
    if inclusionList and len(inclusionList) > 0:  ##Want keys
        filtered = {k: v for k, v in filtered.items() if k in inclusionList}
    if exclusionList and len(exclusionList) > 0:  ##DONT want keys
        filtered = {k: v for k, v in filtered.items() if k not in exclusionList}
    return filtered


def processResponse(data):
    logger.info(f"Response Received::{data}")
    if data is None:
        return {
            "rda_reason": "No respone received",
            "rda_status": "Fail",
            "rda_row_update_status": "Fail",
            "attempt_count": 1
        }

    if data.status_code not in [200, 201]:
        error_msg = ""
        error_dtl = ""
        try:
            data = data.json()
            logger.info(f"Error Response - JSON: {data}")
            if "result" in data:
                data = data.get("result")
            if "error" in data:
                error = data.get("error")
            if error and "message" in error:
                error_msg = error.get("message")
            if error and "detail" in error:
                error_dtl = error.get("detail")
        except Exception as e:
            logger.exception(f"Request failed with exception {e}", exc_info=True)
            logger.debug(f"Received response {data.text}")
            error_msg = str(e)
            error_dtl = str(e)
        data = {}
        data["rda_reason"] = "Message:" + error_msg + ",Details:" + error_dtl
        data["rda_status"] = "Fail"
        data["rda_row_update_status"] = "Fail"
        data["attempt_count"] = 1
        logger.info(f"Returning Response-1 (error) {data}")
        return data
    try:
        data = data.json()
        if "result" in data:
            data = data.get("result")
    except Exception as e:
        logger.exception(f"Error processing response. Exception {e}", exc_info=True)
        logger.debug(f"Received Response {data.text}")
        data = {}
        data["rda_reason"] = "Message:" + str(e)
        data["rda_status"] = "Fail"
        data["rda_row_update_status"] = "Fail"
        data["attempt_count"] = 1
        logger.info(f"Returning Response-2 (error) {data}")
        return data
    data["rda_reason"] = None
    data["rda_status"] = "Success"
    data["rda_row_update_status"] = None
    data["attempt_count"] = 1
    logger.info(f"Returning Response-3 (success) {data}")
    return data


def update(url):
    logger.info(f"update::source {source}")
    request_timeout = 30
    if df is None or df.shape[0] == 0:
        return [
            {
                "rda_reason": "Empty Input Data Received",
                "rda_status": "Fail",
                "sys_id": None,
                "ticketId": None,
                "number": None,
                "url": None,
                "elapse_time_ms": 0,
                "rda_row_update_status": None,
                "attempt_count": 1,
            }
        ]
    ##Atleast one of the following is required. if all 3 are missing, donot proceed.
    if (
        "number" not in df.columns
        and "sys_id" not in df.columns
        and "ticketId" not in df.columns
    ):
        return [
            {
                "rda_reason": "Missing a required field (number or sys_id or ticketId) to perform this action",
                "rda_status": "Fail",
                "sys_id": None,
                "ticketId": None,
                "number": None,
                "url": None,
                "elapse_time_ms": 0,
                "rda_row_update_status": None,
                "attempt_count": 1,
            }
        ]
    stf = int(datetime.datetime.now().timestamp() * 1000)
    rows = json.loads(df.to_json(orient="records"))
    session = requests.Session()
    session.headers.update(
        {"Content-Type": "application/json", "Accept": "application/json"}
    )
    if source:
        session.headers["source"] = source
    if table_name:
        session.headers["Table-Name"] = table_name
    logger.debug("Session created with headers: {}".format(session.headers))
    rtn = []
    incidentid = None
    for row in rows:
        st = int(datetime.datetime.now().timestamp() * 1000)
        temp_row = json.loads(json.dumps(row))
        sys_id = row.get("sys_id", row.get("ticketId", row.get("number")))
        incidentid = temp_row.get(
            "incidentid", temp_row.get("incident_id", temp_row.get("incidentId"))
        )
        include_on_resolution = temp_row.get("include_on_resolution")
        if include_on_resolution and isinstance(include_on_resolution, str):
            include_on_resolution = json.loads(include_on_resolution)
        include_on_clear = temp_row.get("include_on_clear")
        if include_on_clear and isinstance(include_on_clear, str):
            include_on_clear = json.loads(include_on_clear)
        isClearAlertsAction = temp_row.get("isClearAlertsAction", False)
        isResolvedAction = temp_row.get("isResolvedAction", False)
        isCorrelatedAlertsActon = temp_row.get("isCorrelatedAlertsActon", False)
        if isClearAlertsAction:
            temp_row = applyFilter(
                inclusionList=include_on_clear, exclusionList=None, jsonData=temp_row
            )
        if isResolvedAction:
            temp_row = applyFilter(
                inclusionList=include_on_resolution,
                exclusionList=None,
                jsonData=temp_row,
            )
        logger.debug(
            f"URL: {url}, Secret: {secret_name}, sys_id: {sys_id}, Incident: {incidentid}, isResolvedAction: {isResolvedAction}, isClearAlertsAction: {isClearAlertsAction}, isCorrelatedAlertsActon: {isCorrelatedAlertsActon}, Data: {temp_row}"
        )
        data = session.patch(
            url + "/" + sys_id,
            rda_secret_name=secret_name,
            verify=False,
            data=json.dumps(temp_row),
            timeout=request_timeout,
        )
        res = processResponse(data)
        res["sys_id"] = sys_id
        res["ticketId"] = sys_id
        res["number"] = row.get("number")
        ed = int(datetime.datetime.now().timestamp() * 1000)
        res["elapse_time_ms"] = ed - st
        rtn.append(res)
    edf = int(datetime.datetime.now().timestamp() * 1000)
    logger.info(f"END. Elapse Time {(edf-stf)}. incidentid {incidentid}")
    return rtn


def getITSMData(url):
    request_timeout = 30
    session = requests.Session()
    session.headers.update({"Content-Type": "application/json"})
    _params = {}
    if source:
        session.headers["source"] = source
        _params = {"source": source}
    if table_name:
        session.headers["Table-Name"] = table_name
    data = session.get(
        url,
        params=_params,
        rda_secret_name=secret_name,
        timeout=request_timeout,
        verify=False,
    )
    return processResponse(data)


def getData(url):
    ##Input: ##df[ticket_id,sys_id,number], source, action_name, secret_name
    logger.info(f"getData::source {source}")
    stf = int(datetime.datetime.now().timestamp() * 1000)
    if df is None or df.shape[0] == 0:
        return [
            {
                "rda_reason": "Empty Input Data Received",
                "rda_status": "Fail",
                "sys_id": None,
                "ticketId": None,
                "number": None,
                "url": None,
                "elapse_time_ms": 0,
                "rda_row_update_status": None,
                "attempt_count": 1,
            }
        ]
    if "sys_id" not in df.columns:
        return [
            {
                "rda_reason": "sys_id column is required to perform this action",
                "rda_status": "Fail",
                "sys_id": None,
                "ticketId": None,
                "number": None,
                "url": None,
                "elapse_time_ms": 0,
                "rda_row_update_status": None,
                "attempt_count": 1,
            }
        ]
    rows = json.loads(df.to_json(orient="records"))
    rtn = []
    number = None
    for row in rows:
        st = int(datetime.datetime.now().timestamp() * 1000)
        res = getITSMData(url + "/" + row["sys_id"])
        number = res.get("number", res.get("sys_id"))
        ed = int(datetime.datetime.now().timestamp() * 1000)
        res["elapse_time_ms"] = ed - st
        rtn.append(res)
    edf = int(datetime.datetime.now().timestamp() * 1000)
    logger.info(f"END. Elapse Time {(edf-stf)}. number {number}")
    return rtn


def getURL(url):
    ##Input: ##df[ticket_id,sys_id,number], source, action_name, secret_name
    logger.info(f"getURL::source {source}")
    stf = int(datetime.datetime.now().timestamp() * 1000)
    if df is None or df.shape[0] == 0:
        return [
            {
                "rda_reason": "Empty Input Data Received",
                "rda_status": "Fail",
                "sys_id": None,
                "ticketId": None,
                "number": None,
                "url": None,
                "elapse_time_ms": 0,
                "rda_row_update_status": None,
                "attempt_count": 1,
            }
        ]
    if "sys_id" not in df.columns:
        return [
            {
                "rda_reason": "sys_id column is required to perform this action",
                "rda_status": "Fail",
                "sys_id": None,
                "ticketId": None,
                "number": None,
                "url": None,
                "elapse_time_ms": 0,
                "rda_row_update_status": None,
                "attempt_count": 1,
            }
        ]
    rows = json.loads(df.to_json(orient="records"))
    rtn = []
    for row in rows:
        st = int(datetime.datetime.now().timestamp() * 1000)
        snow_url = url + "" + row["sys_id"]
        ed = int(datetime.datetime.now().timestamp() * 1000)
        rtn.append(
            {
                "rda_reason": None,
                "rda_status": "Success",
                "sys_id": row["sys_id"],
                "ticketId": row["ticket_id"],
                "number": row["number"],
                "url": snow_url,
                "elapse_time_ms": (ed - st),
                "rda_row_update_status": None,
                "attempt_count": 1,
            }
        )
    edf = int(datetime.datetime.now().timestamp() * 1000)
    logger.info(f"END. Elapse Time {(edf-stf)}. Returning {rtn}")
    return rtn


def validate(url):
    logger.info(f"validate:: url {url}, source {source}")
    request_timeout = 30
    session = requests.Session()
    session.headers.update({"Content-Type": "application/json"})
    rda_reason = rda_status = None
    _params = {}
    if source:
        _params = {"source": source}
    try:
        data = session.get(
            url,
            params=_params,
            rda_secret_name=secret_name,
            timeout=request_timeout,
            verify=False,
        )
        logger.info(f"url {url}, response: {data}, json: {data.json()}")
        rda_reason = None
        rda_status = "Success"
    except Exception as e:
        logger.error(f"Error validating the url {url} request using provided auth {secret_name}. Error {e}")
        rda_reason = str(e)
        rda_status = "Fail"
    return [
        {
            "rda_reason": rda_reason,
            "rda_status": rda_status,
            "rda_row_update_status": None,
            "attempt_count": 1,
        }
    ]


port = 443  ##TODO remove this once port is passed from the dynamic-bot json-schema
request_timeout = (
    30  ##TODO remove this once port is passed from the dynamic-bot json-schema
)

url_suffix = "incident"
base_url = f"https://{host}:{port}/api/now/table/{url_suffix}"


logger.info(
    f"Action {action_name}, instance {instance}, host {host}, secret_name {secret_name}, source {source}, base_url {base_url}"
)
# Secure HTTP requests
## parameter::action_name: create or update or get or share
try:
    if action_name == "create":
        output["value"] = create(base_url)
    elif action_name == "update":
        output["value"] = update(base_url)
    elif action_name == "getData":
        output["value"] = getData(base_url)
    elif action_name == "getURL":
        _url = f"https://{host}:{port}/nav_to.do?uri=%2F{url_suffix}.do%3Fsys_id%3D"
        output["value"] = getURL(_url)
    elif action_name == "validate":
        _url = f"https://{host}:{port}/api/now/table/incident?sysparm_query=ORDERBYDESCsys_created_on&sysparm_limit=1"
        output["value"] = validate(_url)
    else:
        raise Exception(
            "Unknown Action Name Requested. Supported actions [create,update,getData,getURL,validate]"
        )
except Exception as e:
    logger.error(f"Exception processing action {action_name}", exc_info=True)
    return {
        "rda_reason": "Exception:" + str(e),
        "rda_row_id": None,
        "rda_status": "Fail",
        "rda_row_update_status": "Fail",
        "attempt_count": 1,
    }

%>
- JSON Schema: JSON schema that defines the configuration fields required for the bot. For example:
schema.json.
schema.json
{
  "type": "object",
  "properties": {
    "instance": {
      "type": "string",
      "description": "ITSM Instance Name"
    },
    "host": {
      "type": "string",
      "description": "ITSM Host or URL"
    },
    "port": {
      "type": "integer",
      "description": "ITSM Port",
      "defaultValue": 443
    },
    "request_timeout": {
      "type": "integer",
      "description": "Request Timeout",
      "defaultValue": 60
    },
    "table_name": {
      "type": "string",
      "description": "ITSM Table Name",
      "defaultValue": "incident"
    },
    "source": {
      "type": "string",
      "description": "Source Name for Incident/Alert",
      "defaultValue": ""
    },
    "alerts_count": {
      "type": "integer",
      "description": "Number of alerts to send per ITSM request",
      "defaultValue": 20
    },
    "itsm_resolve_retry_delay": {
      "type": "integer",
      "description": "Retry delay between resolution update attempts",
      "defaultValue": 90
    },
    "itsm_resolve_retry_count": {
      "type": "integer",
      "description": "Max retry attempts for resolution updates",
      "defaultValue": 3
    },
    "itsm_action_retry_count": {
      "type": "integer",
      "description": "“Default maximum retry attempts for all actions",
      "defaultValue": 3
    },
    "itsm_action_retry_interval": {
      "type": "integer",
      "description": "Default delay between action retries",
      "defaultValue": 5
    },
    "delay_between_dbl_actions": {
      "type": "integer",
      "description": "Execution delay between Create and its immediate resolution Update (Seconds)",
      "defaultValue": 60
    },
    "lookup_call_retry_count": {
      "type": "integer",
      "description": "Max retry attempts for all data lookup queries",
      "defaultValue": 3
    },
    "lookup_call_retry_delay": {
      "type": "integer",
      "description": "Retry delay between data lookup attempts",
      "defaultValue": 2
    },
    "action_name": {
      "type": "string",
      "description": "Action name to invoke in the template",
      "hidden": true,
      "uiDisplay": false,
      "defaultValue": ""
    }
  },
  "required": [
    "action_name",
    "instance",
    "host",
    "table_name"
  ]
}
- Imports: Import definitions required for executing the bot. For example:
imports.json.
imports.json
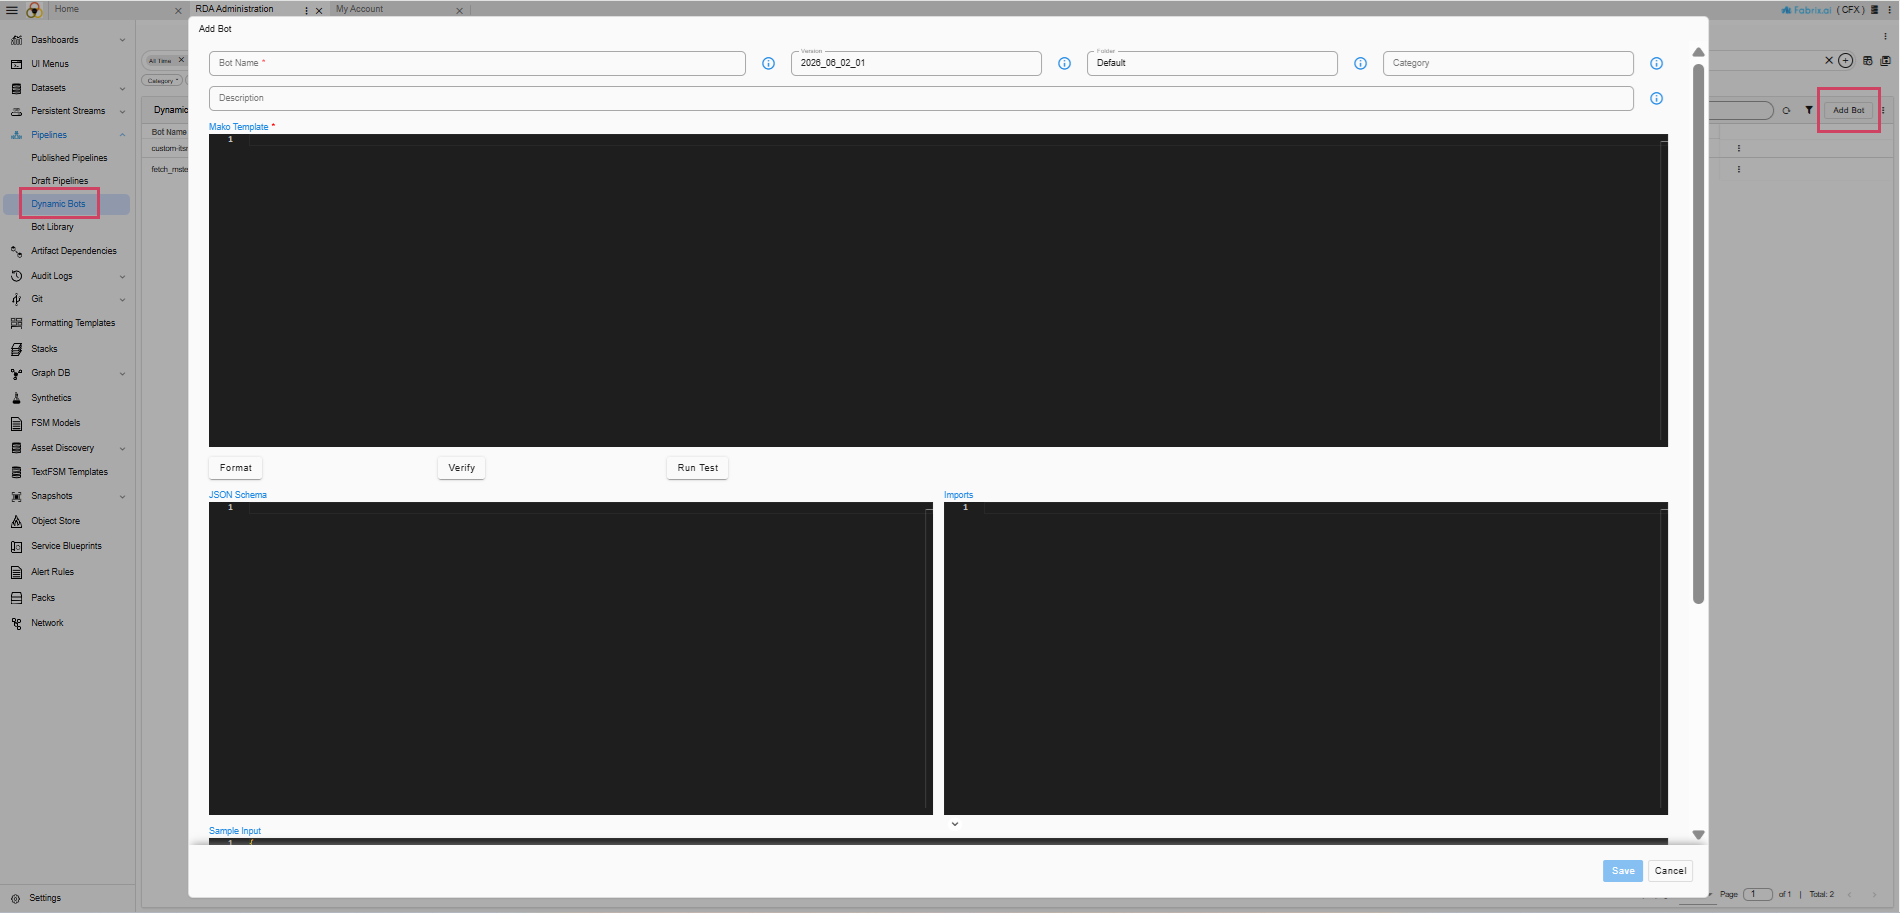
11.1.8.3 Create Credentials
Navigation: Configuration -> RDA Integration -> Credentials -> Add
For web-based applications, use the http-oauth credential type to create the required credentials.
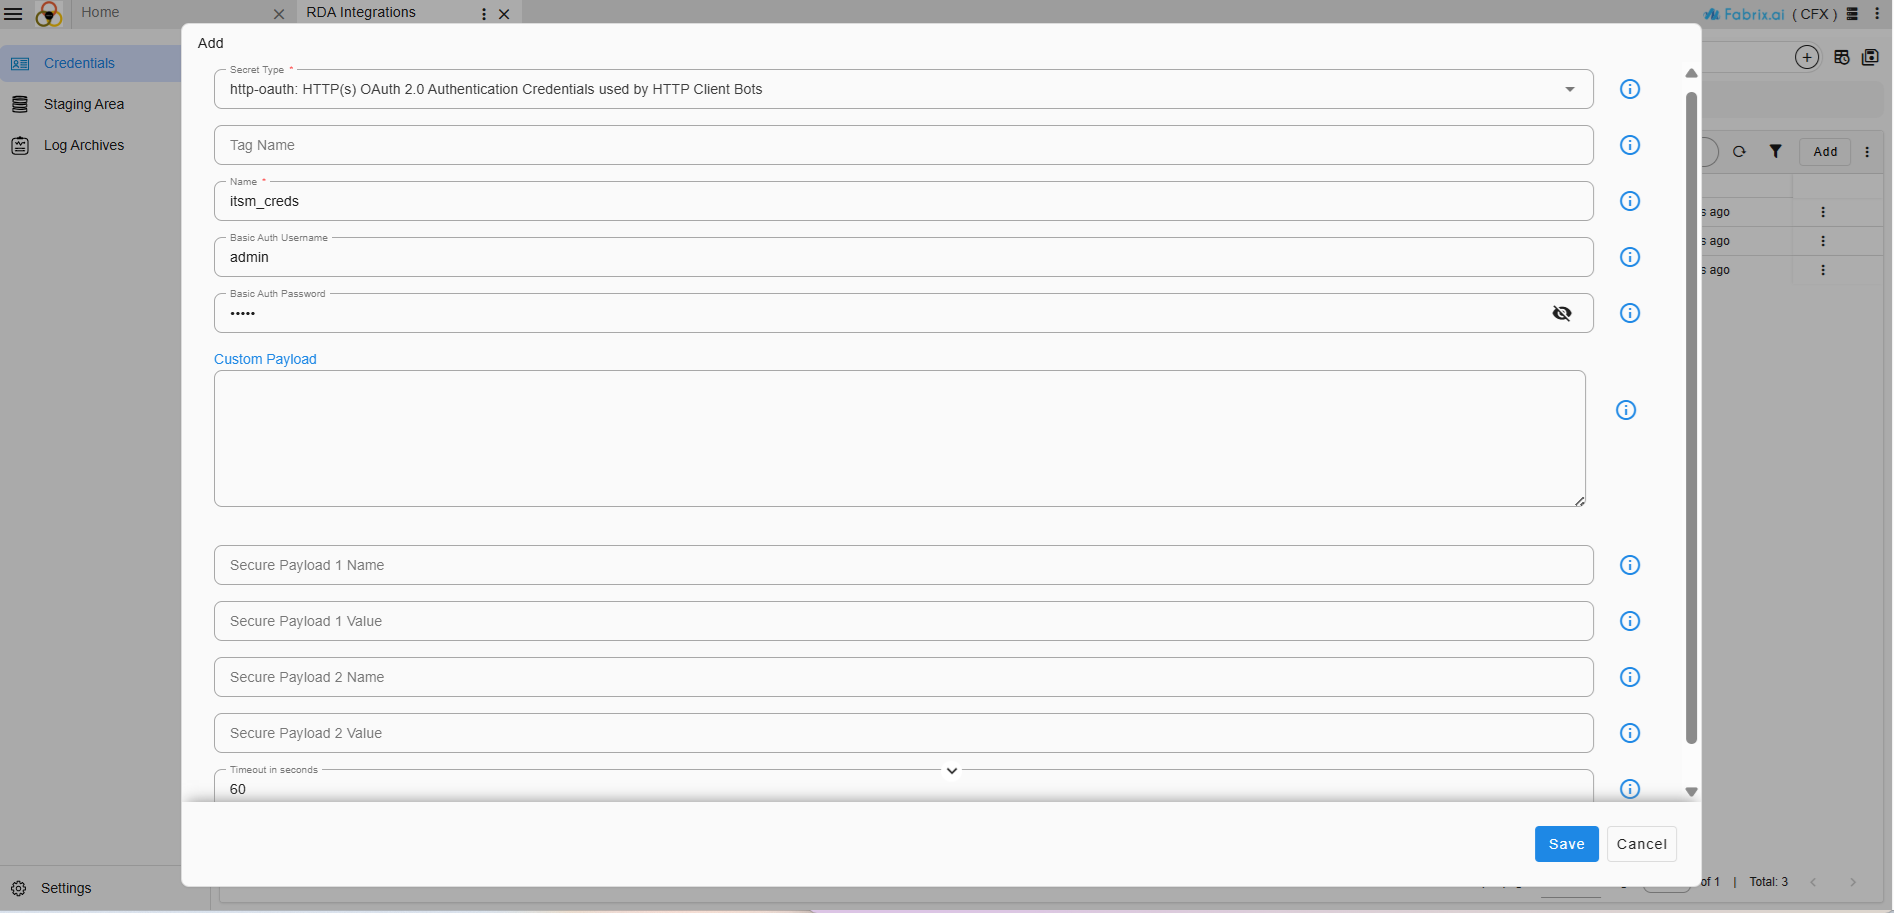
Note
Please note that in the current ProactiveCase endpoint definition screen, the fields labeled 'Client Id' and 'Secret' will now be sourced from the RDA Integration → Credentials section when using the new custom-ITSM. These fields will be referred to as Auth Username and Auth Password.
11.1.8.4 Configuring Endpoint to use Dynamic Bot
Navigation: Administration -> Organization -> Configure -> Incidents -> Incident Endpoint -> Add
1. Set Event Type to OIA Incident.
2. Set Endpoint Type to Custom ITSM Integration.
3. Under Dynamic Bot, select the previously created Dynamic Bot from the selection dialog.
4. Under Credential, select the appropriate credential from the selection dialog.
5. Populate the required dynamic fields displayed on the screen (for example, Hostname, Instance Name, etc.).
6. Click Check Connection after providing the hostname, credentials, and other required fields.
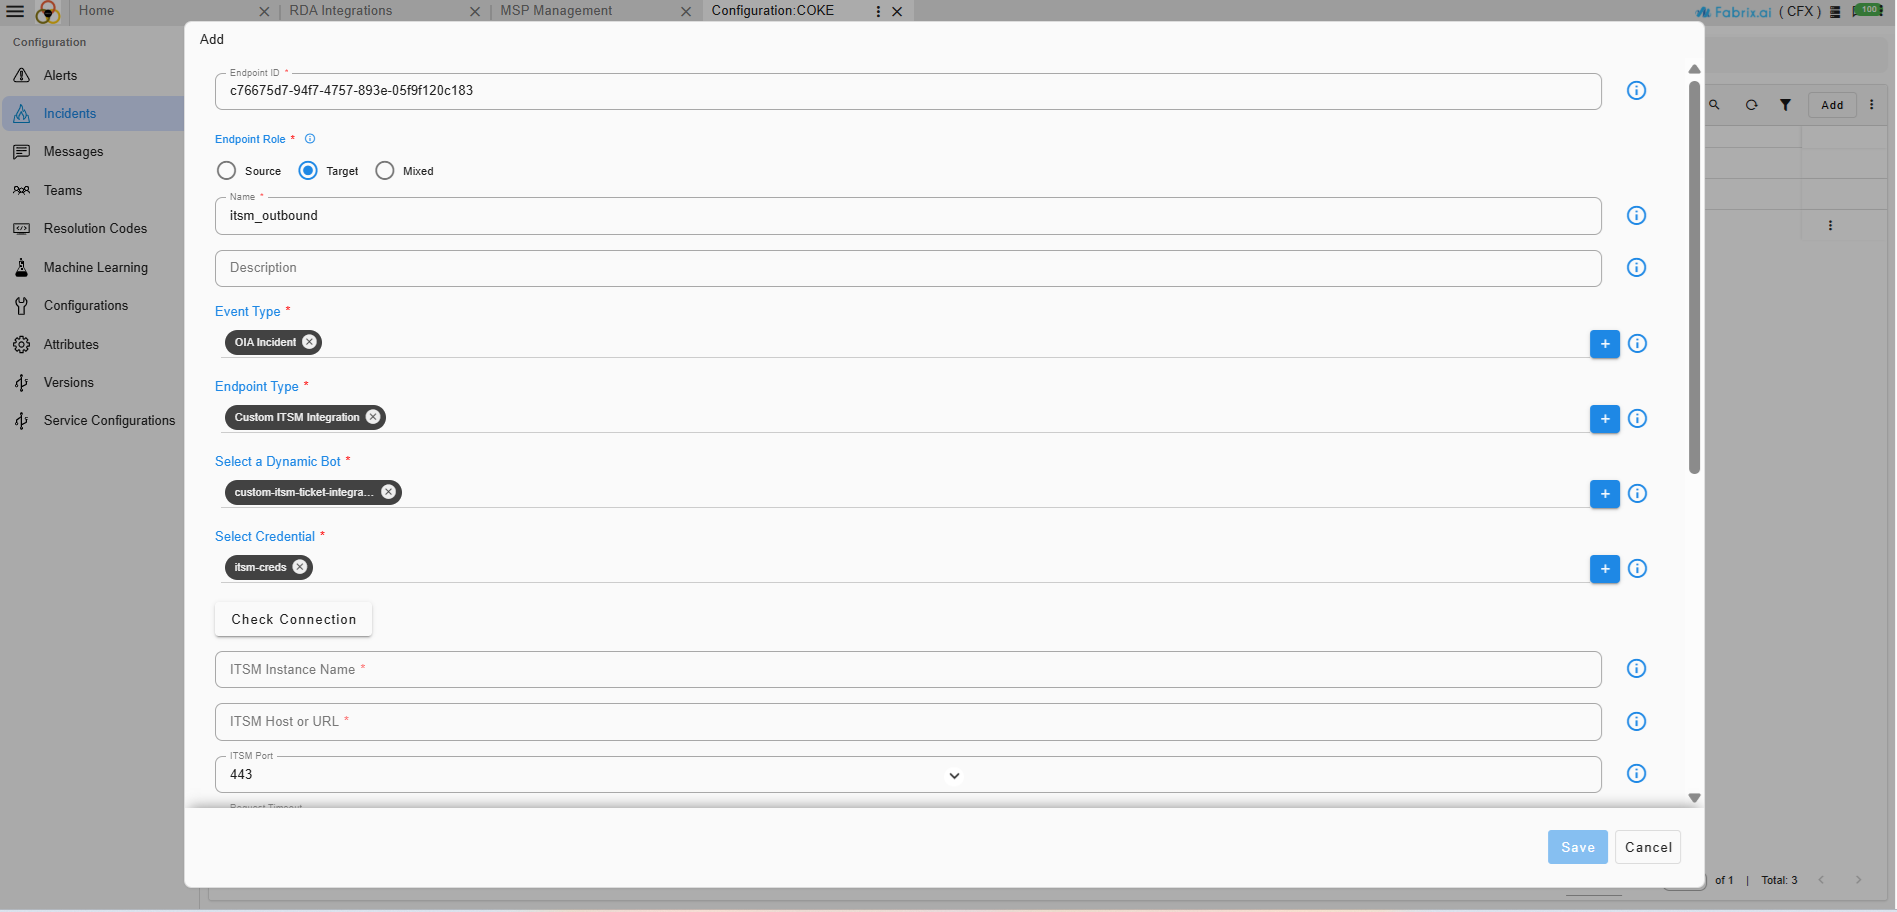
11.1.8.5 Example ITSM Dynamic Bot
Dynamic Bot Required Fields
The following fields are required for Dynamic Bot execution and must be defined in the bot's JSON schema:
Required for Dynamic Bot Invocation
The application framework invokes the Dynamic Bot using one of the supported action names.
- action_name – Specifies the action to be performed.
Supported values:
createupdategetDatagetURLvalidate
Required for ITSM Operations
The following fields are required for performing ITSM-related actions. The exact values and usage may vary depending on the target ITSM platform and implementation.
- instance – Target ITSM instance identifier.
- host – Hostname or base URL of the target ITSM system.
- table_name – Target table or entity on which the operation will be performed.
Dynamic Bot Code Response
The following fields are expected from the Dynamic Bot response for create and update actions. This ensures proper integration with the endpoint flow and allows the response to be displayed in Event Tracking and Collaboration Activity
{
  "rda_reason": "Missing required fields (state, description, short_description) to perform this action",
  "rda_status": "Fail",
  "sys_id": data.get("sys_id"),
  "ticketId": data.get("sys_id"),
  "number": data.get("number"),
  "elapse_time_ms": <time-elapse>,
  "rda_row_update_status":"Fail",
  "attempt_count": 1,
}
{
  "rda_reason": None,
  "rda_status": "Success",
  "sys_id": data.get("sys_id"),
  "ticketId": data.get("sys_id"),
  "number": data.get("number"),
  "elapse_time_ms": <time-elapse>,
  "attempt_count": 1,
}
11.1.9 Examples
11.1.9.1 Endpoint to Read from Kafka
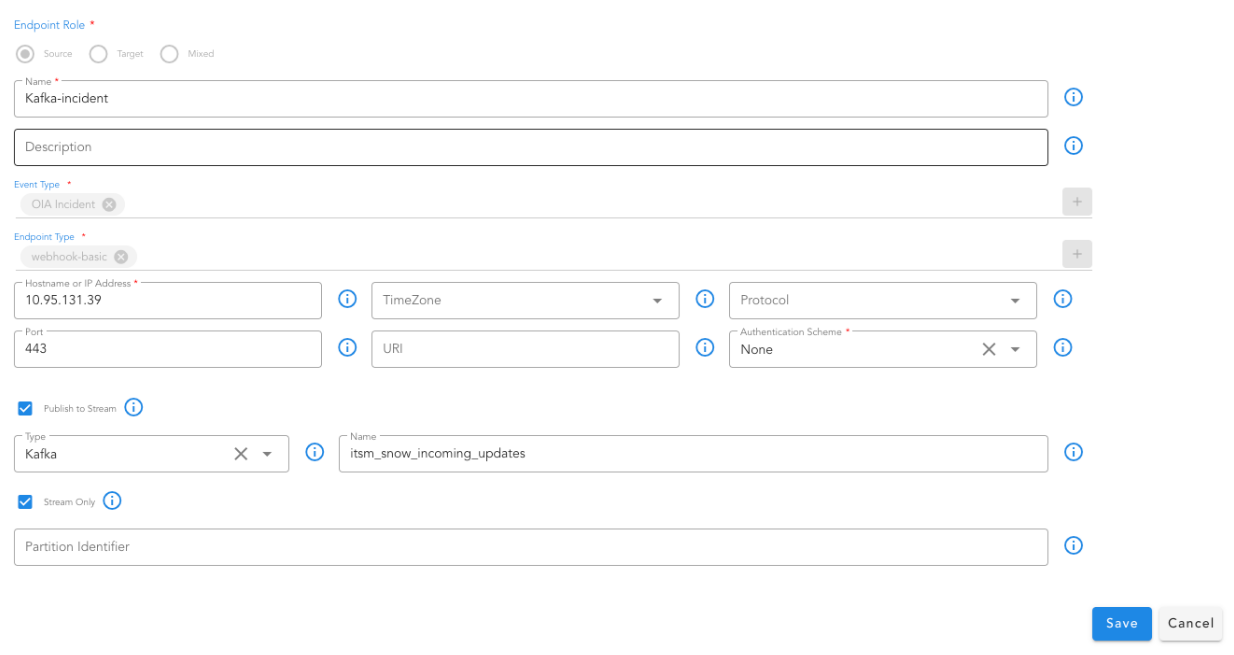
11.1.9.2 Webhook
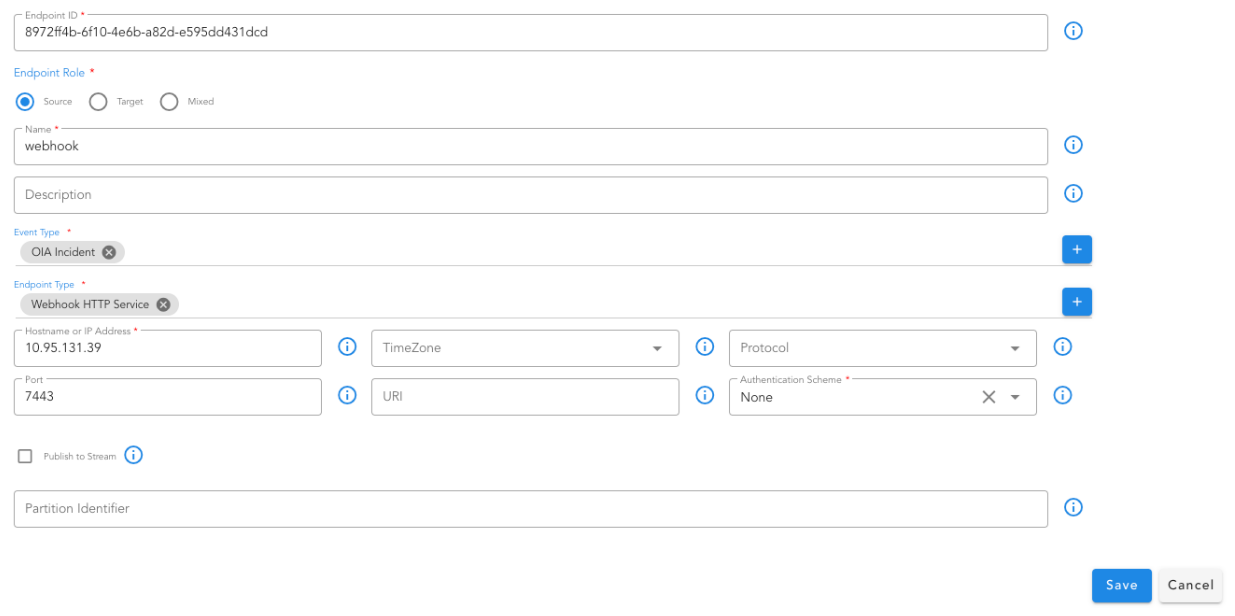
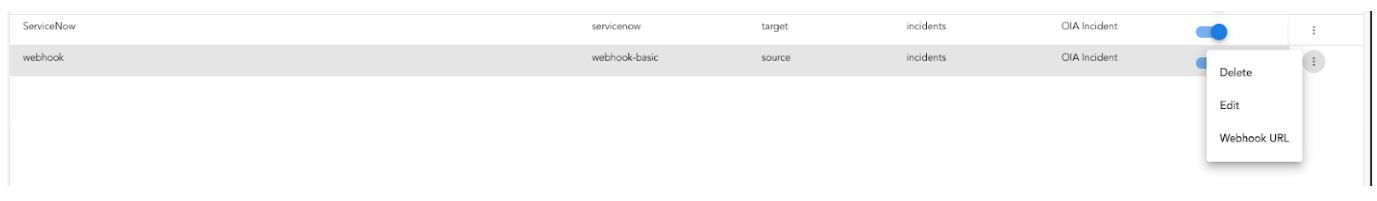
11.1.9.3 ServiceNow
11.1.9.3.1 Incident Endpoint
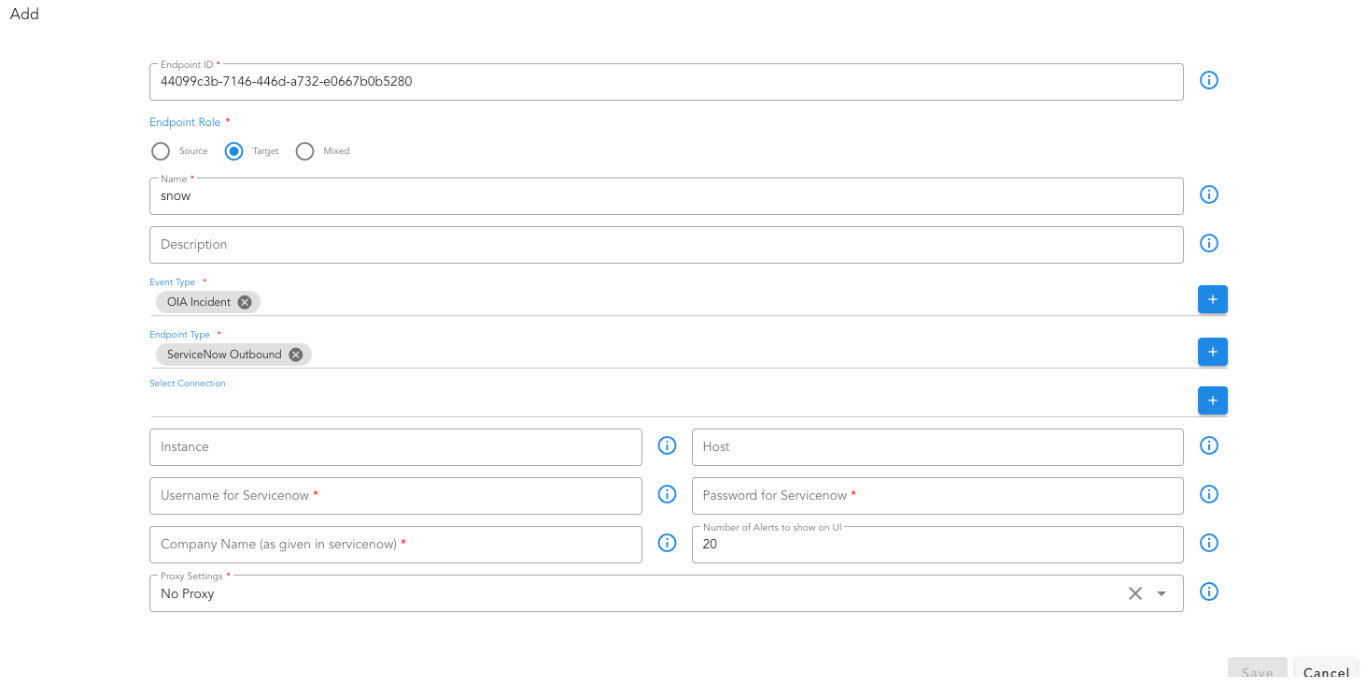
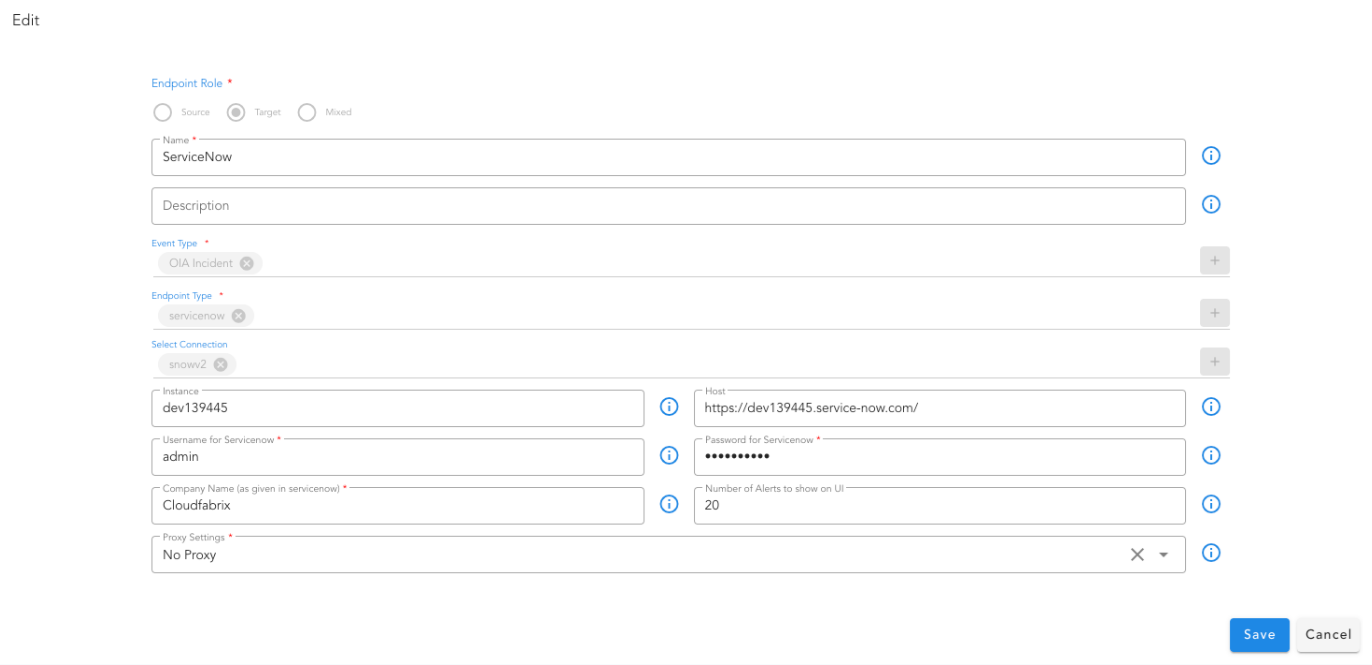
11.1.9.3.2 Incident Mapping
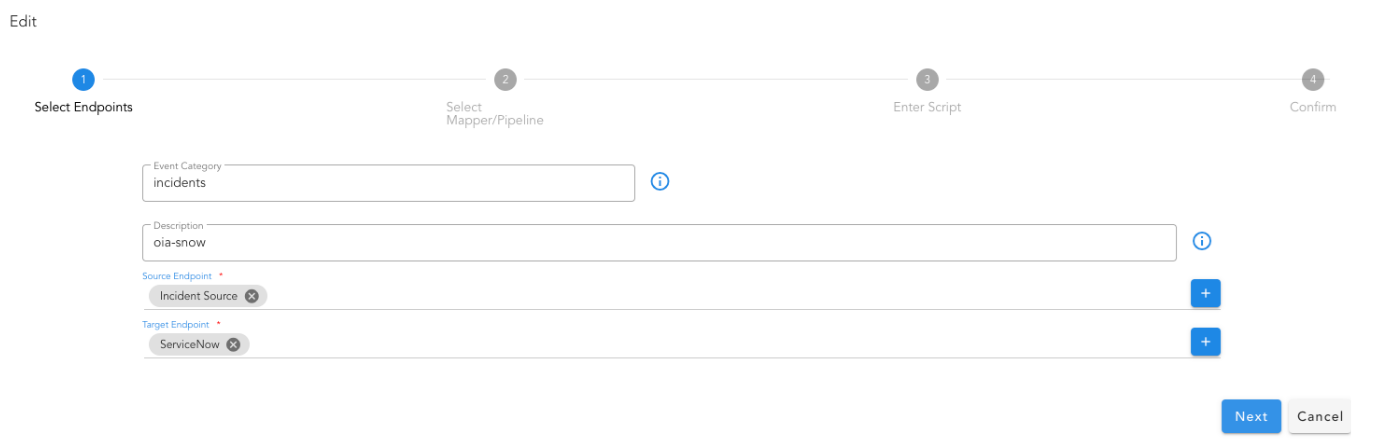
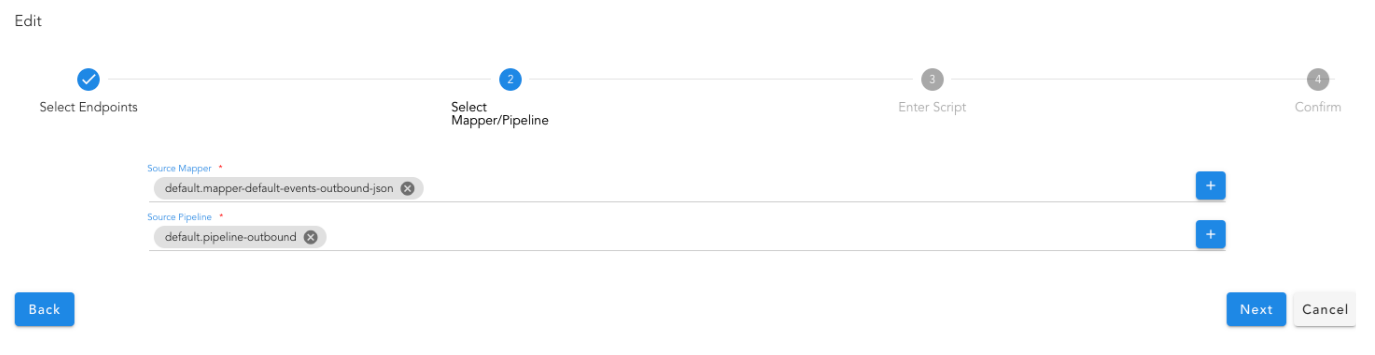
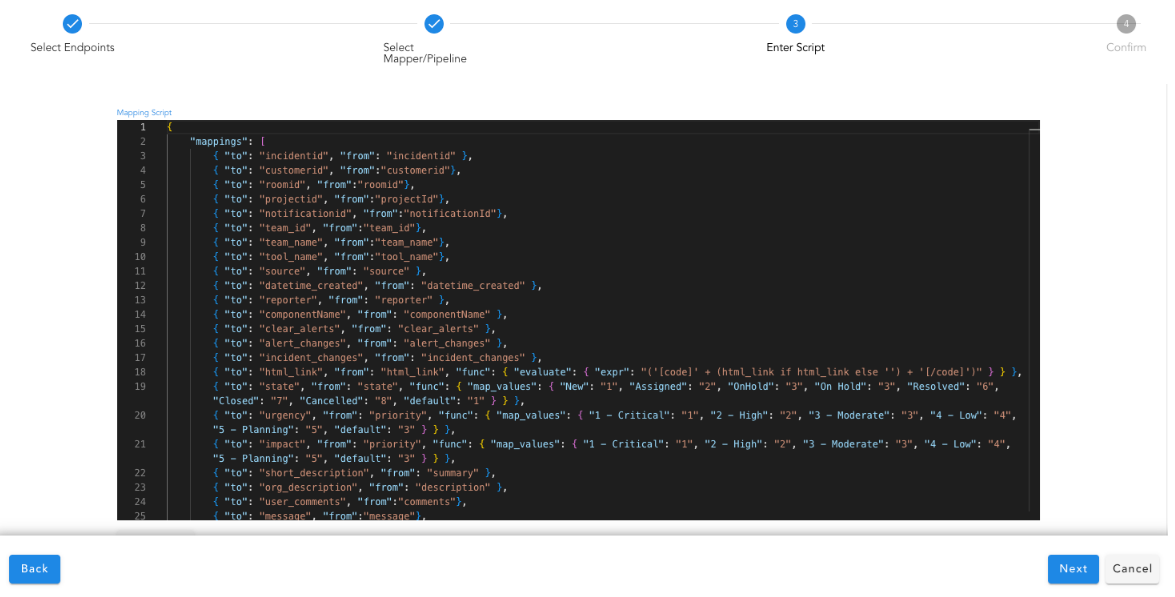
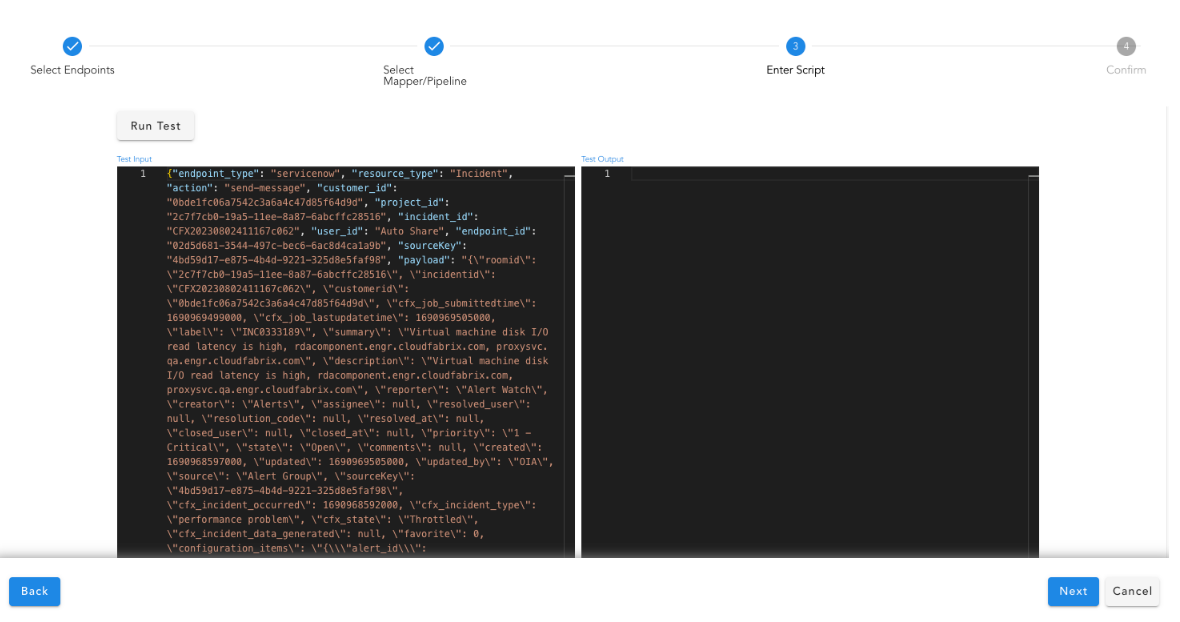

11.1.9.4 PagerDuty
11.1.9.4.1 Incident Endpoint
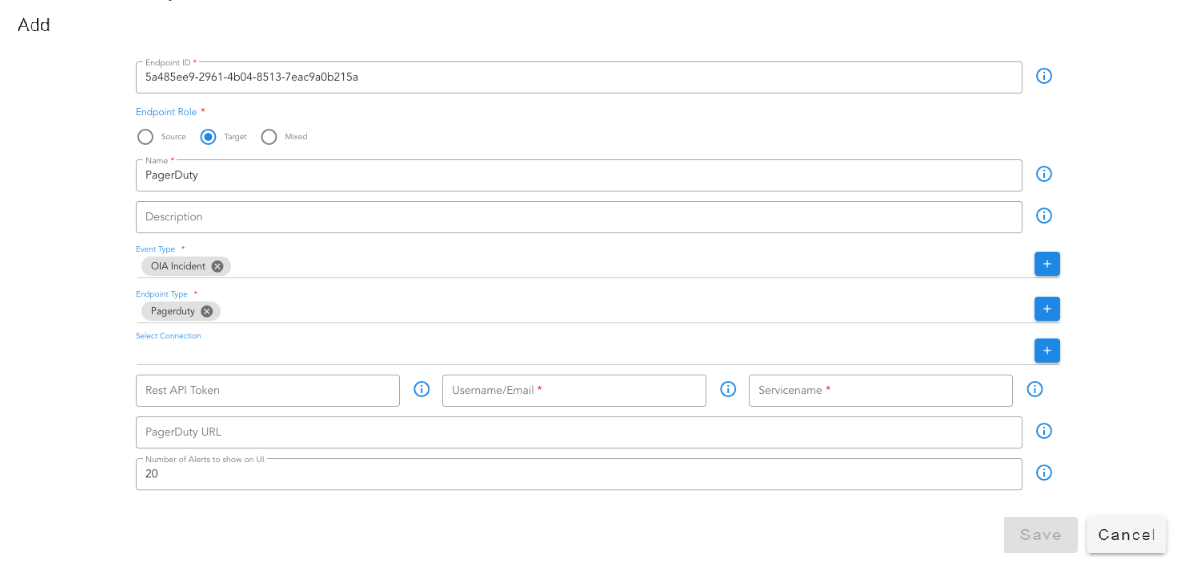
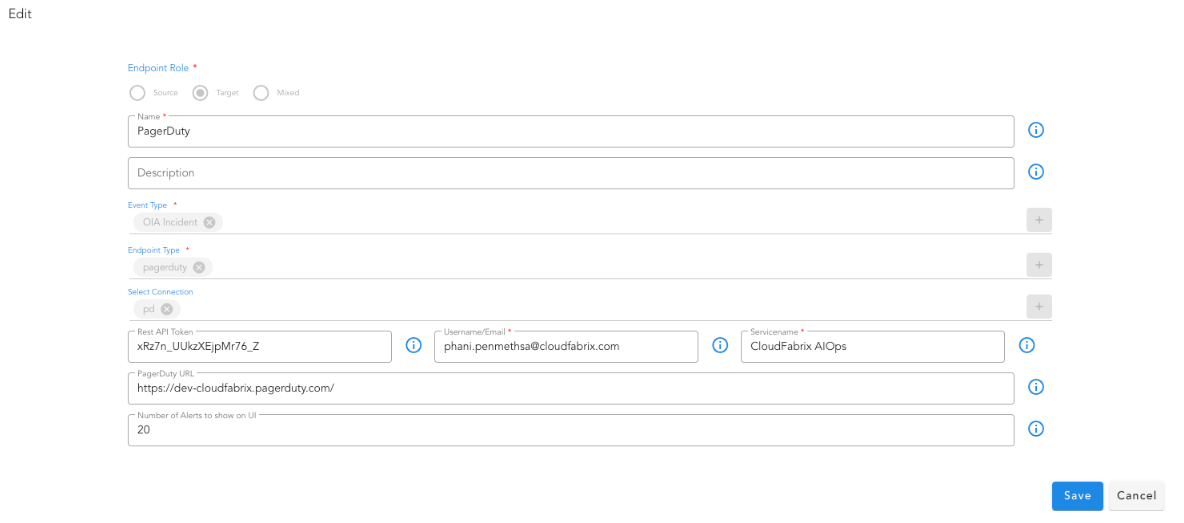
11.1.9.4.2 Incident Mapping
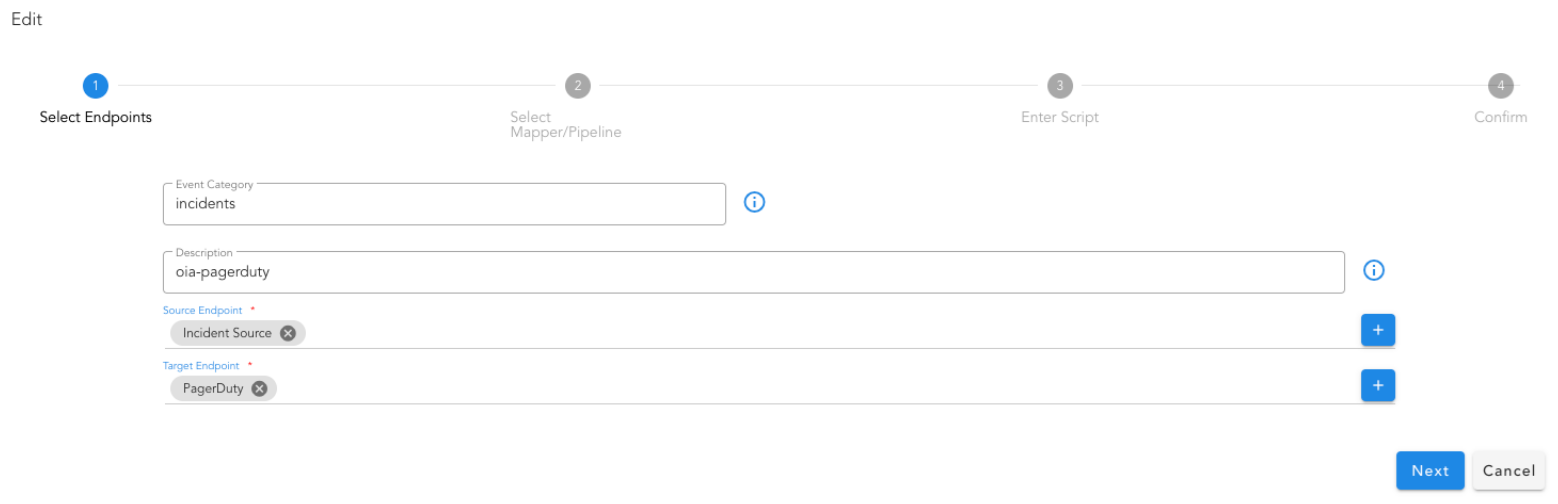
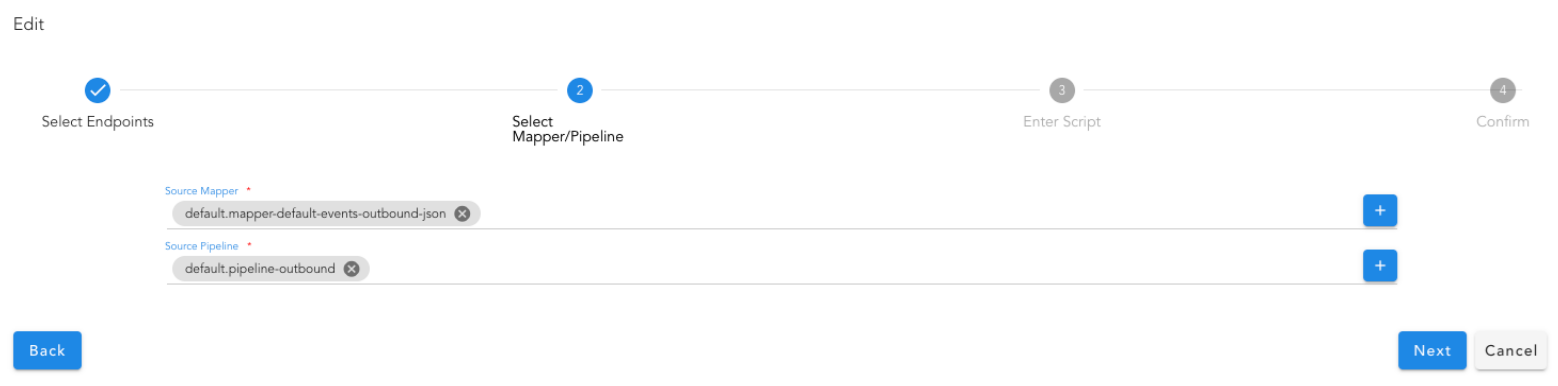
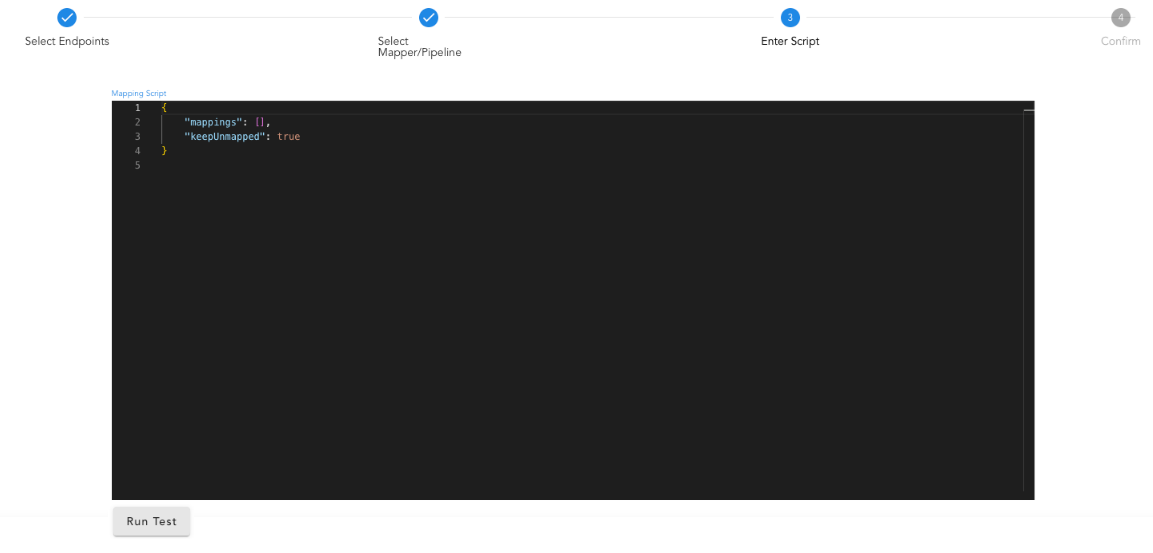
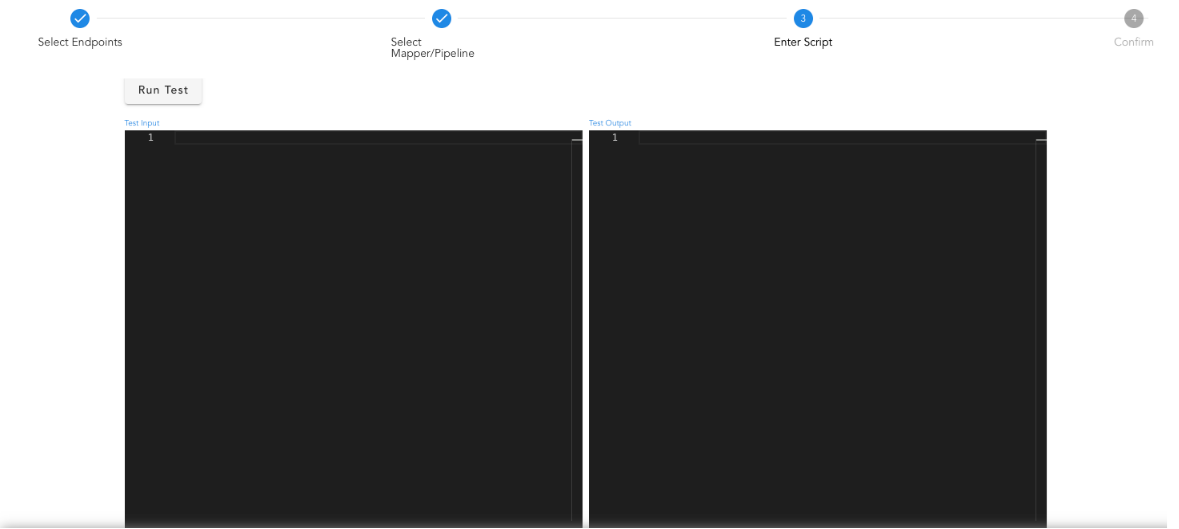
11.1.9.5 Create Team
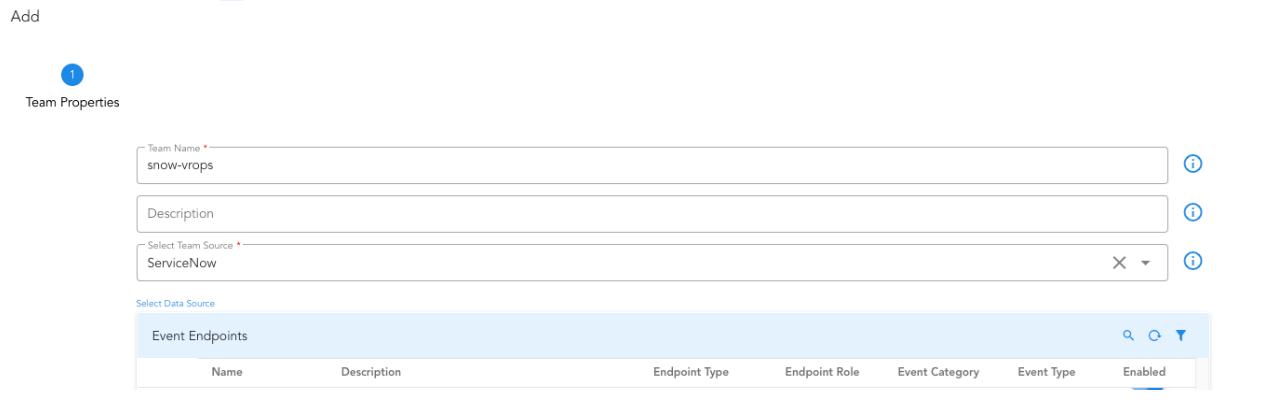
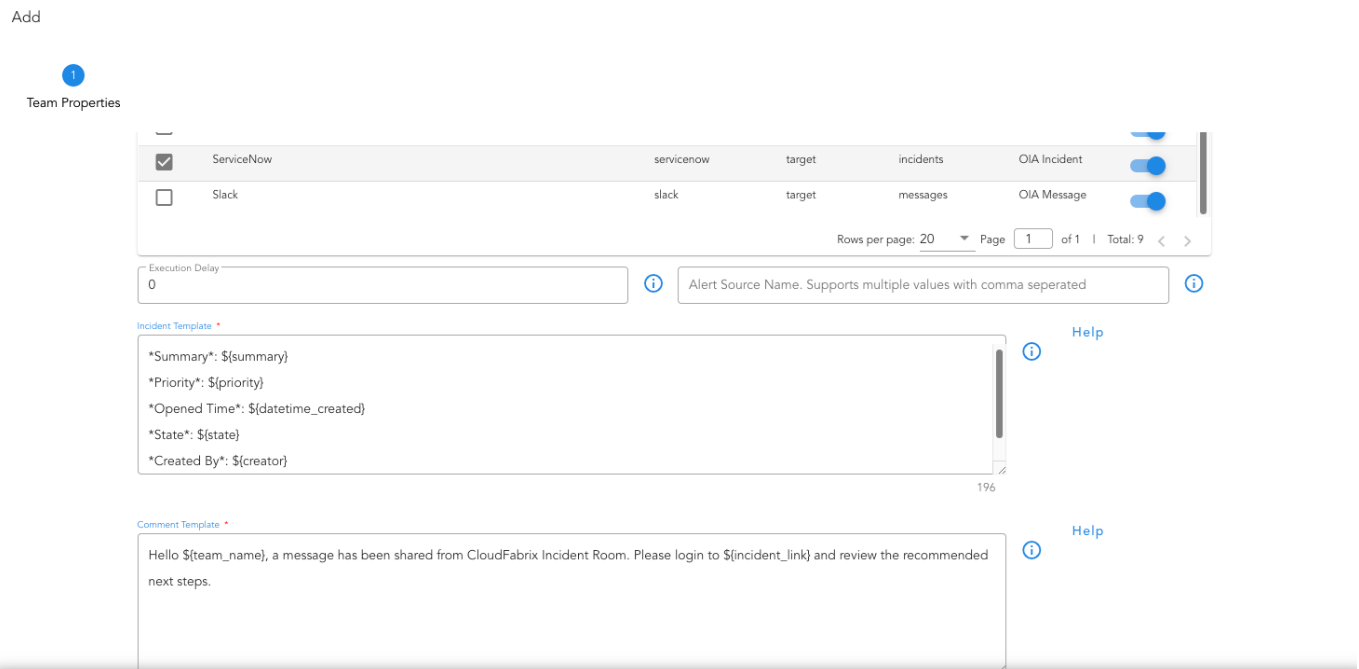
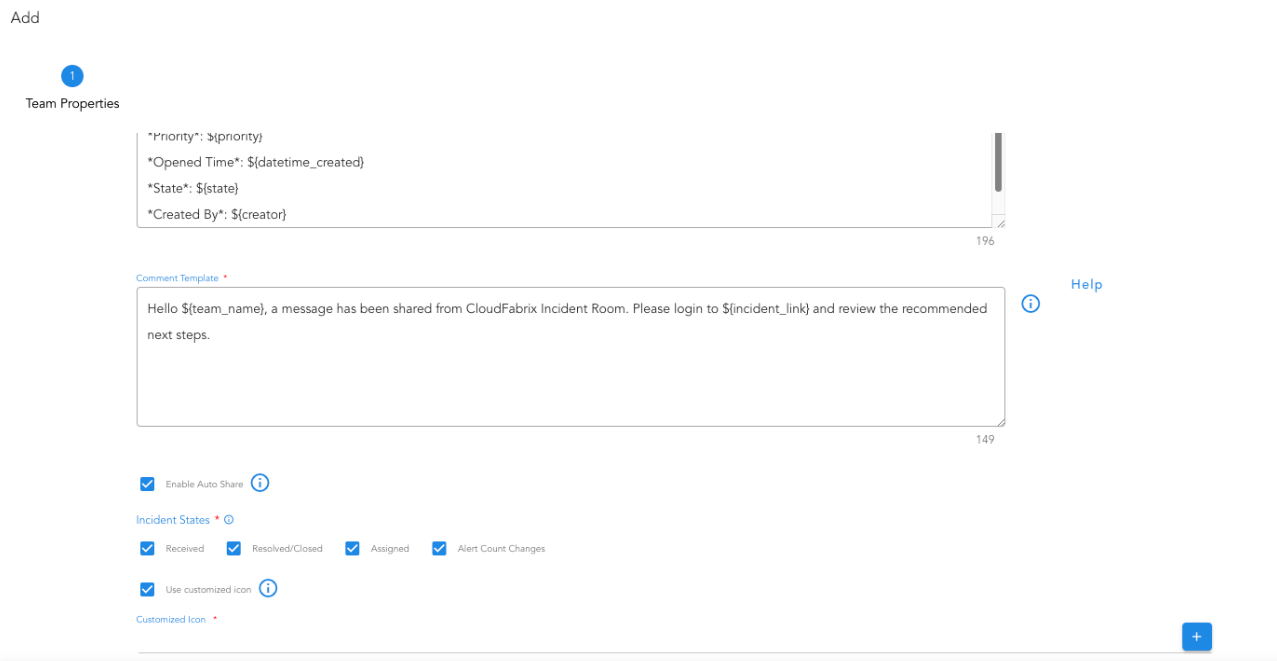
12. ML Driven Operations
cfxOIA uses machine learning (ML) at its core to intelligently learn patterns from huge volumes of historical as well as streaming data and automate key IT operational activities and decisions at large scale.
Key ML driven operations include:
- Alert Correlation (uses unsupervised ML)
- Log Clustering
- Alert volume seasonality
- Alert volume anomaly detection
- Alert volume prediction
- Incident triage data anomaly detection and noticeable changes
- Similar incidents
Prediction insights consist of forecasting alert volume or ingestion rate, providing a perspective into how many alerts Operations team can expect in future. cfxOIA can perform this prediction analysis on multiple dimensions, including alerts coming from a certain source, or alerts of certain application, severity, site or even alerts of certain symptom. In addition to prediction insights, cfxOIA also provides seasonality and anomaly detection when ML jobs are run, which can be executed on-demand or scheduled to be run periodically, which helps in continuos learning, training and testing of models.
cfxOIA currently supports 3 ML pipelines out of the box, Clustering, Classification and Regression. ML jobs allow hyper parameter tuning by making the selections from UI itself. Advanced customization scenarios allow uploading of new ML pipelines.
Learn more about:
13. Analytics
cfxOIA provides key analytics to track AIOps related KPIs like noise reduction efficiency, Alert ingestion trends, Most chatty alert types, etc. cfxOIA has a unique data exploration feature called Quick Insights that provides an at-a-glance visual clue of distribution and other characteristics of data. Quick Insights on Incidents provide visual clues about the distribution of Incidents based on priority, Support-group, Incident-age, Environment, Application, Department, etc.
Learn more about:
14. UI features
cfxOIA provides a web-based portal that is accessible via a standard browser and uses HTML 5 to render User Interface (UI). There is no need to install any thick client to access the cfxOIA web-portal. cfxOIA portal provides certain advanced UI features for efficient data handling and customization.
Filters: Allow efficient filtering, Saving, and Reusing filters. Table View Customization
Learn more about:
Customize Columns: Displayed in the table, Change the order of columns.
Learn more about:
Exporting Data: Exporting data like Incidents, Alerts, etc.
Learn more about:
15. OIA Diagnostic & Remediation Tools Setup Guide
This document describes the prerequisites and instructions for setting up tools for any setup.
15.1 Prerequisites
-
The first and most important prerequisite is that the setup must have a stack, and each incoming alert (and corresponding incident) should be mapped to that stack, along with the enriched
node_idof the affected node by that alert/Incident. -
Next, the team member making the changes should have a thorough understanding of the nodes and their attributes. This is essential because not all tools are suitable for every node in the stack. Therefore, selecting the appropriate tool for each node based on its attributes is crucial and depends on the setup and node characteristics in the field.
-
Each tool operates within its own pipeline, and specific inputs must be provided to each tool within that pipeline. The first step in every pipeline is to read the selected node and other form inputs before proceeding with the bot execution.
-
Additionally, oia,diagnostictools and remediationtools bot credentials must already be added to the list of integrations.
15.2 Steps to Setup Tools
-
Begin by updating the
oia_tools_descriptordraft pipeline to reflect the appropriate nodes for each tool in the stack. Based on the selected nodes, adjust thenode_filtercolumn for each tool in the pipeline and execute it. -
Next, verify that each tool listed in the
oia_tools_descriptorpipeline has its corresponding named pipeline published.
15.3 Output Structure of the Tool Pipeline
-
The output must be a json with a semi-flexible structure, as detailed below.
-
The output json must contain at least four mandatory columns, in addition to any optional columns:
-
Collection_status – Valid values: Success or Failed.
-
Collection_timestamp – A long integer representing the number of milliseconds since the epoch.
-
Reason – A string with an empty value for success, or a short error message in case of failure.
-
full_json_output – This is a string representation of a JSON dictionary that must contain the following mandatory keys (in addition to any optional data):
- diag-status – Valid values: Success or Failed.
- diag-message – A string, empty for success or containing a short error message in case of failure.
- displayAttributes – A JSON array where each item includes a “key” and a “value” pair. For a successful response, this data will be rendered as a visible table in the UI.
-
- A Example Pipeline for the checkport tool, which verifies whether a specified port is open on a selected asset.
@exec:get-input
   --> @dm:explode-json column='node'
   --> @dm:add-missing-columns columns='vm_ip_address,switch_ip_address,app_comp_ip_address,port'
   --> @dm:to-type columns='port' and type='int'
   --> @dm:selectcolumns include='^vm_ip_address$|^switch_ip_address$|^app_comp_ip_address$|^port$'
   --> @dm:eval tool_ip_address = "vm_ip_address if vm_ip_address else (switch_ip_address if switch_ip_address else app_comp_ip_address)"
   --> @diagnostictools:checkport column_name_host = 'tool_ip_address' and column_name_port = 'port'
-
Example Pipeline content for the tools descriptor. Each row represents a tool, with the following fields:
- tool_type: Specifies whether the tool is for "diagnostics" or "remediation".
- tool_id: A unique identifier for each tool, specific to its type.
- tool_label: The name of the tool, as displayed on the UI.
- pipeline_name: The name of the published pipeline that should be executed for the tool.
- description: A brief overview of the tool's function.
- node_filter: A CFXQL filter used to select the applicable nodes from the incident stack for the tool.
- inputs (optional): Defines any additional inputs that may be required from the user for the tool's execution.
@dm:empty
   --> @dm:addrow type='diagnostics' and tool_id = 'icmp_ping' and tool_label = 'ICMP Ping' and pipeline_name = 'oia_tools_diagnostic_ping' and description='Verify connectivity using ICMP Ping' and node_filter = 'node_type in ["Controller", "Database", "Datastore", "Host", "VM", "Switch"]'
   --> @dm:addrow type='diagnostics' and tool_id = 'check_open_port' and tool_label = 'Check Open Port' and pipeline_name = 'oia_tools_diagnostic_checkport' and description='Checks whether asked port is open on the target host' and node_filter = 'node_type in ["Controller", "Database", "Datastore", "Host", "VM", "Switch"]' and inputs='{ "attributes": [ { "name": "port", "label": "Port", "description": "Port number", "mandatory": true, "value-type": "string"} ] }'
   --> @dm:save name='oia_tools_descriptor'
15.4 Functionality Of All The Tools
Important
Supported IP address formats for tools: Examples include 192.168.10.10,192.168.10.11, 192.168.20.0/24, 192.168.30.10-192.168.30.100, or any combination of these formats as comma-separated values.
All tools support IP addresses, except for the URL check bot, which takes a URL as input.
15.4.1 Traceroute
Core Functionality:
- This tool performs a traceroute to determine the path packets take to reach the destination, providing detailed information about each hop along the route.
Command: (Linux/macOS)
The main command used in this traceroute function is
Traceroute works on both Linux and macOS platforms.
Input:
- A list of IP addresses or IP ranges provided in the specified column of the input.
Output:
- A json containing the destination IP, destination name, and the hops traversed.
@dm:empty
-> @dm:addrow ip = '192.168.125.126'
  --> @diagnostictools:traceroute column_name_host="ip"
15.4.2 Ping
Core Functionality:
- Sends ICMP echo requests to determine the reachability and latency of a host.
Command: (Linux/macOS)
Ping works on both Linux and macOS platforms.
Input:
- A list of IP addresses or IP ranges provided in the specified column of the input and a defined number of pings (count).
Output:
- A json containing the minimum, maximum, and average round-trip time (RTT), as well as packet loss.
@dm:empty
    --> @dm:addrow ip = '192.168.131.111'
    --> @diagnostictools:ping column_name_host="ip" and column_name_count=4 and concurrent_discovery=10
15.4.3 MemoryCheck
Core Functionality:
- Connects to remote machines via SSH to retrieve memory usage statistics.
Command: (Linux/macOS)
Input:- An IP address, username, and password for the SSH connection provided in the respective columns of the input.
Output:
- A json containing memory information such as total, free, and available memory.
@dm:empty
-->  @dm:addrow ip = '10.95.125.126, 10.95.107.60' and column_name_username = 'rdauser' and column_name_password= 'xxxxxxxxxx
-->  @diagnostictools:memorycheck  column_name_host="ip" and column_name_username = 'column_name_username' and column_name_password= 'column_name_password'
15.4.4 DiskSpace
Core Functionality:
- Connects to remote machines via SSH to retrieve disk space usage.
Command: (Linux/macOS)
Input:
- An IP address, username, and password for the SSH connection provided in the respective columns of the input.
Output:
- A json containing disk usage information such as filesystem, size, used, available space, percentage used, and mount point.
@dm:empty
-->  @dm:addrow     ip = '10.95.107.60' and column_name_username = 'rdauser' and column_name_password= 'xxxxxxxxxx
-->  @diagnostictools:diskspace      column_name_host="ip" and column_name_username = 'column_name_username' and column_name_password= 'column_name_password'
15.4.5 UpTime
Core Functionality:
- Connects to remote machines via SSH to retrieve system uptime.
Command: (Linux/macOS)
Input:
- An IP address, username, and password for the SSH connection provided in the respective columns of the input.
Output:
- A json containing system uptime in a human-readable format (days, hours, minutes, seconds).
@dm:empty
    --> @dm:addrow     ip = '10.95.125.126' and column_name_username = 'rdauser' and column_name_password= 'xxxxxxxxxx
    --> @diagnostictools:uptime column_name_host="ip" and column_name_username = 'column_name_username' and column_name_password= 'column_name_password'
15.4.6 SystemLoad
Core Functionality:
- Connects to remote machines via SSH to retrieve system load information, including CPU, memory, swap, disk, and network stats.
Command: (Linux/macOS)
Input:
- An IP address, username, and password for the SSH connection provided in the respective columns of the input.
Output: A json containing system metrics like:
-
Load Average 1 min: The 1-minute load average.
-
Load Average 5 min: The 5-minute load average.
-
Load Average 15 min: The 15-minute load average.
-
CPU Usage (%): The percentage of CPU usage.
-
Total Memory (kB): The total memory.
-
Used Memory (kB): The used memory.
-
Free Memory (kB): The free memory.
-
Swap Total (kB): The total swap space.
-
Swap Used (kB): The used swap space.
-
Swap Free (kB): The free swap space.
-
Disk Total (kB): The total disk space.
-
Disk Used (kB): The used disk space.
-
Disk Free (kB): The free disk space.
-
Bytes Sent (kB): The bytes sent.
-
Bytes Received (kB): The bytes received.
@dm:empty
    --> @dm:addrow     ip = '10.95.125.126' and column_name_username = 'rdauser' and column_name_password= 'xxxxxxxxxx
    --> @diagnostictools:systemload column_name_host="ip" and column_name_username = 'column_name_username' and column_name_password= 'column_name_password'
15.4.7 Check_SSL
Core Functionality:
- Fetches the certificate details such as issuer, subject, validity dates, and other certificate metadata.
Command: (Windows/Linux/macOS)
Input:
- A list of IP addresses or IP ranges provided in the specified column of the input and port number list for respective IPs
Output:
- A json containing SSL certificate details for each IP address and port.
@dm:empty
    --> @dm:addrow ip = '10.95.125.126' & port=443
    --> @diagnostictools:checkssl column_name_host="ip" and column_name_port="port" and  json_output_flag = true
15.4.8 AWS Alarms
Core Functionality:
- Fetches and processes AWS CloudWatch alarms using provided credentials and region information
Command: (Windows/Linux)
Input:
- An AWS region (e.g., us-east-1), AWS access key, AWS secret key in the respective columns of the input.
Output: A json containing CloudWatch alarm metrics:
-
Alarm Name: Name of the CloudWatch alarm.
-
State: Current state of the alarm (e.g., ALARM, OK, INSUFFICIENT_DATA).
-
Metric Name: Name of the associated metric (e.g., CPUUtilization).
-
Namespace: AWS namespace (e.g., AWS/EC2).
-
Actions Enabled: Boolean indicating if actions are enabled
@dm:empty
    --> @dm:addrow ip = 'us-east-1' and column_name_username = 'AKIASOVSWMOI6DVPEL5N' and column_name_password= 'j+FSAs/Wbrir7nDP6lK4iAXynGrjr8fOcTJH8lQA'
    --> @diagnostictools:AwsAlarms  region_name="ip" and aws_access_key_id = 'column_name_username' and aws_secret_access_key= 'column_name_password'
--> @dm:save name= 'awsnew'
15.4.9 vCenter Monitoring
Core Functionality:
- Uses pyVmomi (VMware's Python SDK) to connect to VMware vCenter , retrieves VM Metrics (CPU, Memory) and triggers alarms if input CPU or memory usage thresholds are exceeded.
Note
Instead of direct vCenter commands, user can utilize the pyVmomi Python module for core functionality, ensuring a consistent and programmatic approach.
Input:
- A list of IP addresses or IP ranges, username, and password for the connection, metric type and threshold provided in the specified column of the input.
Output:
- A json containing VM metrics and alarm statuses (CPU/Memory usage) for respective IP addresses
@dm:empty
    --> @dm:addrow ip = '10.95.159.151' and column_name_username = 'administrator@vsphere.local' and column_name_password= 'Abcd123$' and th = 80 and metric = 'cpu'
    --> @diagnostictools:vcenteralarm  column_name_host="ip" and column_name_username = 'column_name_username' and column_name_password= 'column_name_password' and column_name_metric_type = 'metric' and column_name_threshold = 'th'
15.4.10 NetApp
Core Functionality:
- Retrieves system version information using NetApp’s API.
Command: Retrieve system status and version information from NetApp systems based on provided credentials.
Input:
- A list of IP addresses or IP ranges, username, and password for the HTTP connection provided in the respective columns of the input.
Output:
- A json containing System version or failure reason for respective IP addresses
@dm:empty
    --> @dm:addrow ip = '10.95.131.51' and column_name_username = 'rouser' and column_name_password= 'abcd123$'
    --> @diagnostictools:NetAppStatus  column_name_host="ip" and column_name_username = 'column_name_username' and column_name_password= 'column_name_password' and json_output_flag = true
15.4.11 Service Controller:(Belongs to remediation tools)
Core Functionality:
- Triggers start, stop, check status on remote systems
Linux Commands:
-
systemctl status
: Get the service status. -
sudo systemctl start
: Start the service. -
sudo systemctl stop
: Stop the service.
Windows Commands:
-
sc query
: Query the status of the service. -
sc start
: Start the service. -
sc stop
: Stop the service.
Input:
- A list of IP addresses or IP ranges, username, password, service name, action(start, stop, status) provided in the respective columns of the input.
Output:
- A json containing Result of the command execution for respective IP addresses and optionally Service Name, Active, Docs, Main PID, Tasks, Memory (for Linux services)
@dm:empty
    --> @dm:addrow ip = '10.95.107.60' and column_name_username = 'rdauser' and column_name_password= 'rdauser1234' and column_name_service_name = 'docker' and column_name_action = 'status'
    --> @remediationtools:servicecontroller  column_name_host="ip" and column_name_username = 'column_name_username' and column_name_password= 'column_name_password' and column_name_service_name = 'column_name_service_name' and column_name_action = 'column_name_action' and json_output_flag = true
16. OIA Incident Metrics Setup Guide(Version 8.1 Onwards)
Note
This guide applies to OIA deployments starting from version 8.1 and above.
16.1 Requirements
-
Prior to the 8.1 release, the Incident Metrics page was tightly coupled with OIA, relying on data from specific pstreams in a fixed format. This limited flexibility and made it difficult to configure which metrics to display.
-
Additionally, any dashboard customizations—such as modifying or adding widgets for incident metrics—were overwritten during major or minor upgrades when updated dashboard bundles were deployed. Field-level configurations like widget settings and data mappings should remain intact across releases.
-
The goal is to make the incident metrics page easily understandable, flexible, and configurable, allowing users to define and persist metric widgets without disruption during upgrades.
16.2 Implemented Solution
The configuration that defines which metrics to display for incidents has been externalized to the oia-incident-page-config pstream. This configuration is now accessible via the UI, enabling easier reference and editing. It is consumed by a JINJA-based widget generator used in the default Incident Details Metrics Page dashboard.
Further details about the configuration format and usage are provided in the subsequent sections of this document.
Each timeseries widget, by default, uses a time window relative to the incident occurrence time: from -12 hours to +4 hours.
For new organizations, a default (dummy) entry is automatically created for the incident metrics page, which should be customized based on alert and metric data availability.
For existing organizations upgrading to 8.1, users are required to manually add the configuration for the incident metrics page.
16.3 Location of the Configuration in UI
To access the page configuration, navigate from the left-side menu Administration → Organizations → Configure (via the card-level action).
This opens a new tab with various organization-level configurations. In that tab, go to Incidents → Incident Page Configuration (3rd tab in the page).
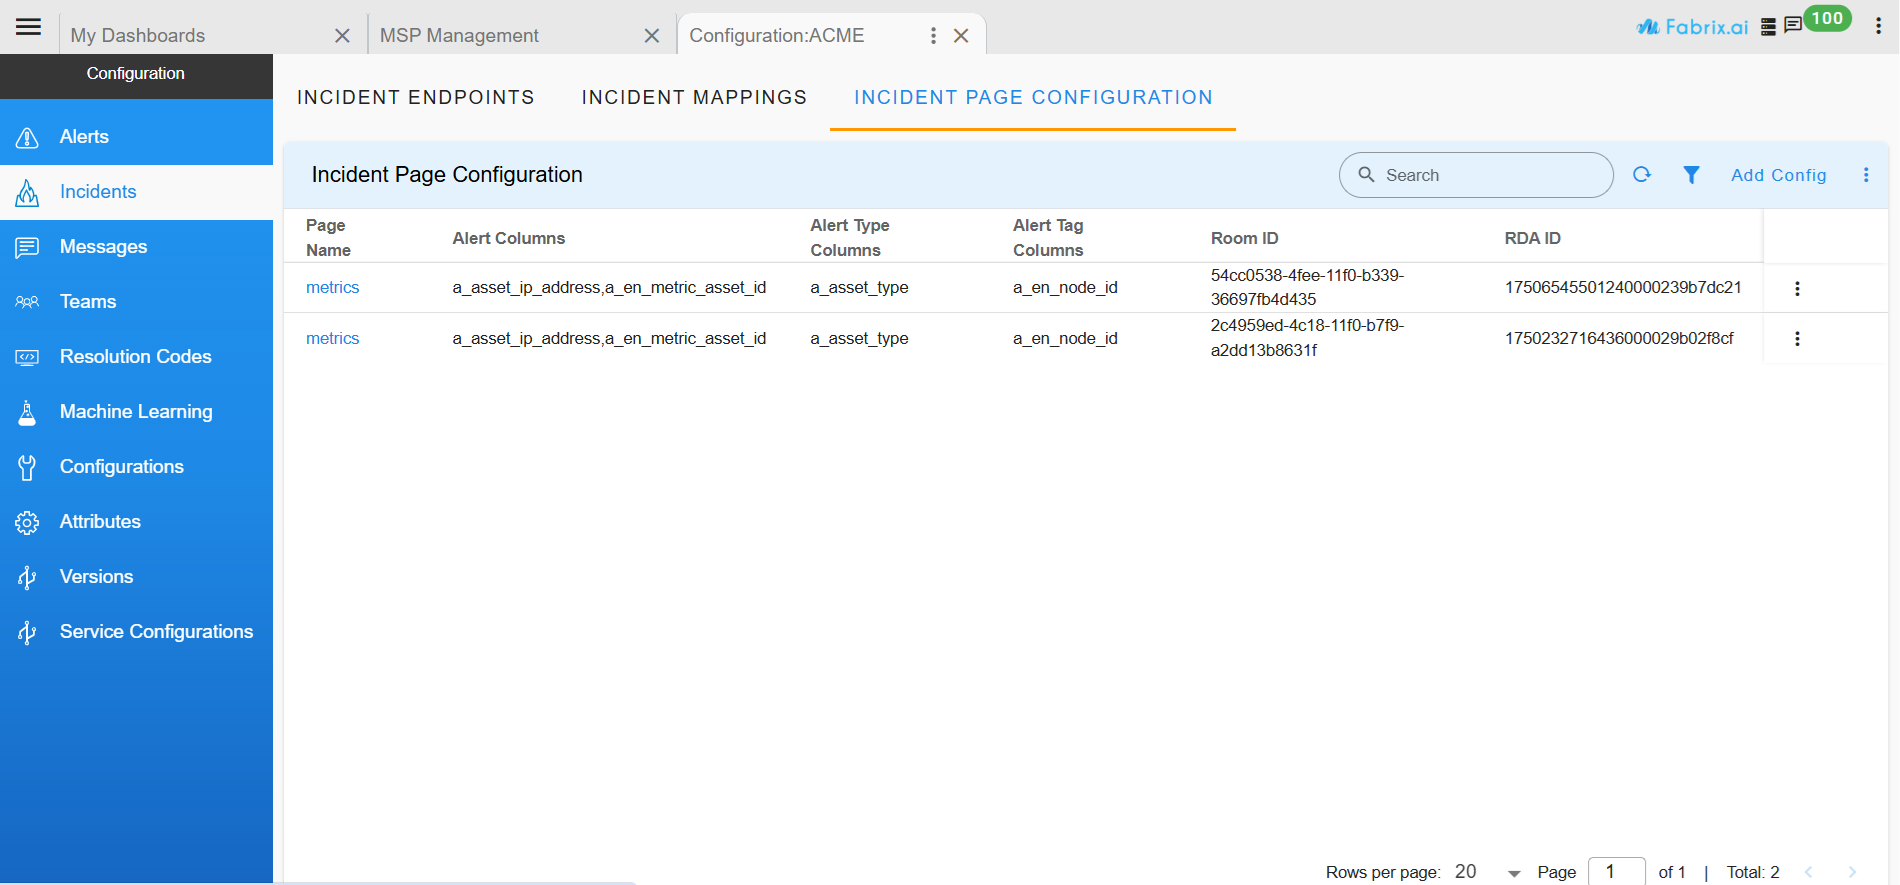
This is the default configuration entry displayed for a new organization. From this page, users can open and edit the metrics configuration. For upgraded setups, the configuration will initially be empty, and users can create a new entry using the “Add Config” action located at the top-right corner. For any configuration that has already been added, an "Edit Config" option is available to modify the existing entry as needed.
Note
The page name must be set to "metrics" for the configuration to apply to the incident metrics page of the organization. Future releases will extend this capability to other incident pages, such as topology, allowing similar configuration through this interface.
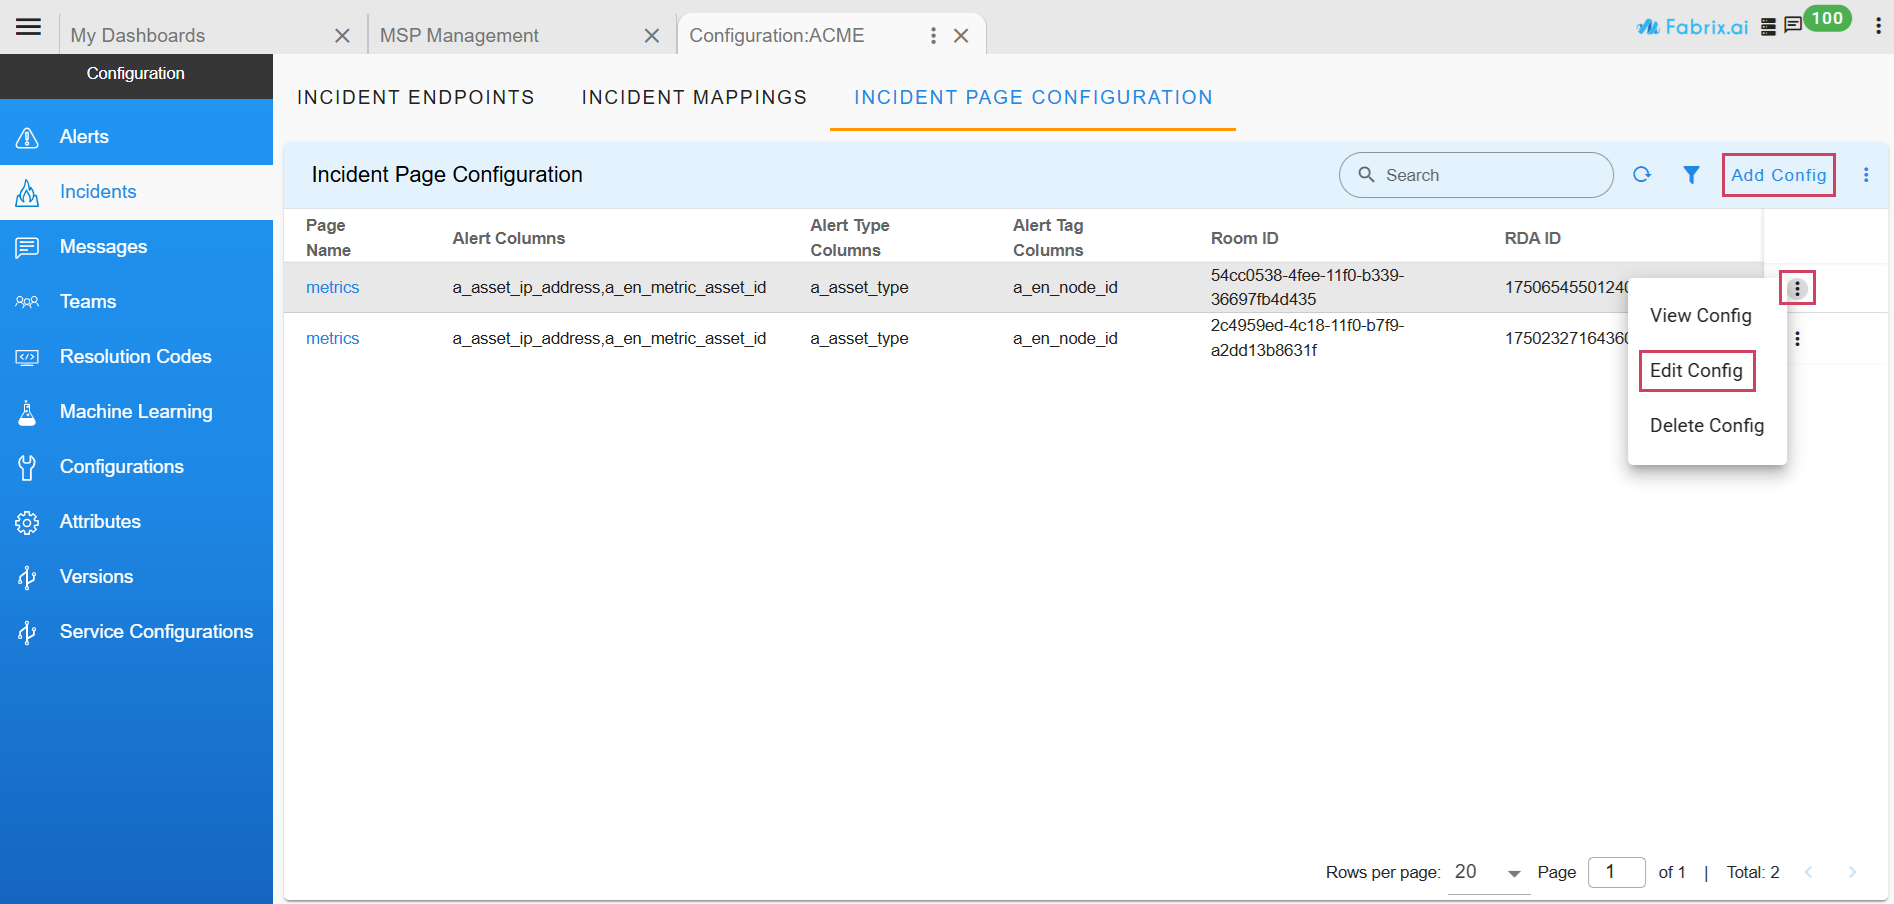
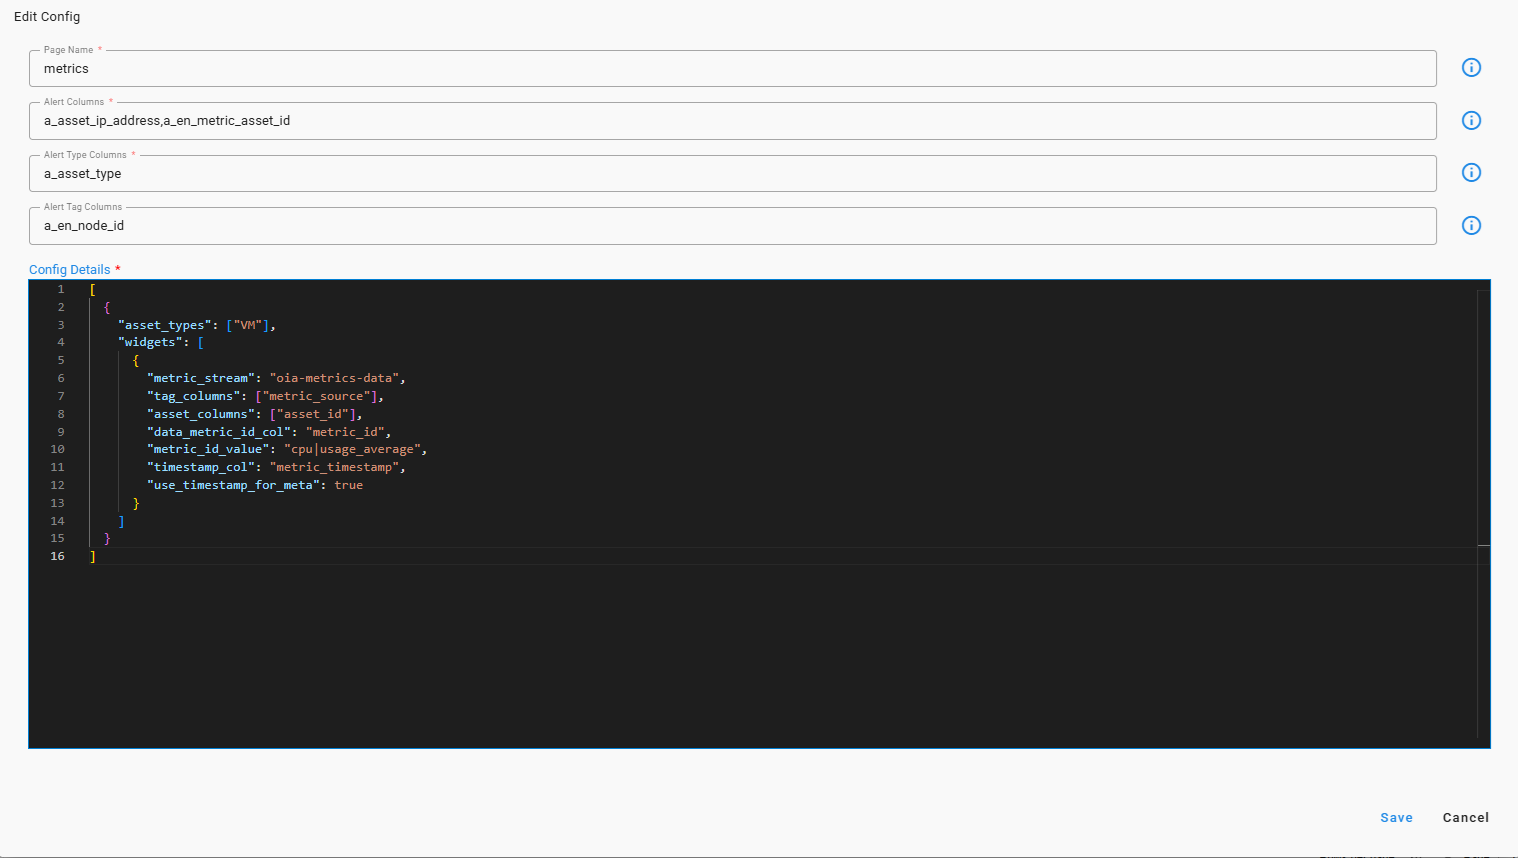
Below is a detailed breakdown of each field and its corresponding JSON configuration.
Parameter Name |
Mandatory | Description |
|---|---|---|
| Page Name | Yes | This is a unique value for the organization that indicates which page of the incident details application is being configured. Currently, only the value "metrics" is supported. Other values are ignored without causing harm. |
| Alert Columns | Yes | Comma-separated string containing column names from the alerts pstream. Typically includes important fields like IP address or asset identifier, which are used to map to target key columns in the metrics pstream. |
| Alert Type Columns | Yes | Comma-separated string containing column names from the alerts pstream representing the type of asset that triggered the alert. |
| Alert Tag Columns | No | Comma-separated string of column names from the alerts pstream. Optionaln-empty values from these columns are displayed as chip filters in the metrics widget. |
| Config Details | Yes | Fixed-format JSON list defining widgets for the metrics page, supports asset-wise and row/column-based metrics formats. Each entry includes: 1. asset_types: List of one or more fixed string values of asset types which match values in “Alert Type Columns” of the alert(s). 2. widgets: List of JSON dictionary configurations, where each entry defines one time-series widget. a. metric_meta_stream (Yes): Name of the pstream containing metadata for metrics. If metadata and data are same, use metrics_stream.b. metric_data_stream (Optional): Needed only when metadata and data are in different pstreams. Otherwise, same as metric_meta_stream.c. meta_tag_columns / tag_columns (Optional): List of column names in metadata stream to be shown as chip filters in the widget. d. meta_asset_columns (Optional): Column names from metadata stream to match values from Alert Columns. If same stream, use asset_columns.e. data_asset_columns (Optional): Column names from data stream to match Alert Columns. Falls back to meta_asset_columns if not provided.f. meta_metric_id_col / metric_id_col (Optional): Column name in metadata stream with unique metric ID. Defaults to metric_id.g. meta_metric_id_value / metric_id_value (Yes): Fixed value matched against column from meta_metric_id_col.h. data_metric_id_col (Optional): Column name in data stream with unique metric ID. Used if metadata and data pstreams differ. i. data_metric_value_col / metric_value_col (Optional): Column name containing actual metric values. Defaults to value. In column-wise pstream, this is the metric name.j. meta_metric_label_col / metric_label_col (Optional): Column for metric title. Defaults to metric_label. Falls back to meta_metric_id_value if missing.k. meta_unit_col / unit_col (Optional): Y-axis label in widget. Defaults to unit. Falls back to “value” if missing.l. use_timestamp_for_meta (Optional): Boolean. Default is False. Whether to apply timestamp filter on metadata query.m. meta_timestamp_col / timestamp_col (Optional): Column for timestamp info in metadata. Default is timestamp. Used only if use_timestamp_for_meta is True.n. data_timestamp_col (Optional): Column for timestamp info in data stream. Defaults to meta_timestamp_col.o. meta_query_extra_filter (Optional): Additional CFXQL filter for metadata query. p. data_query_extra_filter (Optional): Additional CFXQL filter for data query. |
pagename: metrics
alert_columns: a_asset_ip_address,a_en_metric_asset_id
alert_tag_columns: a_en_node_id
alert_type_columns: a_asset_type
widgets_config_json:
[
    {
        "asset_types":
        [
            "VM", "infra-account"
        ],
        "data_format": "row-wise",
        "widgets":
        [
            {
                "metric_meta_stream": "oia-metrics-data",
                "metric_data_stream": "oia-metrics-data",
                "meta_tag_columns": ["metric_source"],
                "meta_asset_columns":
                [
                    "asset_id"
                ],
                "data_asset_columns":
                [
                    "asset_id"
                ],
                "meta_metric_id_col": "metric_id",
                "data_metric_id_col": "metric_id",
                "meta_metric_id_value": "node_cpu_seconds_total",
                "meta_metric_label_col": "metric_label",
                "data_metric_value_col": "value",
                "meta_unit_col": "unit",
                "meta_timestamp_col": "metric_timestamp",
                "use_timestamp_for_meta": true,
                "data_timestamp_col": "metric_timestamp",
                "meta_query_extra_filter": null,
                "data_query_extra_filter": null
            },
            {
                "metric_stream": "oia-metrics-data",
                "tag_columns": ["metric_source"],
                "asset_columns":
                [
                    "asset_id"
                ],
                "data_metric_id_col": "metric_id",
                "metric_id_value": "cpu|usage_average",
                "timestamp_col": "metric_timestamp",
                "use_timestamp_for_meta": true
            }
        ]
    }
]
pagename: metrics
alert_columns: a_asset_ip_address
alert_type_columns: a_en_node_type
widgets_config_json:
[
    {
        "asset_types":
        [
            "CHASSIS"
        ],
        "data_format": "column-wise",
        "widgets":
        [
            {
                "metric_meta_stream": "rdaf_network_device_snmp_metrics",
                "metric_data_stream": "rdaf_network_device_snmp_metrics",
                "meta_tag_columns": ["i_source", "i_host", "i_agent_host", "i_device_model"],
                "meta_asset_columns":
                [
                    "i_agent_host"
                ],
                "data_asset_columns":
                [
                    "i_agent_host"
                ],
                "meta_metric_id_col": "i_metric_name",
                "meta_metric_id_value" : "memory_usage",
                "data_metric_value_col": "m_memory_usage",
                "meta_metric_label_col": "metric_label",
                "meta_unit_col": "unit",
                "meta_timestamp_col": "timestamp",
                "data_timestamp_col": "timestamp",
                "meta_query_extra_filter": null,
                "data_query_extra_filter": null,
                "use_timestamp_for_meta": false
            },
            {
                "metric_stream": "rdaf_network_device_snmp_metrics",
                "asset_columns":
                [
                    "i_agent_host"
                ],
                "metric_id_col": "i_metric_name",
                "metric_id_value" : "cpu_usage",
                "metric_value_col": "m_cpu_usage"
            }
        ]
    }
]
17. OIA Incident Topology Setup Guide(Version 8.2 Onwards)
17.1 Requirements
-
Before 8.2, the incident topology page was hard to configure because key fields were scattered across the dashboard definition. It needs to be flexible and field-configurable so users can choose the stack to display, enable or disable alert badging, and select which pstream fields are used for alert badging.
-
Changes made in the dashboard to tune pstreams, columns, topology, or alert badging were being overwritten by subsequent pack upgrades; customizations to the topology stack, alert badging, and alert-data mappings must persist across releases.
-
It should be easily understandable and configurable for the incident topology page.
17.2 Implemented Solution
-
We moved the configuration that controls which stack and alert badging to display for incidents into the oia-incident-page-config pstream and exposed it in the UI for easy viewing and editing. The default incident details topology dashboard uses this configuration via a Jinja-based widget generator. See the rest of this document for details. All widgets on this page use a default time window relative to the incident occurrence time (‑30 minutes to +30 minutes).
-
For new organizations, a default entry will be created for the incident topology page; customize it based on available alert and topology data.
17.3 Location of the configuration in UI
-
UI Navigation Path : Home (Left Side Menu) -> Administration -> Organizations -> Configure (card level action)
-
This opens a new tab for organization settings. In that tab, navigate via the left menu: Incidents → Incident Page Configuration as shown in the below screenshot
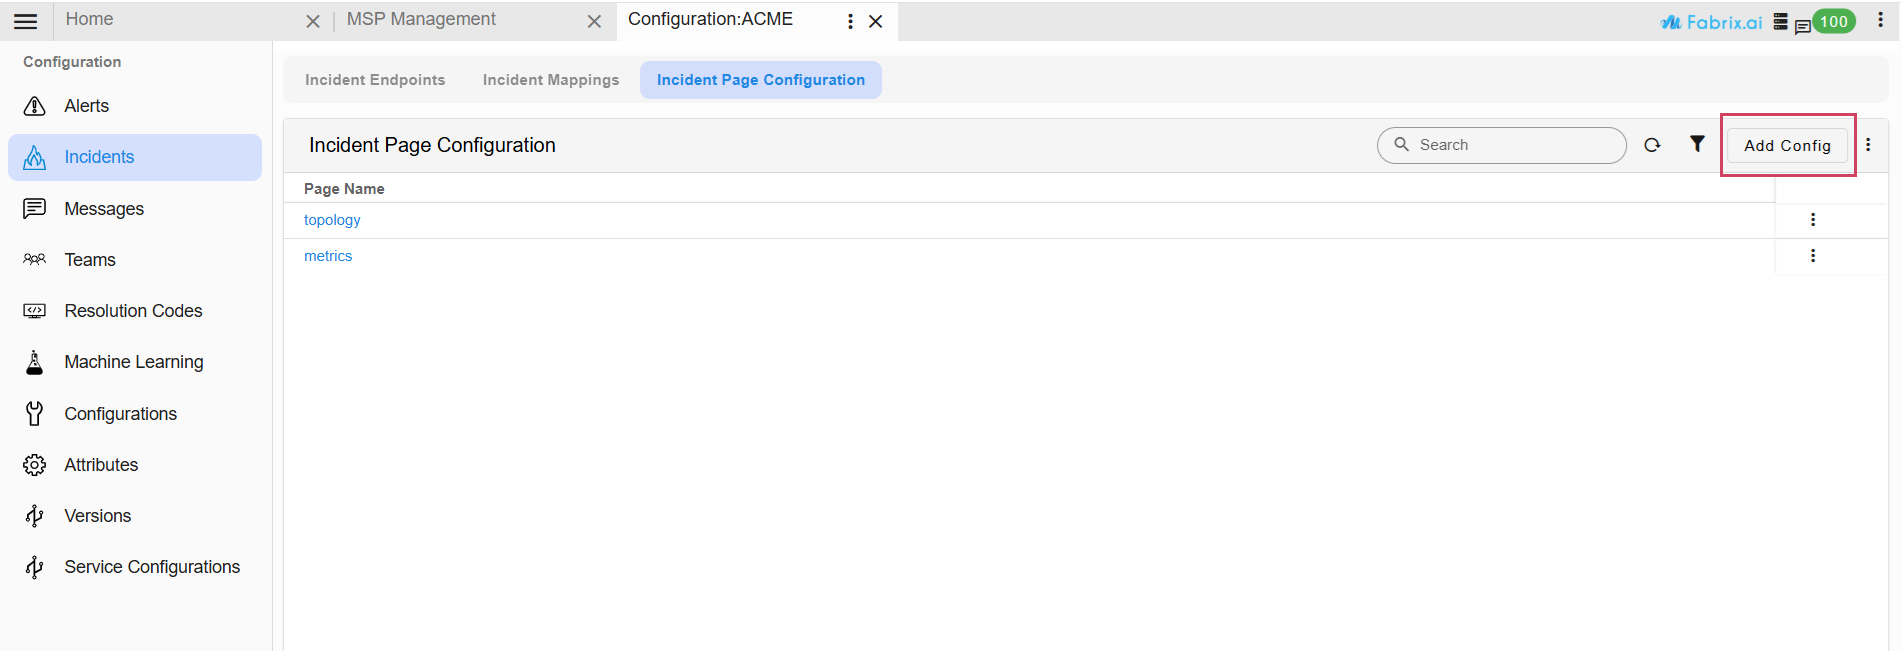
- The default entry for a new organization appears as shown in the above Screenshot. From this page users can open and edit the topology configuration. For upgraded environments, existing organizations will see only a metrics entry by default; to add the incident topology configuration, click Add Config at the top-right of the page.
Note
The configuration must be named "topology" for it to apply to the incident topology page for that organization. Future releases will extend this approach to allow other incident pages to be configured similarly.
- For Editing/Adding config, a pop up form opens which looks like this
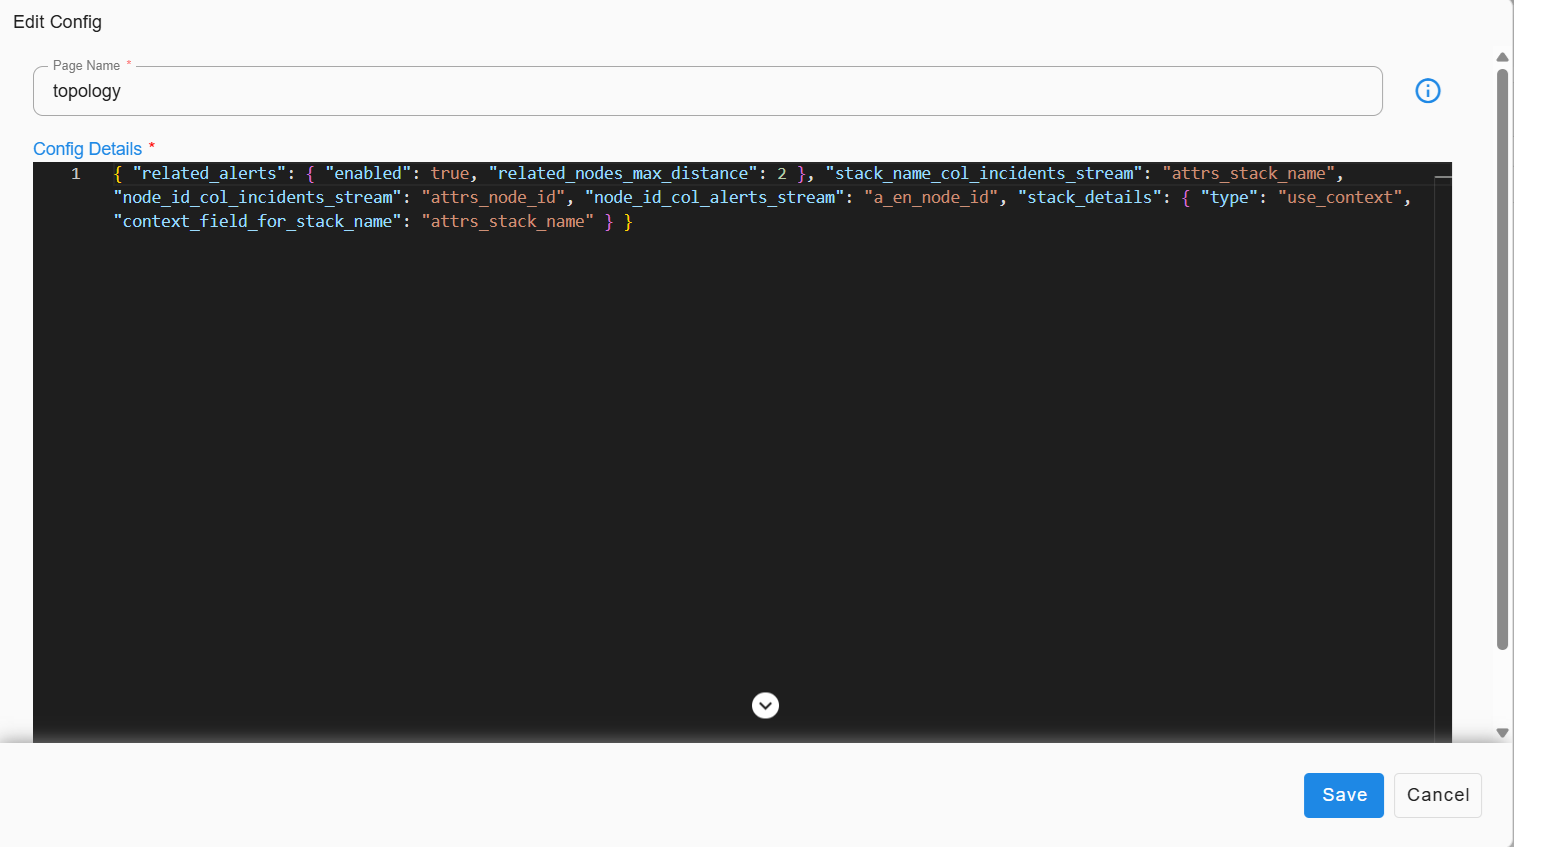
- Below is a detailed breakdown of each field and the JSON configuration
Parameter Name |
Mandatory | Description |
|---|---|---|
Page Name |
yes | Unique value for the organization that determines which incident-details page is configured. Supported values: metrics, topology. as the value for this field. Any other value provided for this field will not have any effect though it would not interfere or harm also. |
config Details |
yes | Fixed-format JSON list specific to each page type. For topology, the JSON includes: a) related_alerts Configure custom labels and alert badging:i. enabled (MANDATORY, boolean): enable/disable the custom labels using related alerts.ii. related_nodes_max_distance (optional, integer): The number signifies number of hops to be included when considering the related alerts of the node. Its default value is 2.b) stack_name_col_incidents_stream (MANDATORY, string): Signifies the column name in incidents pstream which has stack name value to be used for incident topology page.c) node_id_col_incidents_stream (MANDATORY, string): column in incidents pstream containing the node id for the impacted asset.d) node_id_col_alerts_stream (MANDATORY, string): Specifies the column name in the incidents pstream that contains the node ID of the topology node which is the primary impacted asset for this incident.e) stack_details — Contains nested details specifying which stack to display on the incident topology page and its configuration:i. type Defines the stack location to use. Valid values are "use_context", "fixed", and "dynamic". The required additional fields vary by value. Detailed examples follow, and all applicable fields are described below for reference.ii. context_field_for_stack_name Applicable only when type="use_context". Specifies the attribute name in the incoming UI context (on page load) that contains the stack name.iii. stack_name This is applicable only if type=”fixed”. This field defines the name of the stack and that is a pre-defined stack in the list of stacks in the app.iv. stack_definition This is applicable only if type=”dynamic”. Under this field the complete stack is defined.The details of the stack definition fields is out of scope of this section. Look at the example provided below for suggestions. |
17.4 Overall configurations Examples
pagename: topology
{
    "related_alerts":
    {
        "enabled": "true/false",
        "related_nodes_max_distance": 2
    },
    "node_id_col_incidents_stream": "attrs_node_id",
    "node_id_col_alerts_stream": "a_en_node_id",
    "stack_details":
    {
        "type": "use_context",
        "context_field_for_stack_name": "attrs_stack_name"
    }
}
pagename: topology
{
    "related_alerts":
    {
        "enabled": "true/false",
        "related_nodes_max_distance": 2
    },
    "node_id_col_incidents_stream": "attrs_node_id",
    "node_id_col_alerts_stream": "a_en_node_id",
    "stack_details":
    {
        "type": "fixed",
        "stack_name": "vcenter_stack"
    }
}
pagename: topology
{
    "related_alerts":
    {
        "enabled": "true/false",
        "related_nodes_max_distance": 2
    },
    "node_id_col_incidents_stream": "attrs_node_id",
    "node_id_col_alerts_stream": "a_en_node_id",
    "stack_details":
    {
        "type": "dynamic",
        "stack_definition":
        {
            "name": "Telco Stack",
            "description": "",
            "saved_time": "2023-09-12T21:08:31.418255",
            "is_dynamic": true,
            "hierarchical": true,
            "dynamic_nodes":
            {
                "stream": "graphdb://cfx_rdaf_topology/cfx_rdaf_topology_nodes",
                "query": "collection_timestamp is after -30d"
            },
            "dynamic_relationships":
            {
                "stream": "graphdb://cfx_rdaf_topology/cfx_rdaf_topology_edges",
                "graph_name": "cfx_rdaf_topology_graph",
                "query": "collection_timestamp is after -30d",
                "relation_map": "rdaf_topology_relationships"
            },
            "views":
            [
                {
                    "viewId": "DefaultView",
                    "label": "Default View",
                    "fillna_rules":
                    [],
                    "grouping_rules":
                    []
                },
                {
                    "label": "View1",
                    "viewId": "view1",
                    "fillna_rules":
                    [],
                    "grouping_rules":
                    [
                        {
                            "query": "node_type in [\"VM\",  \"Hypervisor\", \"vCenter\",  \"vSphere_Cluster\"]",
                            "node_action": "include"
                        }
                    ]
                },
                {
                    "label": "View2",
                    "viewId": "view2",
                    "fillna_rules":
                    [],
                    "grouping_rules":
                    [
                        {
                            "query": "node_type is 'Hypervisor'",
                            "node_action": "exclude"
                        }
                    ]
                }
            ]
        }
    }
}
18. OIA Incident Logs Setup Guide(Version 8.2.1 Onwards)
Note
This guide applies to OIA deployments starting from version 8.2.1 and above.
18.2.1 Requirements
-
A new page "Incident Logs" is added in this release which supports flexibility and retaining any dashboard customizations—such as modifying or adding widgets for incident logs across major or minor upgrades when updated dashboard bundles were deployed.
-
The goal is to provide a UI-configurable approach to define which logs to fetch, and what type of log widgets to display, ensuring customizations persist across upgrades without disruption.
18.2 Implemented Solution
-
The configuration that defines which logs to display for incidents has been externalized to the
oia-incident-page-configpstream. This configuration is now accessible via the UI, enabling easier reference and editing. It is consumed by a JINJA-based widget generator used in the default Incident Details Logs Page dashboard (incident-details-logs.json). -
Further details about the configuration format and usage are provided in the subsequent sections of this document.
-
Each log widget, by default, uses a time window relative to the incident occurrence time: from -12 hours to +4 hours.
-
The generator relies on retrieving alerts related to the incident and mapping their asset types and IDs to the corresponding log streams.
-
For existing organizations upgrading to 8.2.1, users are required to manually add the configuration for the incident logs page.
18.3 Location of the Configuration in UI
-
To access the page configuration, navigate from the left-side menu Administration → Organizations → Configure (via the card-level action).
-
This opens a new tab with various organization-level configurations. In that tab, go to Incidents → Incident Page Configuration (3rd tab in the page).
-
This is the default configuration entry displayed for a new organization. From this page, users can open and edit the logs configuration. For upgraded setups, the configuration will initially be empty, and users can create a new entry using the “Add Config” action located at the top-right corner. For any configuration that has already been added, an "Edit Config" option is available to modify the existing entry as needed.
Note
The page name must be set to "logs" for the configuration to apply to the incident logs page of the organization.
18.4 Configuration Details Breakdown
- Below is a detailed breakdown of each field and its corresponding JSON configuration.
| Parameter Name | Mandatory | Description |
|---|---|---|
| Page Name | Yes | A unique value that determines which incident details page is configured for the organization. Supported values are: metrics, topology, and logs. Any other value provided for this field will be ignored. Although unsupported values do not affect functionality, they are not used by the system. |
| Alert Columns | Yes | A comma-separated list of column names from the oia-alerts-stream. These columns are used to extract asset IDs, which are then matched against the configured log streams. |
| Alert Type Columns | Yes | A comma-separated list of column names from the oia-alerts-stream that represent the type of asset that triggered the alert. |
| Alert Tag Columns | No | A comma-separated list of column names from the oia-alerts-stream. Non-empty values from these columns are displayed as filter chips in the log widgets. |
| Config Details | Yes | A fixed-format JSON array (widgets_config_json) that defines the widgets displayed on the Logs page.Each entry contains the following properties: 1. asset_types: A list of asset type values that correspond to the values specified in Alert Type Columns. Use ["*"] to match all asset types.2. widgets: A list of widget configuration objects. Each object defines a single log widget (Timeseries, Tabular, or Pie Chart). Common Widget Parameters: a. widget_type (Required): Must be one of "timeseries", "tabular", or "pie_chart".b. logs_stream (Required): The name of the pstream containing log data. c. asset_columns (Required): A list of column names in the log stream used to match the asset IDs extracted from alerts. d. timestamp_col (Optional): The column containing timestamp information in the log stream. Defaults to timestamp if not specified.e. extra_filter (Optional): An additional CFXQL filter applied to the log query. Timeseries Widget (Logs Trend) Parameters: f. grouping_columns (Optional): A list of columns used to group time-series data. The widget plots event occurrences over time in 1H intervals and automatically calculates value_count.Tabular Widget (Logs Table) Parameters: g. output_columns (Required): A key-value mapping that defines the columns displayed in the table. The key represents the log stream column name. The value can be either a string (column title) or a dictionary containing additional metadata, such as {"title": "Timestamp", "type": "DATETIME"}.Pie Chart Widget Parameters: h. widget_title_prefix (Required): The prefix used to generate the pie chart title (for example, "Logs Severity"). i. grouping_column (Required): The column used to group the pie chart segments. j. grouping_func (Required): The aggregation function used to calculate the pie chart values (for example, "value_count"). |
pagename: logs
{
    "alert_columns": "a_asset_ip_address,a_en_metric_asset_id",
    "alert_tag_columns": "a_en_metric_asset_id,a_asset_type",
    "alert_type_columns": "a_asset_type",
    "widgets_config_json":
    [
        {
            "asset_types":
            [
                "VM",
                "infra-account"
            ],
            "widgets":
            [
                {
                  "widget_type": "timeseries",
                  "logs_stream": "syslog_udp_events_stream",
                  "asset_columns":
                  [
                      "rda_gw_client_ip"
                  ],
                  "grouping_columns": [
                    "syslog_severity"
                  ],
                  "timestamp_col": "rda_gw_timestamp"
                },
                {
                  "widget_type": "tabular",
                  "logs_stream": "syslog_udp_events_stream",
                  "asset_columns":
                  [
                      "rda_gw_client_ip"
                  ],
                  "timestamp_col": "rda_gw_timestamp",
                  "output_columns":{
                    "rda_gw_client_ip": "IP Address",
                    "Message": "Message",
                    "syslog_severity": "Severity",
                    "site_code": "Site",
                    "syslog_facility": "Facility",
                    "rda_gw_timestamp": {
                      "title": "Timestamp",
                      "type": "DATETIME"
                    }
                  }
                },
                {
                  "widget_type": "pie_chart",
                  "widget_title_prefix": "Logs Severity",
                  "logs_stream": "syslog_udp_events_stream",
                  "asset_columns":
                  [
                      "rda_gw_client_ip"
                  ],
                  "timestamp_col": "rda_gw_timestamp",
                  "grouping_column": "syslog_severity",
                  "grouping_func": "value_count"
                }
            ]
        }
    ]
}