Topology Widget
1. Topology Widget Definition
New configuration options are now available for the Topology Widget, allowing users to enable both the Assets Panel and the Topology Control Panel within the Dashboard.
2. Configuration Options
2.1 Configuration for Control Panel (Nodes/Edges Tables)
Data origins for nodes and relationships are defined by stack definitions, and their presentation within the Asset and Topology Control Panels is configured through nodes_asset_report, nodes_report, and edges_report.
 {
  "inMultiviewContainer": true,
  "title": "Topology View",
  "widget_type": "topology",
  "with_graphdb":true,
  "register_search_endpoints": true,
  "empty_stack_start": true,
  "reportId": "rda.saas.stack.view.topo",
  "stack_type": "dynamic",
  "legendHtml": "attachment://legendHTML",
  "limit_to_node_types": [
    "Hypervisor",
    "vSwitch"
  ],
  "stack_definition": {
    "name": "Telco Stack",
    "description": "",
    "saved_time": "2023-09-12T21:08:31.418255",
    "is_dynamic": true,
    "hierarchical": true,
    "dynamic_nodes": {
      "stream": "graphdb://cfx_rdaf_topology/cfx_rdaf_topology_nodes",
      "query": "collection_timestamp is after -30d"
    },
    "dynamic_relationships": {
      "stream": "graphdb://cfx_rdaf_topology/cfx_rdaf_topology_edges",
      "graph_name": "cfx_rdaf_topology_graph",
      "query": "collection_timestamp is after -30d",
      "relation_map": "rdaf_topology_relationships"
    },
    "views": [
      {
        "viewId": "DefaultView",
        "label": "Default View",
        "fillna_rules": [],
        "grouping_rules": []
      },
      {
        "label": "View1",
        "viewId": "view1",
        "fillna_rules": [],
        "grouping_rules": [
          {
            "query": "node_type in [\"VM\",  \"Hypervisor\", \"vCenter\",  \"vSphere_Cluster\"]",
            "node_action": "include"
          }
        ]
      },
      {
        "label": "View2",
        "viewId": "view2",
        "fillna_rules": [],
        "grouping_rules": [
          {
            "query": "node_type is 'Hypervisor'",
            "node_action": "exclude"
          }
        ]
      }
    ]
  },
  "nodes_report": {
    "reportMetaData": {
      "sorting": true,
      "filtering": true,
      "title": "Nodes",
      "remote_searchable": false,
      "rowInfoPopup": {
        "showRowSummary": true
      },
      "remote_searchable_cols": [
        "name",
        "node_label",
        "node_id",
        "node_type"
      ],
      "actions": [
        {
          "permission": "rda:user_dashboard:view",
          "appName": "user-dashboard/topology-workbench",
          "drillDownLinkField": "node_label",
          "identifier": "launch.dashboard.topology-workbench",
          "selectionType": "SINGLE",
          "title": "Path Visualization",
          "contextParamList": {
            "contextParams": [
              {
                "paramKey": "node_id",
                "paramId": "node_id"
              }
            ]
          },
          "type": "GO_TO_APP_STATE"
        }
      ],
      "reportColumnDefinitionList": [
        {
          "identifier": "node_label",
          "title": "Name",
          "key": false
        },
        {
          "identifier": "layer",
          "key": false,
          "title": "Layer"
        },
        {
          "identifier": "node_type",
          "key": false,
          "title": "node_type"
        },
        {
          "identifier": "node_id",
          "key": true,
          "hidden": true
        }
      ]
    }
  },
  "nodes_asset_report": {
    "dashboardId": "Node Details",
    "reportId": "dynamic_v2_tabular_report_0_1",
    "ignore_context_filter": true
  },
  "edges_report": {
    "reportId": "rda.saas.topology.edges.report",
    "reportMetaData": {
      "sorting": true,
      "filtering": true,
      "title": "Edges",
      "reportColumnDefinitionList": [
        {
          "hidden": false,
          "id": "left_id",
          "identifier": "left_id",
          "key": true,
          "title": "Left Id",
          "type": "TEXT",
          "visible": false
        },
        {
          "hidden": false,
          "id": "left_label",
          "identifier": "left_label",
          "key": false,
          "title": "Source",
          "type": "TEXT",
          "visible": true
        },
        {
          "hidden": false,
          "id": "right_id",
          "identifier": "right_id",
          "key": true,
          "title": "Right Id",
          "type": "TEXT",
          "visible": false
        },
        {
          "hidden": false,
          "id": "right_label",
          "identifier": "right_label",
          "key": false,
          "title": "Destination",
          "type": "TEXT",
          "visible": true
        },
        {
          "hidden": false,
          "id": "relation_type",
          "identifier": "relation_type",
          "key": false,
          "title": "Relation",
          "type": "TEXT",
          "visible": true
        }
      ],
      "actions": []
    }
  },
  "height": 12,
  "min_wdith": 12,
  "widget_id": "182287d8"
}
Important attributes from above widget definition
Stack Type:
The Stack Type can either be "static" or "dynamic". By default, the value is set to "static". If the stack type is not specified or is set to "static", users can provide the name of a predefined stack using the "stack" attribute.
If the stack type is defined as "dynamic", users are required to include a stack_definition within the widget definition.
Stack Definition: The stack_definition is used to define a dynamic stack. Within this definition, users can specify the data source for the stack. Data can be sourced from a pstream or a graphdb collection. The "stream" attribute can either point to a pstream name or a graphdb collection name. If the stream name begins with "graphdb://", it indicates that the data is being retrieved from graphdb. This data will appear on the left side of the Control Panel.
Dynamic Nodes: This attribute specifies where to read the node-related data for the topology.
Dynamic Relationships: This attribute defines where to read relationship/edge data for the topology. If the data source is graphdb, the user must also specify the graph_name and relation_map name.
Views: Views are always included within the stack_definition and allow users to display different views of the topology data. These views are presented on the control panel, as shown in the attached screenshot.
Empty Stack Start: When dealing with a large topology that includes numerous nodes and relationships, the initial load in the control panel can feel overcrowded. To mitigate this, the Empty_stack_start parameter can be set to True. When enabled, the topology will load as an empty view upon first display. Users can then go to the Assets Panel to add specific nodes to the current view or create a new view with selected nodes.
Limit to Node Types: This parameter allows users to control which nodes are displayed when the topology is first loaded in the Control Panel. By specifying node types, the backend will return only the nodes and relationships associated with the defined node types, reducing the initial clutter.
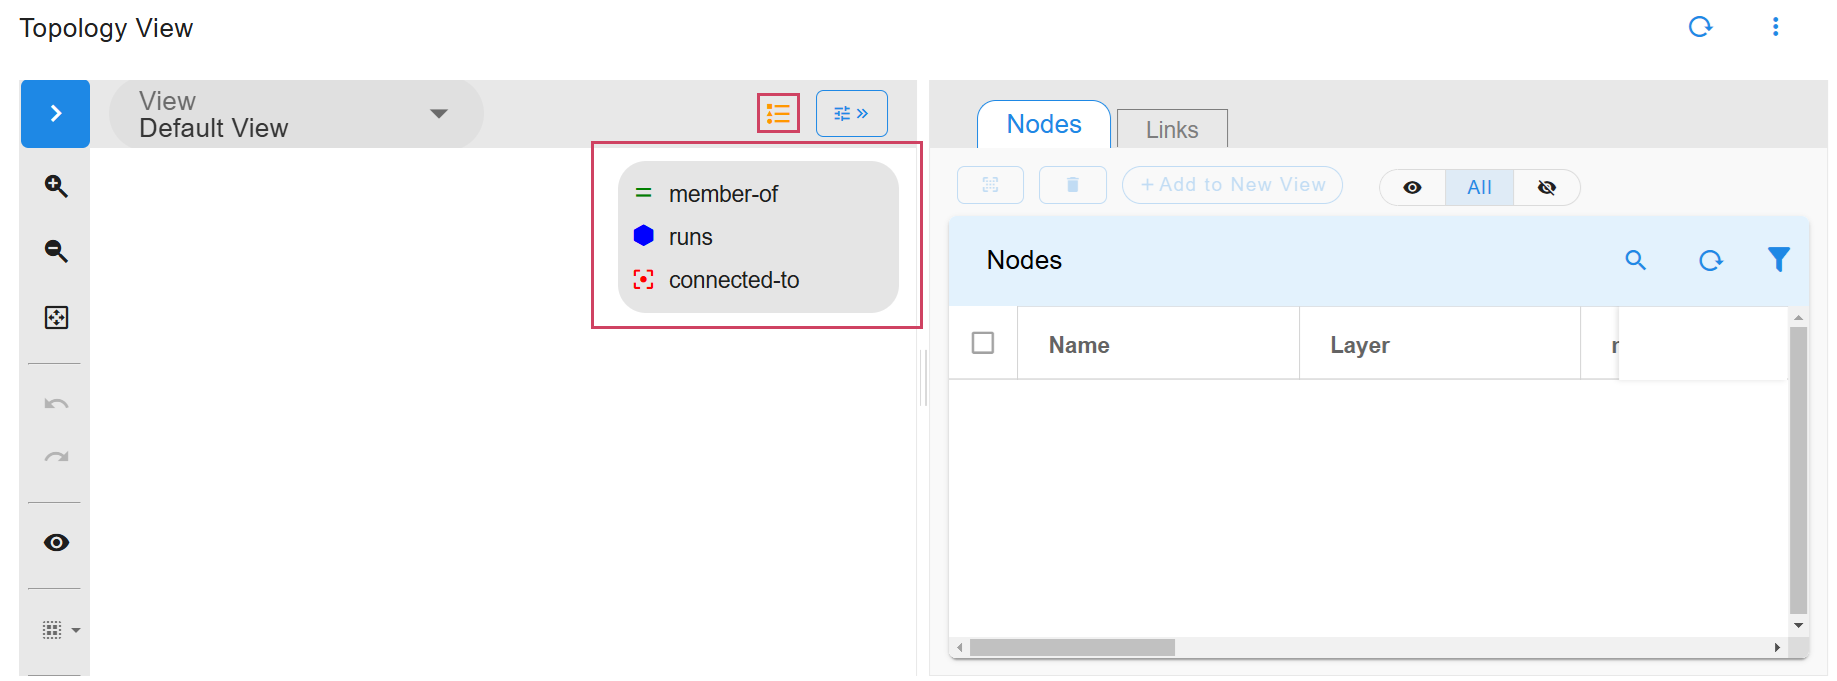
Legend HTML: The legendHtml attribute is used to define a custom legend for links within the topology. The HTML code for the legend can be attached to the dashboard, offering a visual reference. A sample screenshot of the legend can be found below.
Nodes Report: The Nodes_report attribute enables users to customize the columns displayed in the Nodes Report on the right side of the Control Panel. This report is presented in a tabular format, configured using the reportColumnDefinitionList, and can include actions. To change the report title from the default "Nodes," users can modify the "title" attribute within the reportMetaData.
Edges Report: The Edges_report attribute allows users to define the columns for the Links/Edges Report, which appears on the right side of the Control Panel. Like the Nodes Report, it is displayed as a tabular report through the reportColumnDefinitionList, with the option to add actions. To customize the title from the default "Links," users should adjust the "title" attribute in the reportMetaData.
Nodes Asset Report: The Nodes_asset_report attribute specifies the report to be shown in the Asset Panel. Defined as a tabular report within the same dashboard, the report is referenced by reportId. It is crucial to set "ignore_context_filter" to True. Additionally, ensure that "context_filter": "customerRole is 'admin'" is specified, to keep the report hidden under the Control Panel and only visible to the appropriate roles.
isInUIView: The isInUIView column in the Asset Panel indicates which nodes are currently part of the active topology view. Nodes included in the view are marked with a check mark in this column.
2.2 Configuration of Asset Panel
{
    "title": "Asset Details",
    "widget_type": "tabular",
    "stream": "graphdb://cfx_rdaf_topology/cfx_rdaf_topology_nodes",
    "height": 10,
    "min_wdith": 12,
    "widget_id": "56347327",
    "paginated": true,
    "duration_hours": 10000,
    "max_rows": 50,
    "ts_column": "timestamp",
    "remote_searchable": true,
    "virtual_scrolling": true,
    "visibility_on_error": false,
    "context_filter": "customerRole is 'admin'",
    "showRowSummary": true,
    "remote_searchable_cols": [
      "name",
      "node_label",
      "node_id"
    ],
    "custom_columns": [
      {
        "id": "isInUIView",
        "label": "In UI View",
        "expr": "str(_row.node_id) in {{IN_UI_VIEW_NODES}}",
        "hidden": true,
        "key": false,
        "visible": false,
        "sortable": false,
        "filterable": false
      }
    ],
    "columns": {
      "isInUIView": {
        "title": "In UI View",
        "key": false,
        "filterable": false,
        "type": "DYNAMIC_HTML",
        "htmlTemplate": "<div v-if='rowData.isInUIView'><v-icon icon>mdi-check</v-icon></div><div v-else> </div>"
      },
      "node_label": {
        "title": "Name",
        "key": true
      },
      "node_id": {
        "key": true,
        "hidden": true
      }
    },
    "actions": []
  }
3. Using Topology Panels
The Topology widget utilizes two interactive panels to enhance user experience: the Assets Panel and the Topology Control Panel.
3.1 Assets Panel
The Assets Panel offers a complete list of all node elements (assets) within the visualized topology, enabling users to easily find and select specific nodes for display in the topology view.
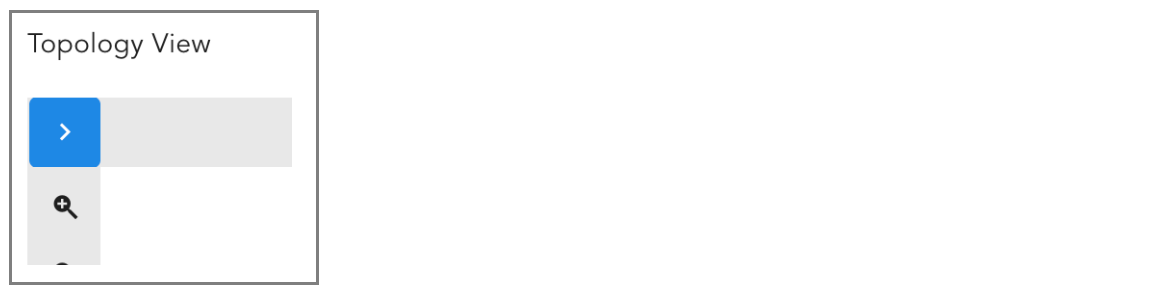
The blue button located in the top left corner of the Topology Widget opens the Asset Panel.
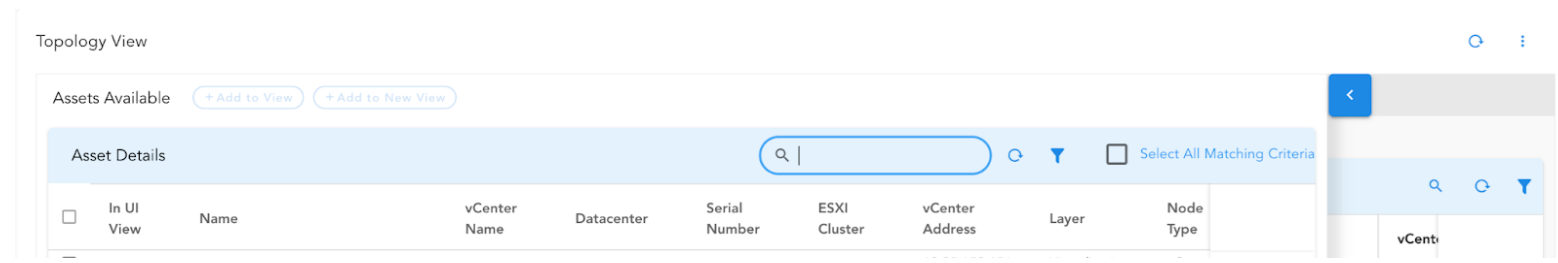
The panel that opens will display a comprehensive list of node components, or assets, available for selection.
-
Asset Selection: Click on a checkbox in front of the row within the table.
-
Asset Search: Use the search input box to quickly search by name or click the filter icon to refine your search results.
-
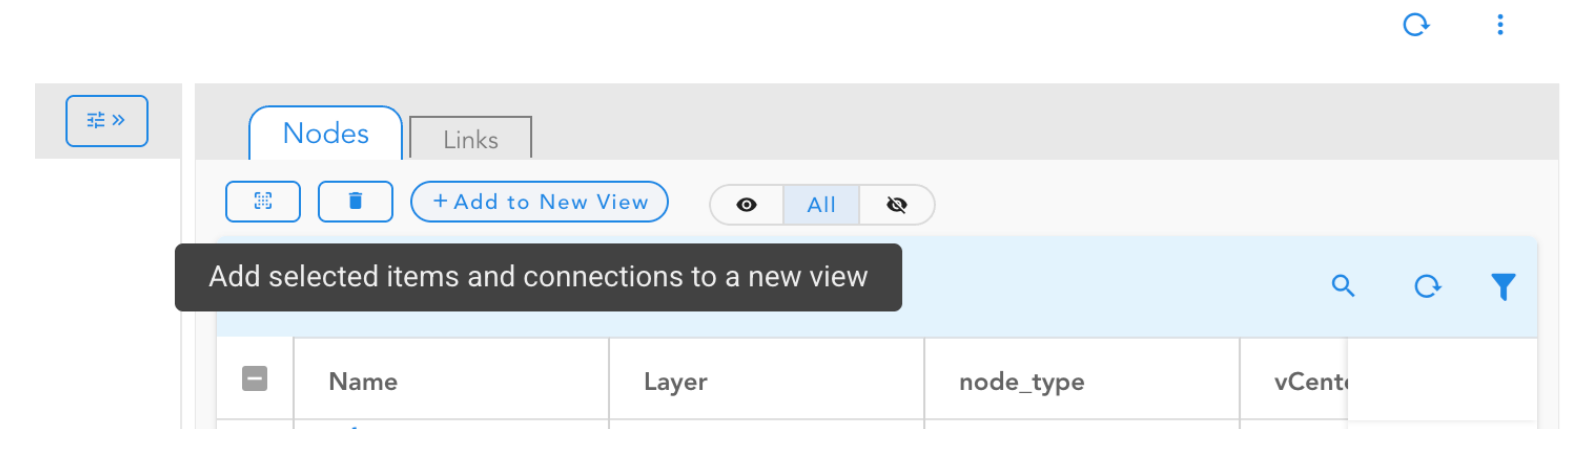
Add to View: This functionality enables users to integrate selected assets into the existing topology view. By adding specific assets, you can enrich the visualization, offering a more detailed and comprehensive understanding of the system's relationships and dependencies.
-
Add to New View: This feature enables users to create a new, pristine topology view populated with the selected assets, while keeping the current topology view intact and unchanged.
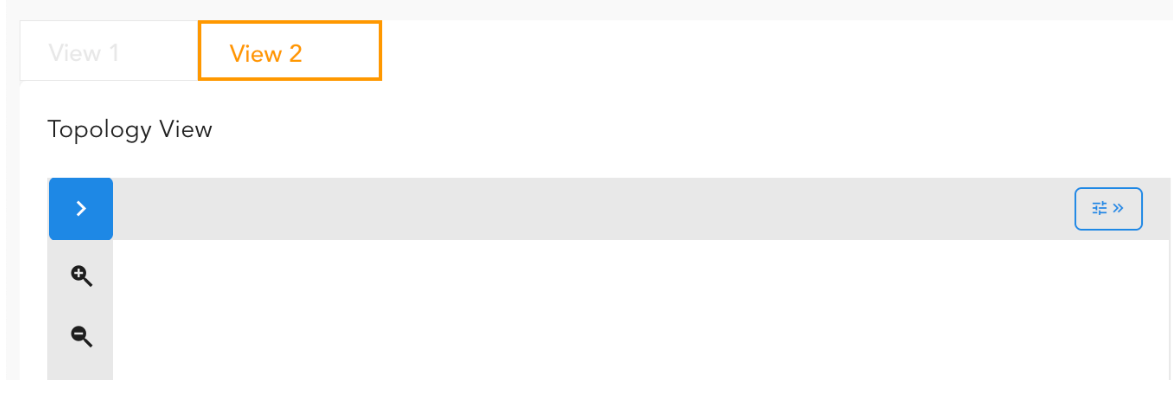
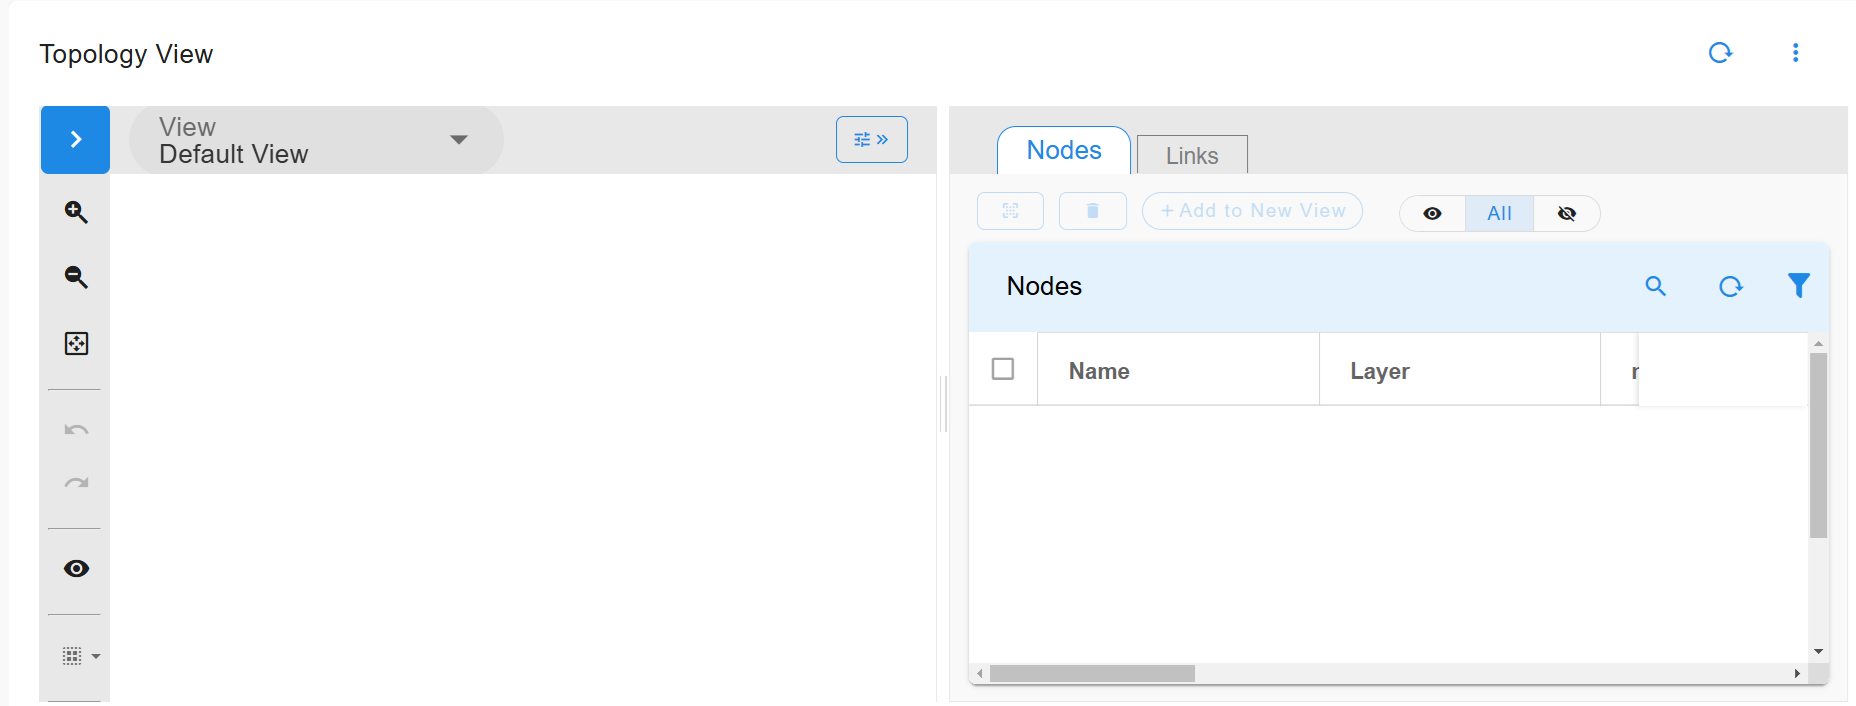
3.2 Topology Control Panel
The Topology Control Panel contains a range of tools and controls that allow users to interact with and manipulate the topology in multiple ways, providing flexibility and enhanced functionality.
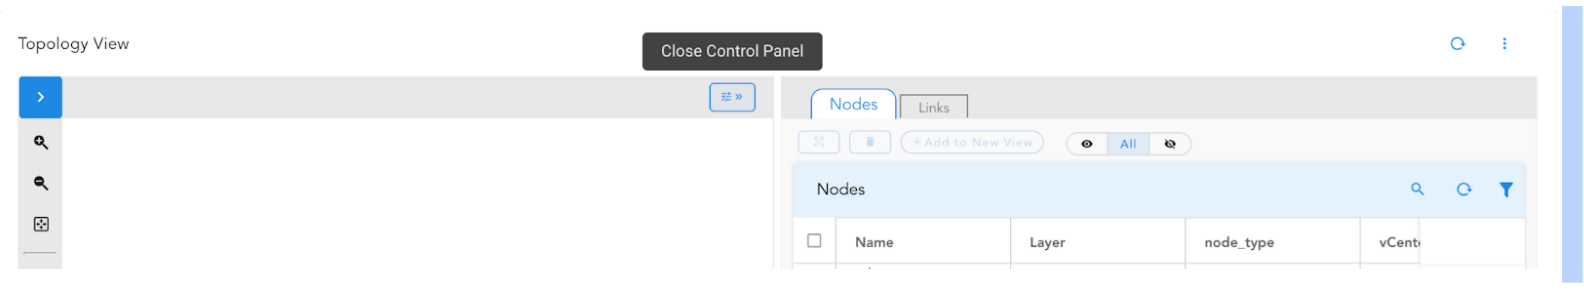
Users can collapse or reopen the Control Panel by clicking the button in the center of the toolbar. Additionally, the panel's size can be adjusted by dragging the handle on the center divider.
-
Elements: The Nodes/Links tables display detailed information about the node and link elements present in the Topology view. These tables are always synchronized with the current selection in the Control Panel, ensuring that the topology view dynamically updates to highlight only the relevant elements based on the user's selection.
-
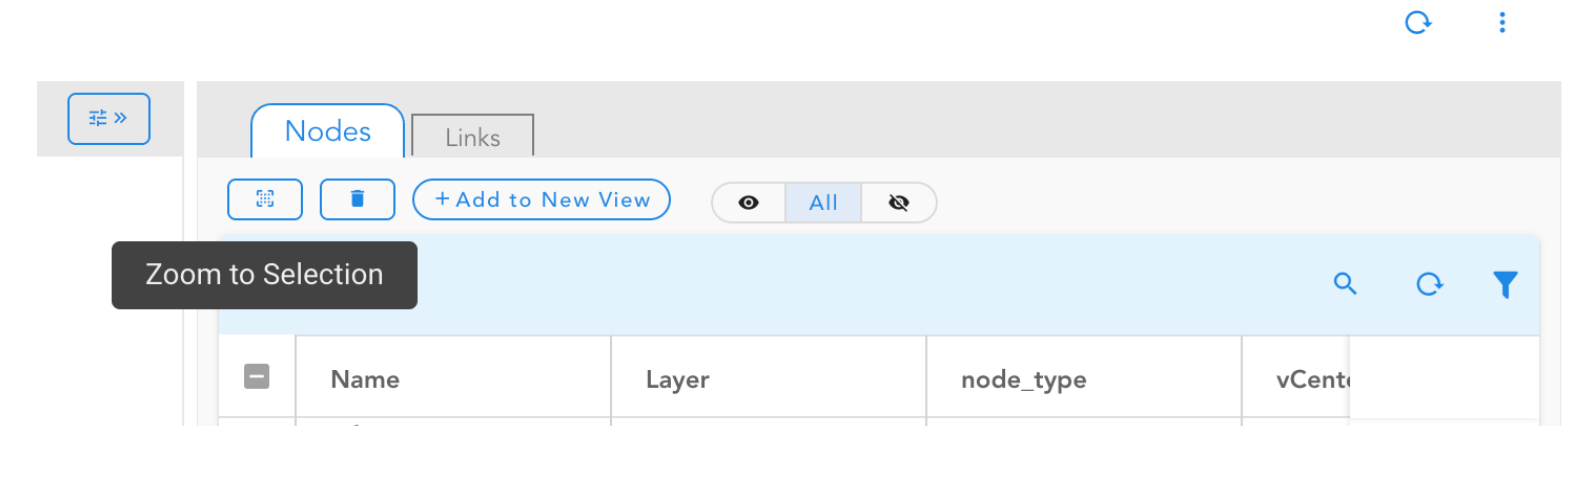
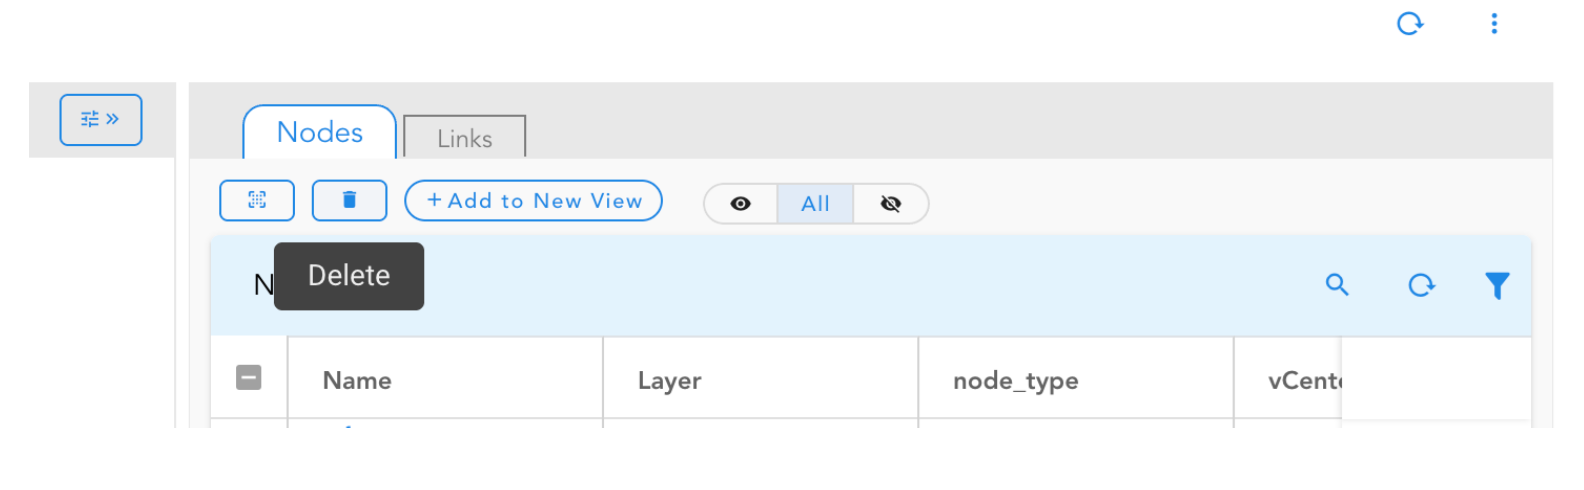
Action Tools: Actions can be applied to selections, including: Zoom to Selection, Delete, Add to New View (refer to "Add to New View" in the Assets Panel), and List User Hidden Nodes. These options allow for greater control and customization of the topology view.
-
Reflect Filtered Links in the Chart: When the Links table data is filtered by link type, the topology view can be updated to display the graph with only the filtered links, providing a focused and relevant visualization based on the selected criteria.
-
Filtering/Search: Filtering or search functionalities allow users to quickly locate specific assets or groups of assets within the Topology view, based on custom-defined criteria, streamlining the process of finding relevant elements.
4. Geomap Widget Definition
The Dashboard's Topology Widget now offers new configuration settings, allowing users to enable the Assets Panel and the Topology Control Panel for enhanced functionality.
Configuration Options
- Configuration for Control Panel (Nodes/Edges Tables)
{
    "title": "Geomap View",
    "widget_type": "topology_geomap",
    "with_graphdb":true,
    "widget_template": "common/geo-map",
    "reportId": "myreportId",
    "mapProperties": {
        "initialMapZoom": 5,
        "mapTableWidth": 250
    },
    "edge_colors": [
        "#455a64",
        "#f57c00",
        "#fbc02d",
        "#388e3c",
        "#0097a7",
        "#1976d2",
        "#8e24aa",
        "#d81b60",
        "#d32f2f"
    ],
    "node_display_attrs": [
        "node_id",
        "device_ip",
        "serialNumber"
    ],
    "stack_type": "dynamic",
    “auto_group”: false,
    “expand_all”: false,
    “has_more_data_flag”: false,
    "stack_definition": {
        "name": "Telco Stack",
        "description": "",
        "saved_time": "2023-09-12T21:08:31.418255",
        "is_dynamic": true,
        "hierarchical": true,
        "dynamic_nodes": {
            "stream": "graphdb://cfx_rdaf_topology/cfx_rdaf_topology_nodes",
            "query": "collection_timestamp is after -30d"
        },
        "dynamic_relationships": {
            "stream": "graphdb://cfx_rdaf_topology/cfx_rdaf_topology_edges",
            "graph_name": "cfx_rdaf_topology_graph",
            "query": "collection_timestamp is after -30d",
            "relation_map": "rdaf_topology_relationships"
        }
    },
    "nodes_report": {
        "group_filters": [
            {
                "title": "Layer",
                "group_by": [
                    "layer"
                ]
            },
            {
                "title": "Node type",
                "group_by": [
                    "node_type"
                ]
            }
        ],
        "reportMetaData": {
            "sorting": true,
            "filtering": true,
            "title": "Nodes",
            "remote_searchable": false,
            "rowInfoPopup": {
                "showRowSummary": true
            },
            "remote_searchable_cols": [
                "name",
                "node_label",
                "node_id",
                "node_type"
            ],
            "actions": [
                {
                    "permission": "rda:user_dashboard:view",
                    "appName": "user-dashboard/topology-workbench",
                    "drillDownLinkField": "node_label",
                    "identifier": "launch.dashboard.topology-workbench",
                    "selectionType": "SINGLE",
                    "title": "Path Visualization",
                    "contextParamList": {
                        "contextParams": [
                            {
                                "paramKey": "node_id",
                                "paramId": "node_id"
                            }
                        ]
                    },
                    "type": "GO_TO_APP_STATE"
                }
            ],
            "reportColumnDefinitionList": [
                {
                    "identifier": "node_label",
                    "title": "Name",
                    "key": false
                },
                {
                    "identifier": "layer",
                    "key": false,
                    "title": "Layer"
                },
                {
                    "identifier": "node_type",
                    "key": false,
                    "title": "node_type"
                },
                {
                    "identifier": "node_id",
                    "key": true,
                    "hidden": true
                }
            ]
        }
    },
    "edges_report": {
        "reportId": "rda.saas.topology.edges.report",
        "reportMetaData": {
            "sorting": true,
            "filtering": true,
            "title": "Edges",
            "reportColumnDefinitionList": [
                {
                    "hidden": false,
                    "id": "left_id",
                    "identifier": "left_id",
                    "key": true,
                    "title": "Left Id",
                    "type": "TEXT",
                    "visible": false
                },
                {
                    "hidden": false,
                    "id": "left_label",
                    "identifier": "left_label",
                    "key": false,
                    "title": "Source",
                    "type": "TEXT",
                    "visible": true
                },
                {
                    "hidden": false,
                    "id": "right_id",
                    "identifier": "right_id",
                    "key": true,
                    "title": "Right Id",
                    "type": "TEXT",
                    "visible": false
                },
                {
                    "hidden": false,
                    "id": "right_label",
                    "identifier": "right_label",
                    "key": false,
                    "title": "Destination",
                    "type": "TEXT",
                    "visible": true
                },
                {
                    "hidden": false,
                    "id": "relation_type",
                    "identifier": "relation_type",
                    "key": false,
                    "title": "Relation",
                    "type": "TEXT",
                    "visible": true
                }
            ],
            "actions": []
        }
    },
    "height": 12,
    "min_width": 12,
    "widget_id": "182287d8"
}
Parameter Name |
Description |
|---|---|
Stack_type |
Stack Type can be “static” or “dynamic”. The default value assumed is “static”. If stack type is not defined or it is defined as “static”, then the user can give the name of the predefined stack with attribute “stack”. If the stack type is defined as “dynamic”,then the user can provide a “ stack_definition” as part of the widget definition. |
Stack_definition |
This is a dynamic stack definition. As part of the definition, the user can specify where to read stack data from. Data can be read from a pstream or from graphdb collection. In either case, “stream” attribute can specify pstream name or graphdb collection name. If the stream name starts with” graphdb://” it means that we are reading data from graphdb. This is the data that is shown on the left side of the Control Panel.Dynamic_nodes: Specifies where to read nodes related data for topology. Dynamic_relationships: Specifies where to read relationship/edges data for topology. In the case of graphdb, the user needs to specify graph_name and relation_map name also. |
Limit_to_node_types |
This is another parameter that can be used to limit the amount of nodes that are displayed for the first time when topology is loaded in the Control Panel. Backend will return nodes and relationships only related to specified node_types. |
Nodes_report |
This attribute lets users define the columns to be displayed as part of Nodes Report on the right side of the Control Panel. It is like a tabular report with reportColumnDefinitionList and can also add actions. To change the title of the report from default “Nodes”, use the “title” attribute in reportMetaData. |
Edges_report |
This attribute lets users define the columns to be displayed as part of Links/Edges Report on the right side of the Control Panel. It is like a tabular report with reportColumnDefinitionList and can also add actions. To change the title of the report from default “Links”, use the “title” attribute in reportMetaData. |
with_graphdb |
This configuration is added to enable compatibility with the GraphDB-based stack |
4.1 Using Geomap Control Panel
The Topology Control Panel houses a suite of tools and controls that enable users to manipulate and interact with the topology in a variety of ways.
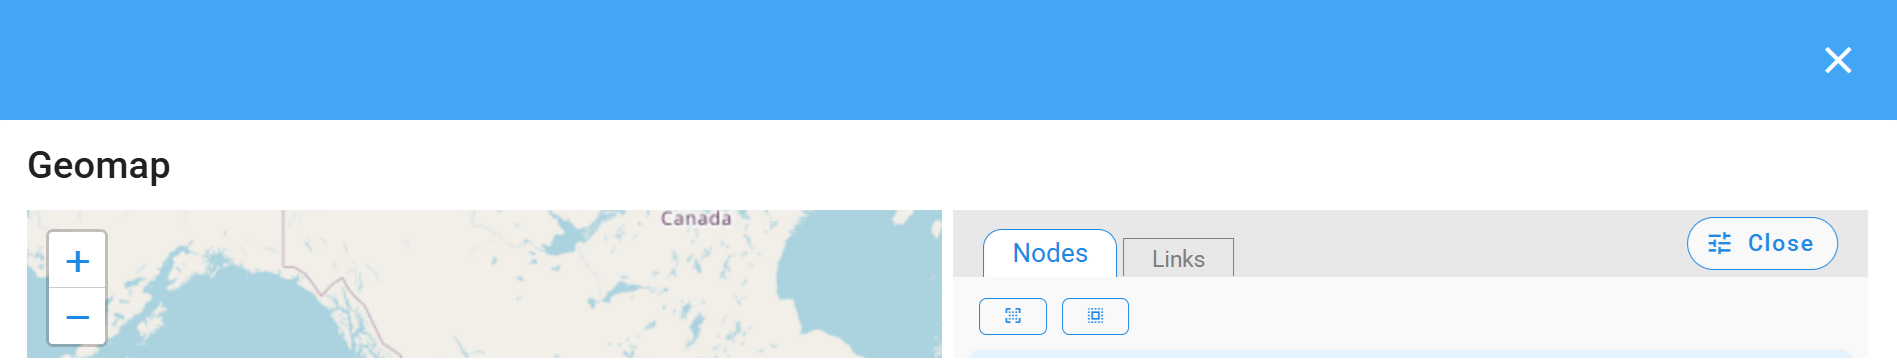
Users can collapse the Control Panel or reopen by clicking the button in the right of the toolbar or resize the portion by dragging the handle in the center divider.
-
Elements : The Nodes/Links tables display the node and link elements shown in the Geomap view and provide detailed information about each of these elements. The Geomap view is always synchronized with the current selection in the control panel, ensuring that the geomap view updates to highlight only the relevant elements based on the selection.
-
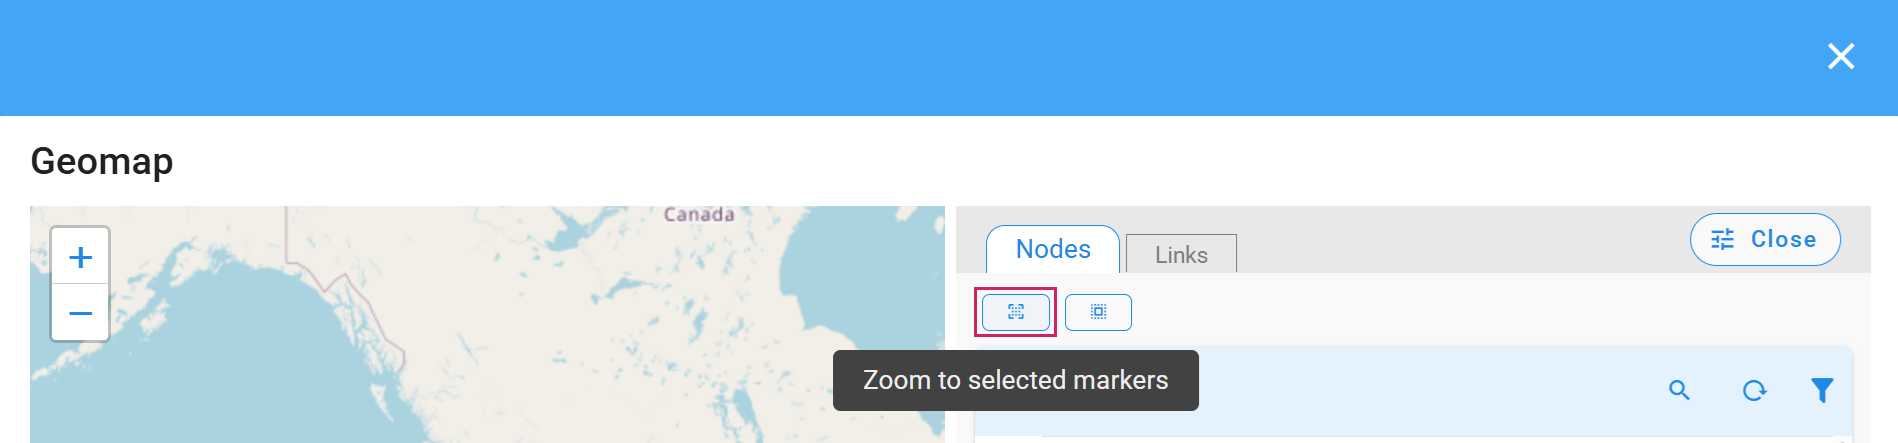
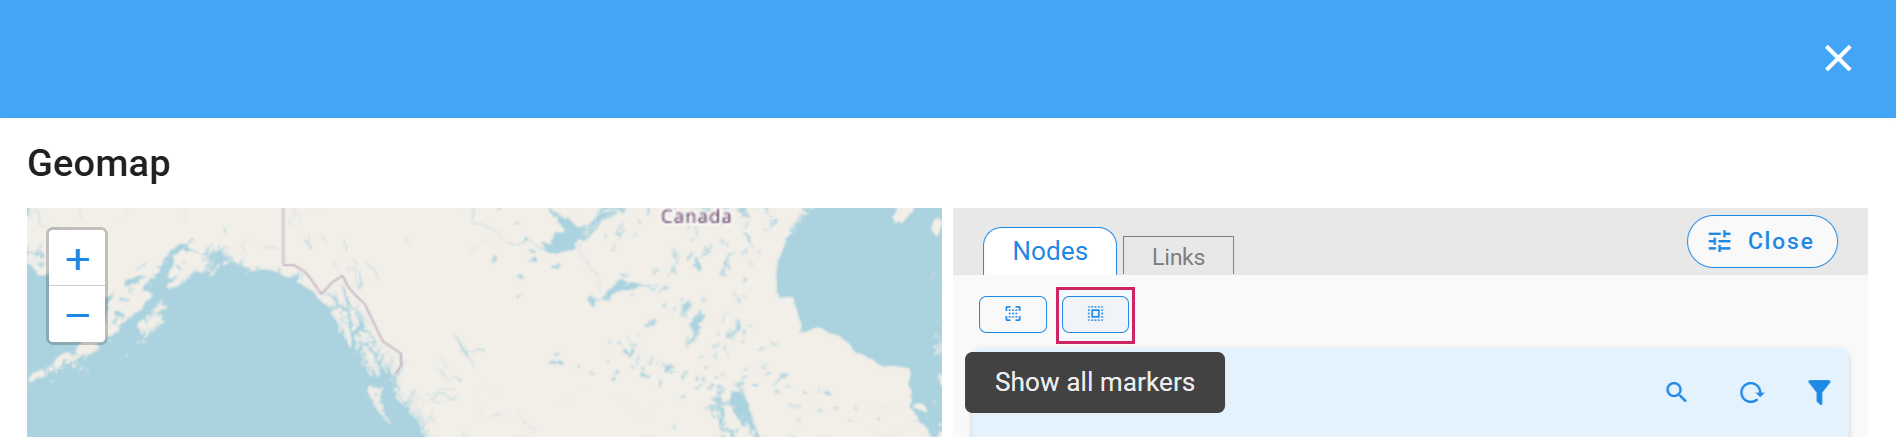
Action Tools: Actions can be applied to selections: Zoom to Selected markers, Show all markers
-
Reflect Filtered Links in the Chart: When Links table data was filtered by link type for example, you can reflect the topology view to show the graph using the filtered links only.
-
Filtering/Search: Filtering or search functionalities may be provided to quickly locate specific assets or groups of assets within the Topology view based on user-defined criteria.