Beginner's Guide to Building Pipelines and Service Blueprints in RDA Fabric
This document captures step-by-step instructions to build few simple RDA Pipelines and create a Service Blueprint in Robotic Data Automation Fabric (RDAF).
1. Introduction (Pre-requisites)
Before you proceed, make sure you have access to following
- RDA Studio: A Jupyter notebook based User Interface for developing, testing RDA Pipelines.
- RDA Portal: Provides a Cloud based User Interface to run pipelines in cfxCloud or in your on-premises RDA environment
Free RDA Studio and Portal can be accessed in cfxCloud by simply signing up with an email address.
As a first step, login to RDA Studio. It would show an App Launcher:
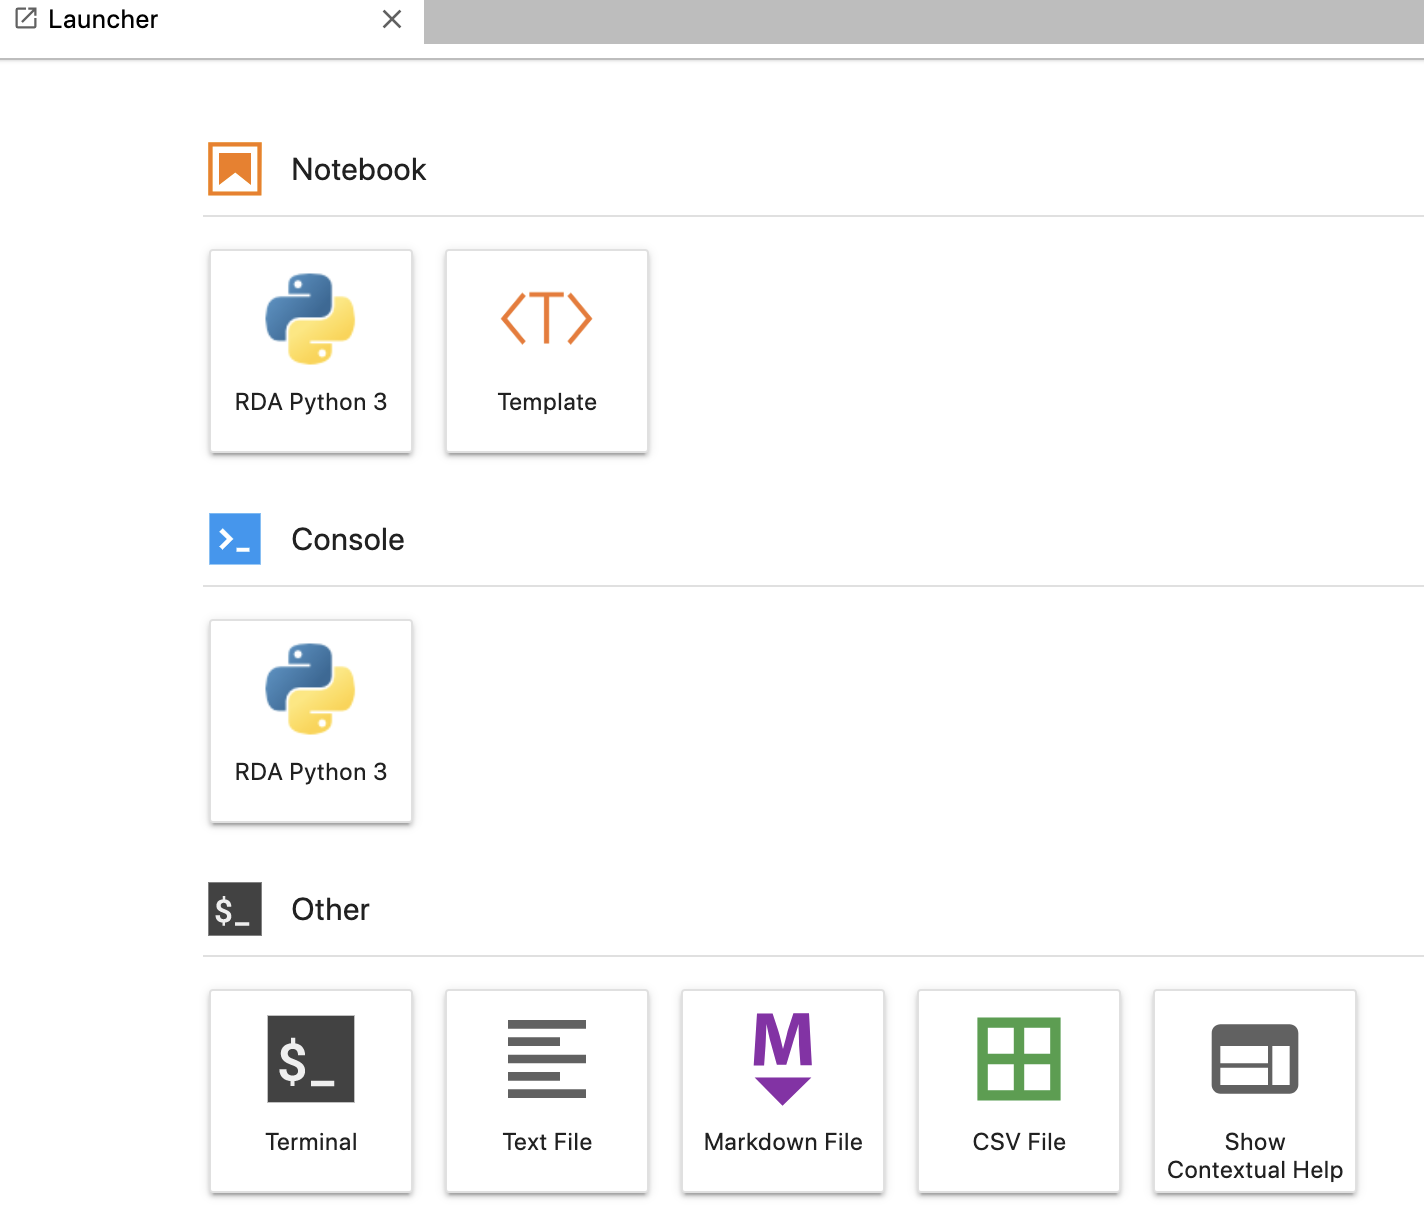
Click on RDA Python 3 Notebook icon to open a new notebook.
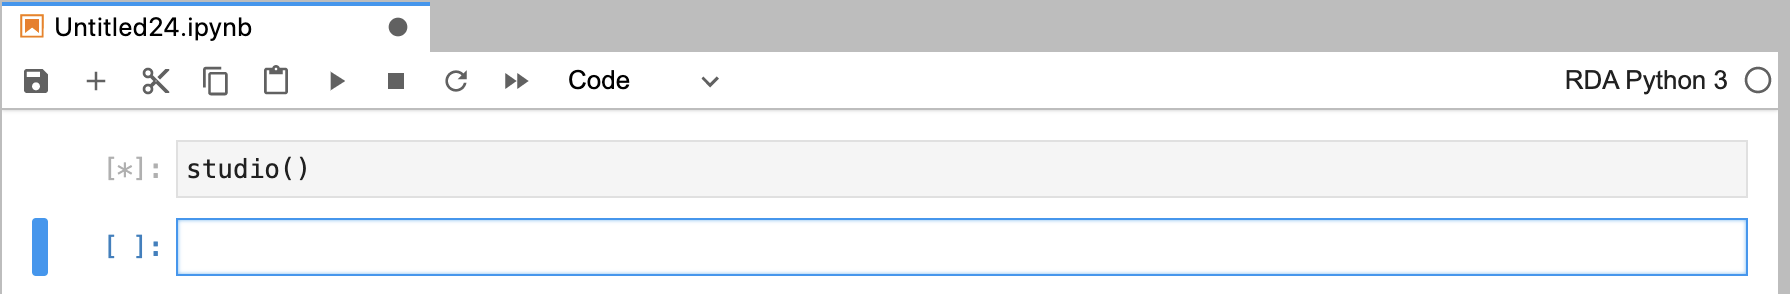
Once the notebook is open, in an empty notebook cell, type studio() and then press Shift+Enter
2. Starting with a sample dataset
In this example, we will use one of the Example Datasets. We will specifically use synthetic_syslogs_dataset
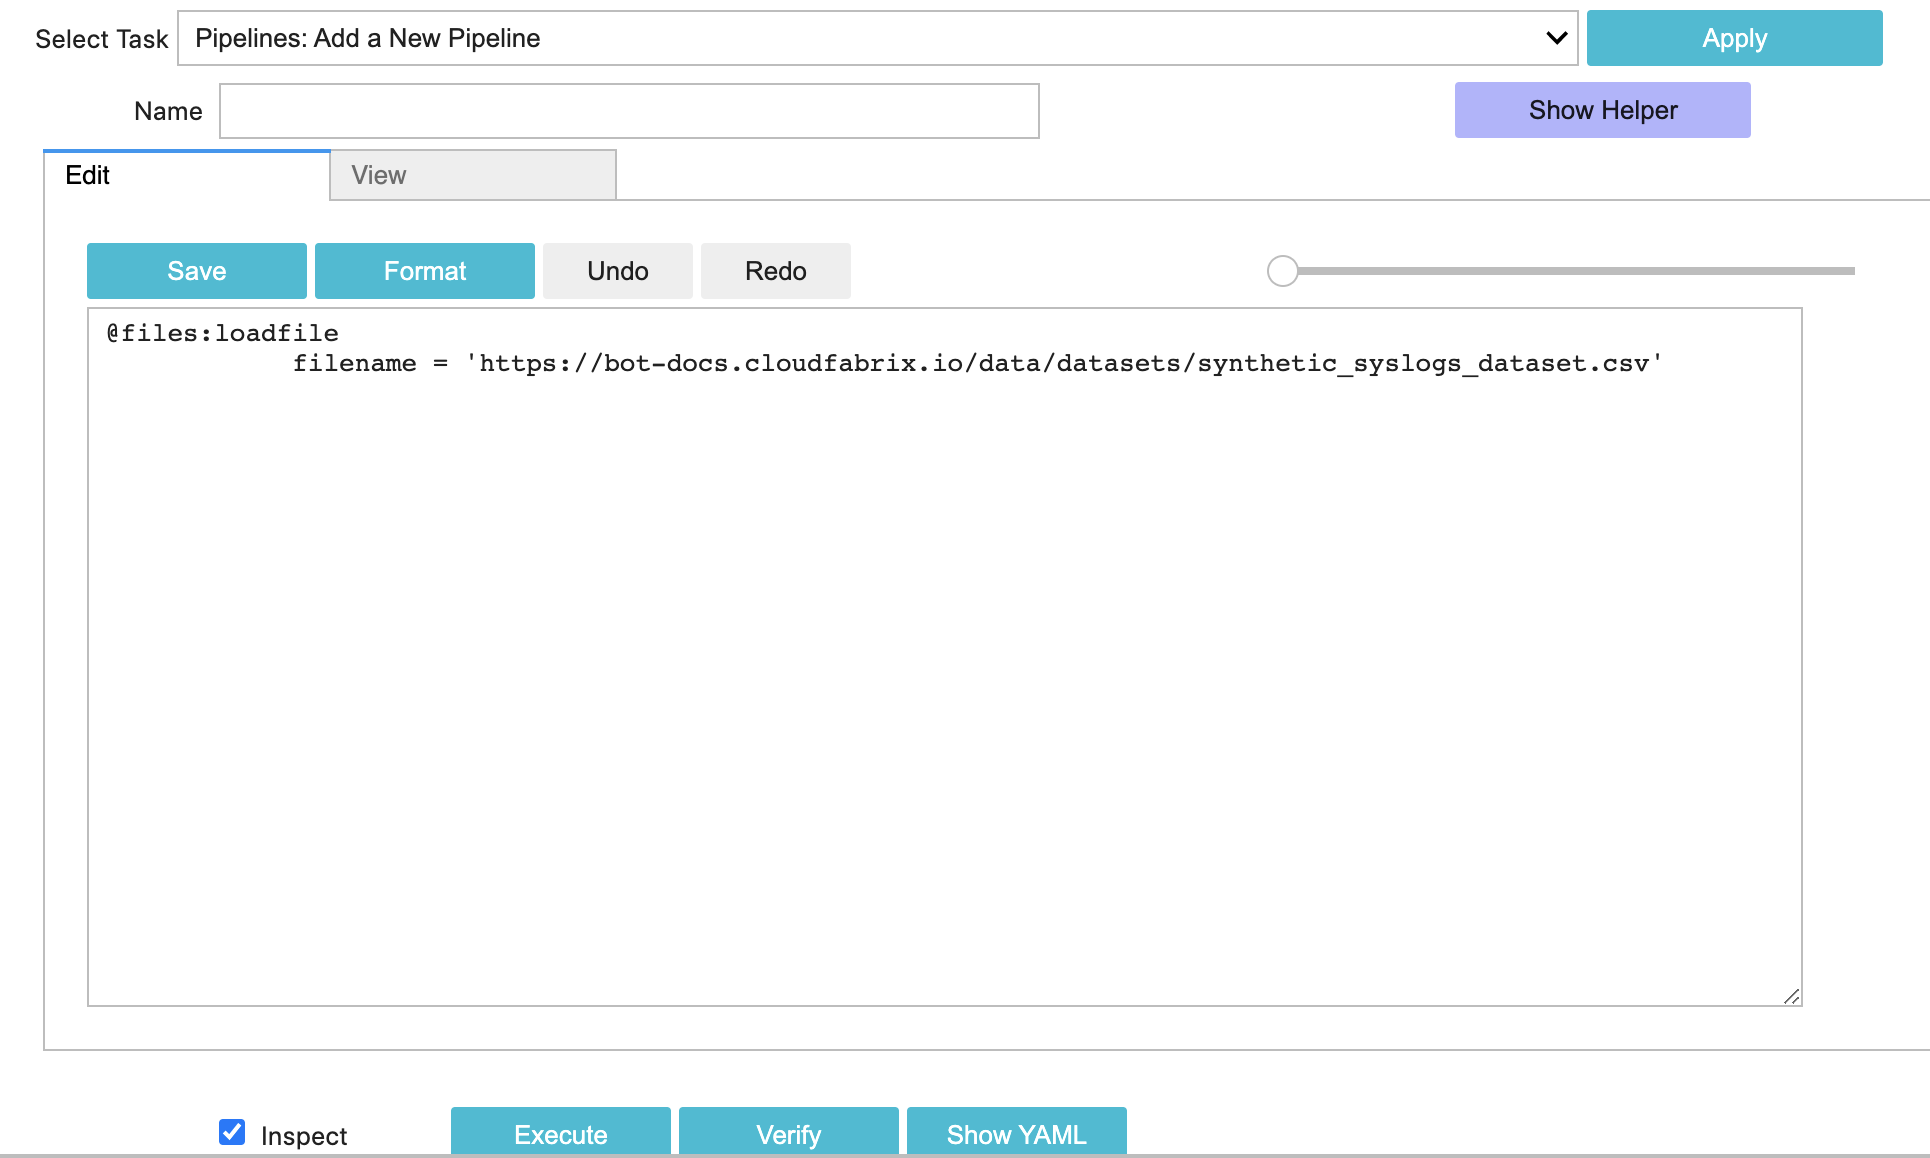
In the Studio, Select Task: "Pipelines: Add a New Pipeline" and start with following simple pipeline with just one bot
It should look like this in your Studio:
Now, Click on Execute to run this very simple pipeline. Pipeline execution should be successful and look like this
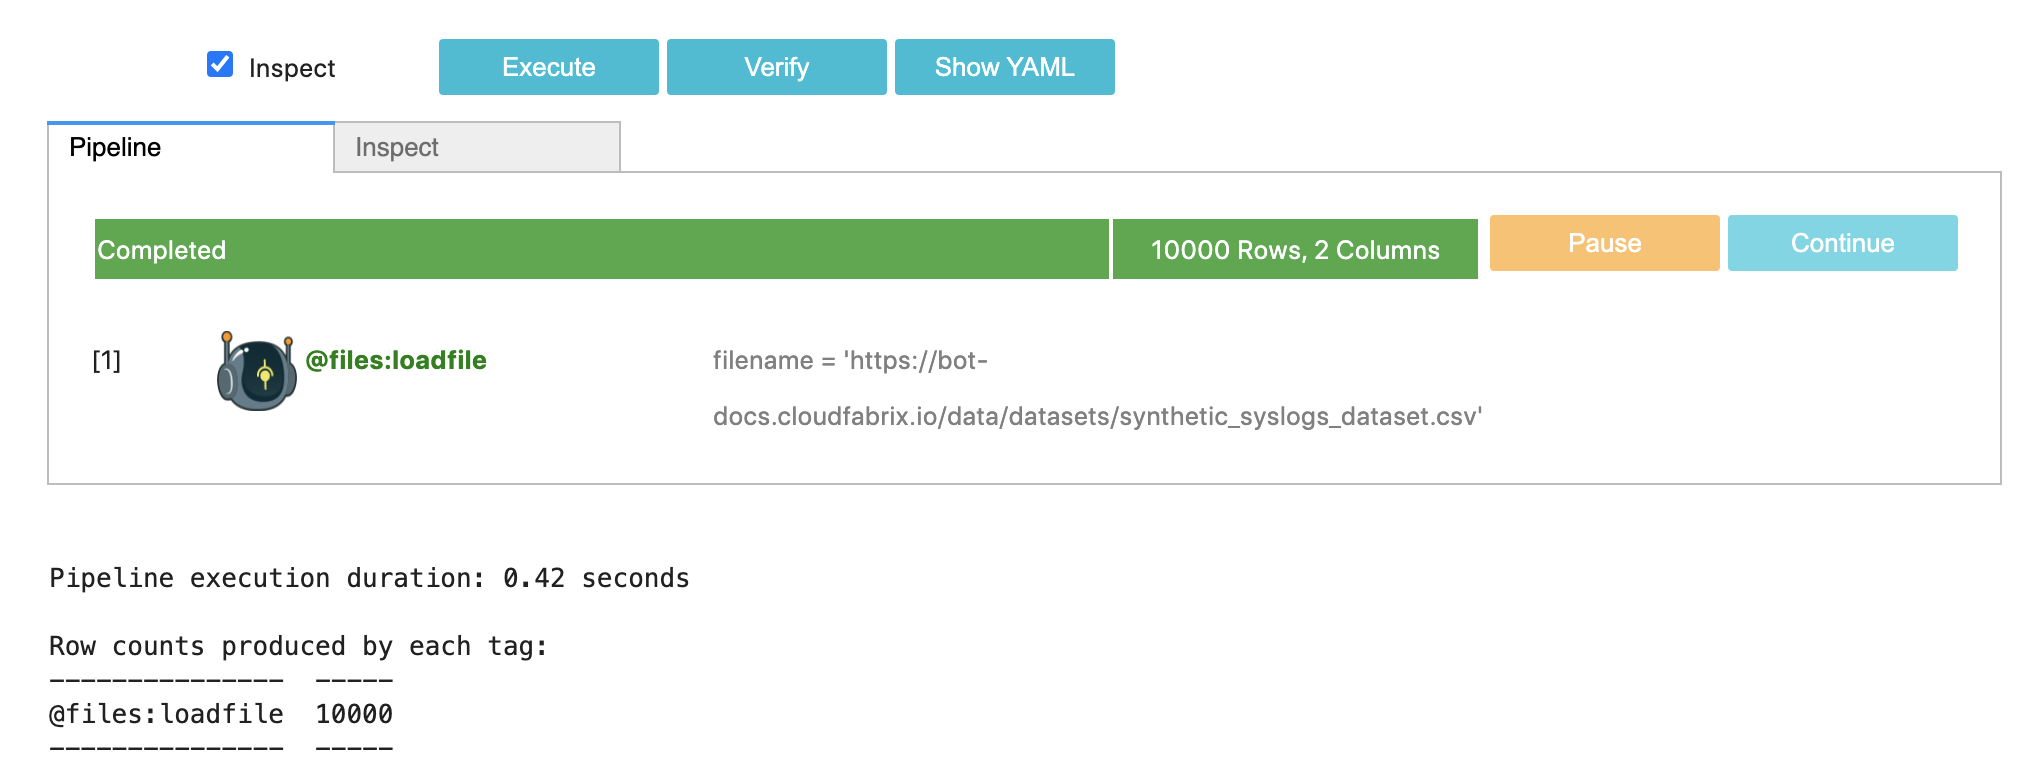
Now select the Inspect tab, which should show the following output:
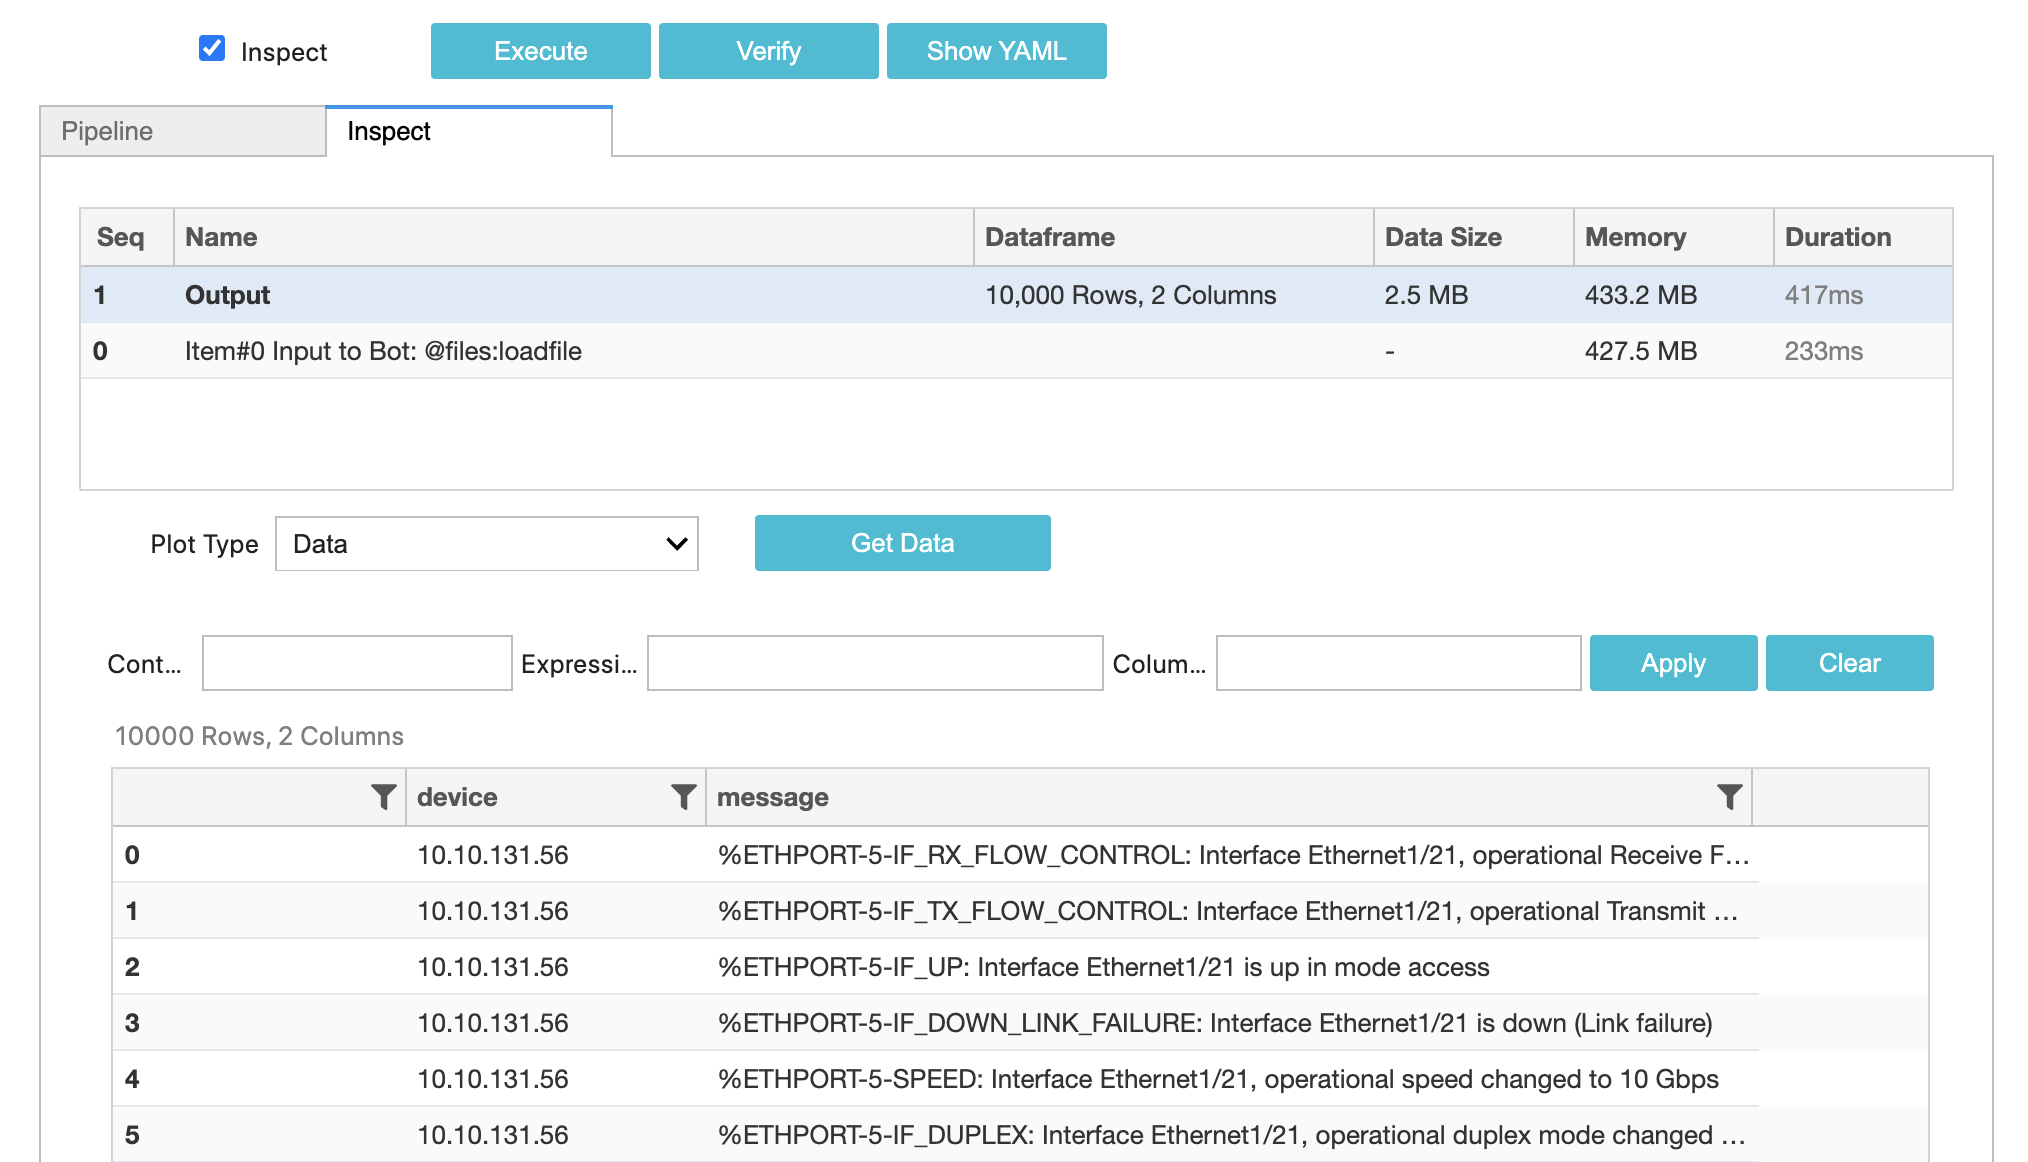
So far we have used the @files:loadfile. As you can see in the Bot documentation, it is a Source Bot. Which implies that bot produces data to be consumed by other Sink bots. In this case, loadfile bot is downloading the data from a URL and returning dataframe for further processing by other bots.
3. Sending the data to a Sink Bot
The pipeline we have produced 10,000 Rows and 2 Columns. Let us use @dm:sample Bot to randomly select 1% of the rows (100 rows)
Playground
If we examine the final Output of this pipeline now, you should see randomly selected 100 rows. Each time you run the pipeline, it would produce 100 rows from the same original 10,000 Rows.
You will also see that output dataframe has just two columns: Device and Message. Let us add timestamp column using @dm:eval Sink Bot. This bot adds a new column using expressions for each row.
Playground
We have now added new column timestamp in the output:
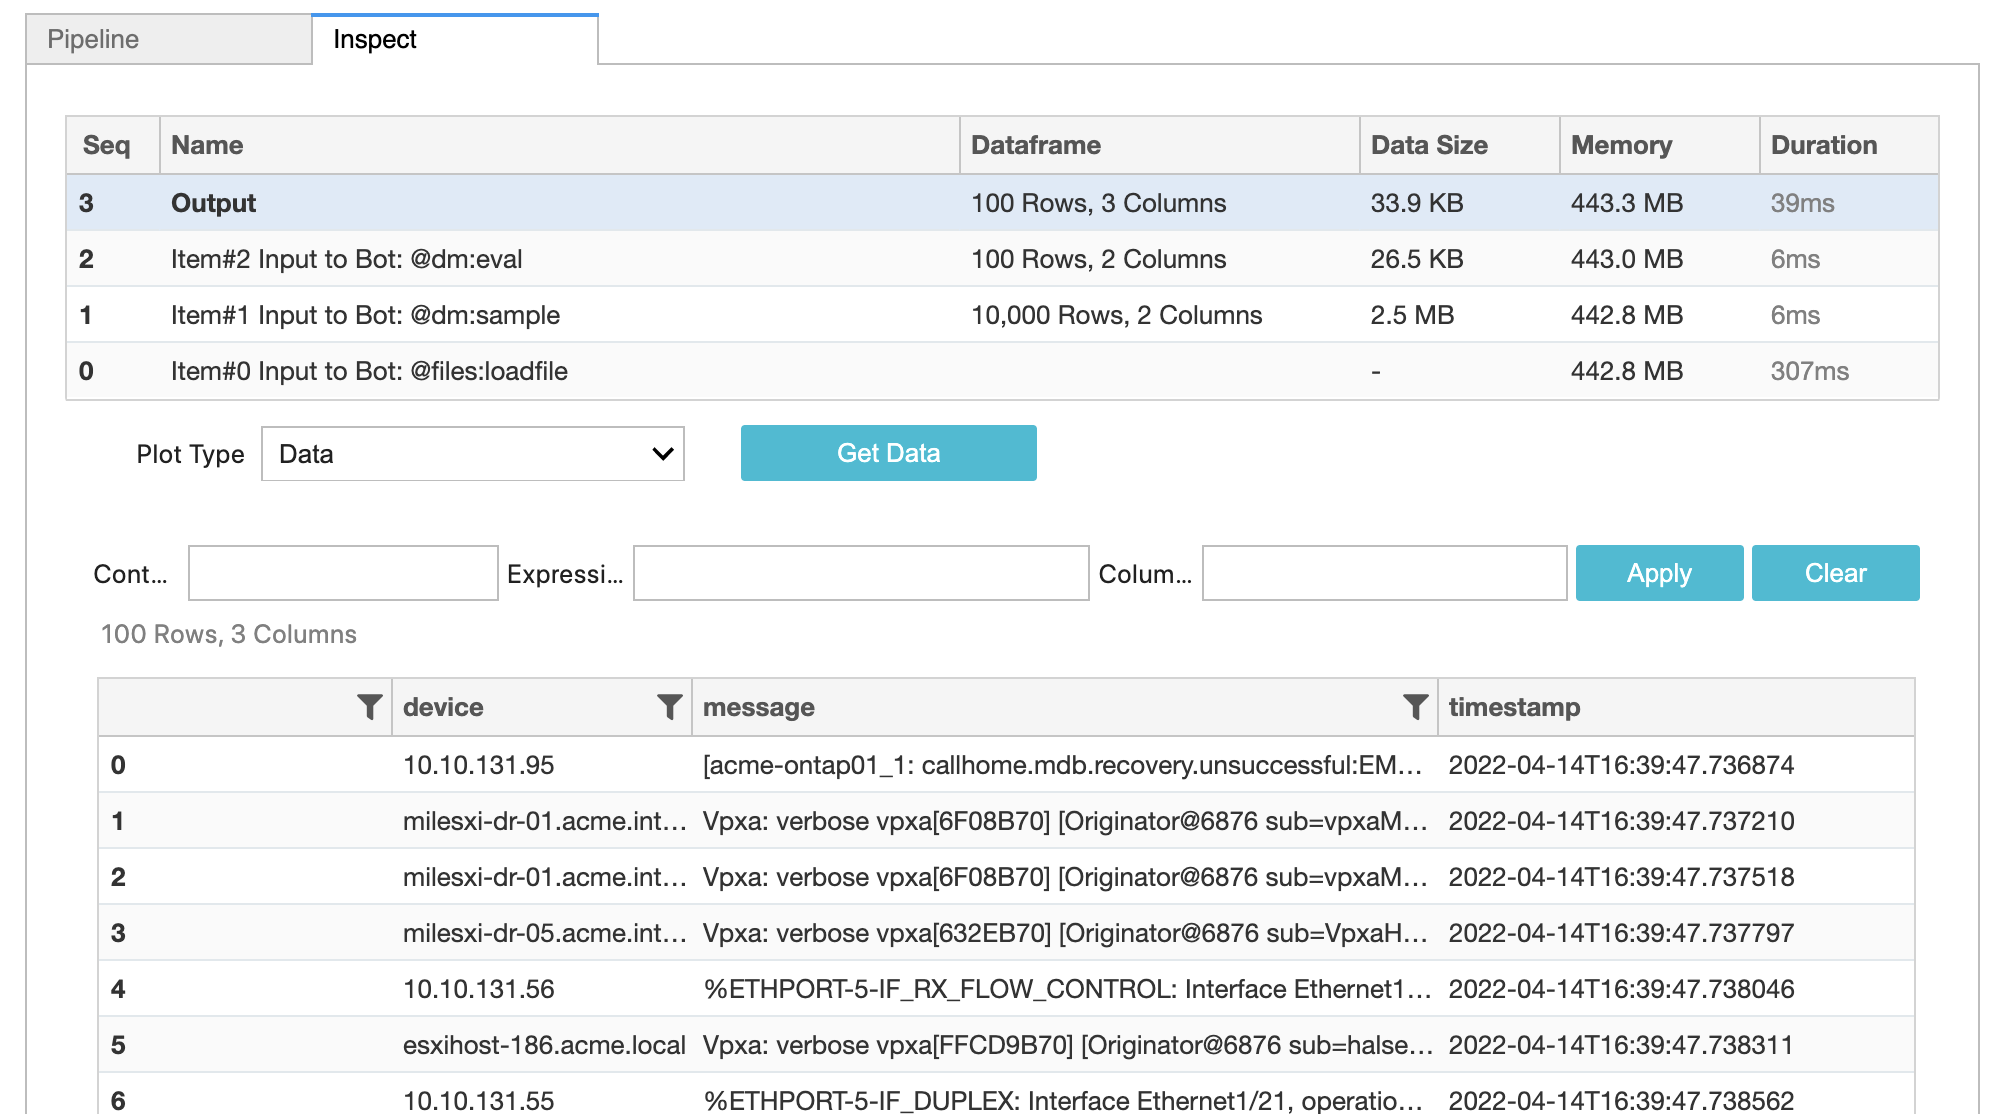
@dm:eval Bot can also be used to add multiple columns in a single statement.
4. Sending data to a destination
So far we have generated randomly sampled data, but we have not send the data to any destination.
In RDA data can be sent to many destinations. Some of the typical data destinations are:
- RDA Datasets: RDA Stores datasets on Object storage like Minio or S3 or any compatible storage systems. cfxCloud uses built-in object storage by default. See bots @dm:save and @dm:recall.
- Many ITSM/ ITOM / Log Management Systems. Most common destinations for logs are Splunk and Elasticsearch / Opensearch
- RDA Streams: RDA provides powerful and flexible way to move the data between different systems and pipelines using Streaming mechanism. More on this topic later.
Below is sample pipeline to save the logs to RDA Dataset:
Playground
Above pipeline saves 100 randomly selected rows to the dataset with name my-generated-logs. By using the parameter append = "yes", dataset can be used as a continuously appended dataset. If the dataset name begins with temp- prefix, then dataset is only saved in-memory and is deleted once the pipeline execution completes.
For our usecase, let us focus on sending data to RDA Stream.
5. Sending data to RDA Stream
RDA Streams use NATS publish-subscribe to exchange data between different pipelines, possibly running in different cloud environments. In addition to NATS, RDA also supports streaming using other similar technologies like Kafka, MQTT, AWS Kinesis and many more.
Data can be written to an RDA Stream by simply using the sink bot @rn:write-stream:
This pipeline segment converts each row of dataframe as a JSON object, and sends it as a message. RDA Stream name is essentially agreed name between publisher and subscriber.
So the updated pipeline with RDA Streaming would look like this:
Playground
We will look into how to read / consume the data from an RDA Stream in section-9.
6. Implementing loops
So far the pipeline generates 100 randomly selected log messages and writes to a stream. But, it does only one time. We can use control bots to bring looping to the pipelines.
In this case, it might make more sense to generate logs on a periodic basis. So we will use @c:timed-loop accomplish this:
The bot @c:timed-loop uses parameter interval which is number of seconds between each loop iteration.
Let us take a look at how Studio Inspect shows the looped data:
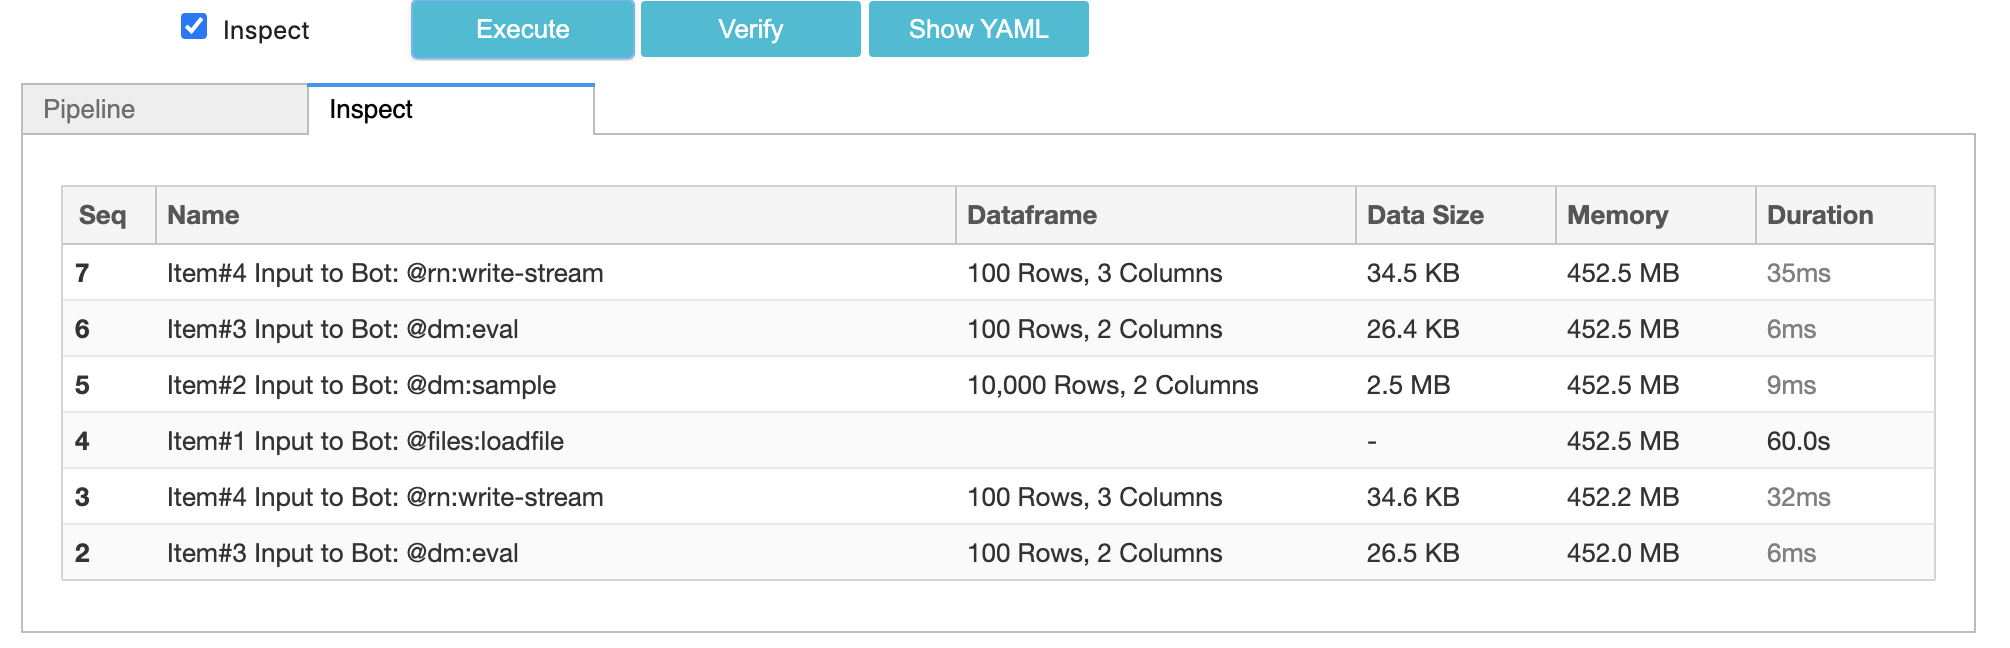
NOTE: control bots do not appear in the Inspect as they do not have any data to show.
7. Using in-memory datasets to cache data
The pipeline is now looping every minute to download a dataset from a URL, do random sampling, add a timestamp column and then write the data to stream. In this case the example dataset has 10,000 rows. What if the dataset is very large, potentially with millions of rows? Downloading it every minute is not optimal use of network resources.
One of the options is to load the data from a URL and keep it in the memory as a temp- dataset.
Now let us update the whole pipeline:
Playground
The updated pipeline now contains two blocks. First block downloads the data from a URL and saves it as in-memory dataset temp-syslogs-dataset
Second block implements a timed loop. During each iteration, it recalls the in-memory dataset.
We have traded for higher continuous memory usage for reducing number of downloads.
For the sake of future reference, let us save the pipeline with name guide-example-produce-logs in RDA Studio
8. Running pipeline from RDA Portal
RDA Studio is a Jupyter notebook based environment for developing, debugging pipelines. Not meant for running pipelines in production RDA Fabric.
All pipelines saved RDA Studio are only meant to run in that Studio. In order to run any pipeline in RDAF, pipelines need to be Published.
There are two ways to publish a pipeline:
- Use RDA Studio action Pipelines: Publish a Pipeline
- Copy-paste the pipeline in RDA Portal.
For this exercise, we will use 2nd approach.
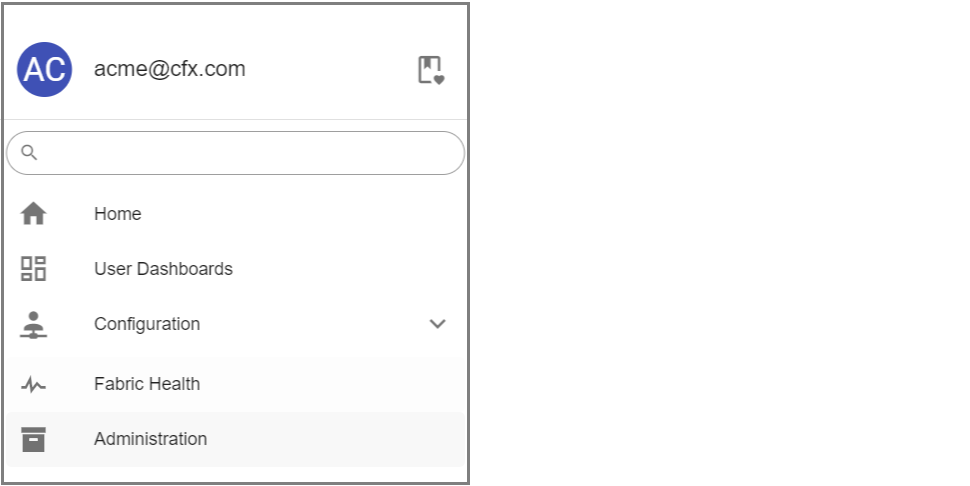
Assuming you have already created a free workspace in RDA Portal in Step-1, login into your workspace. You should see following menu on the left side:
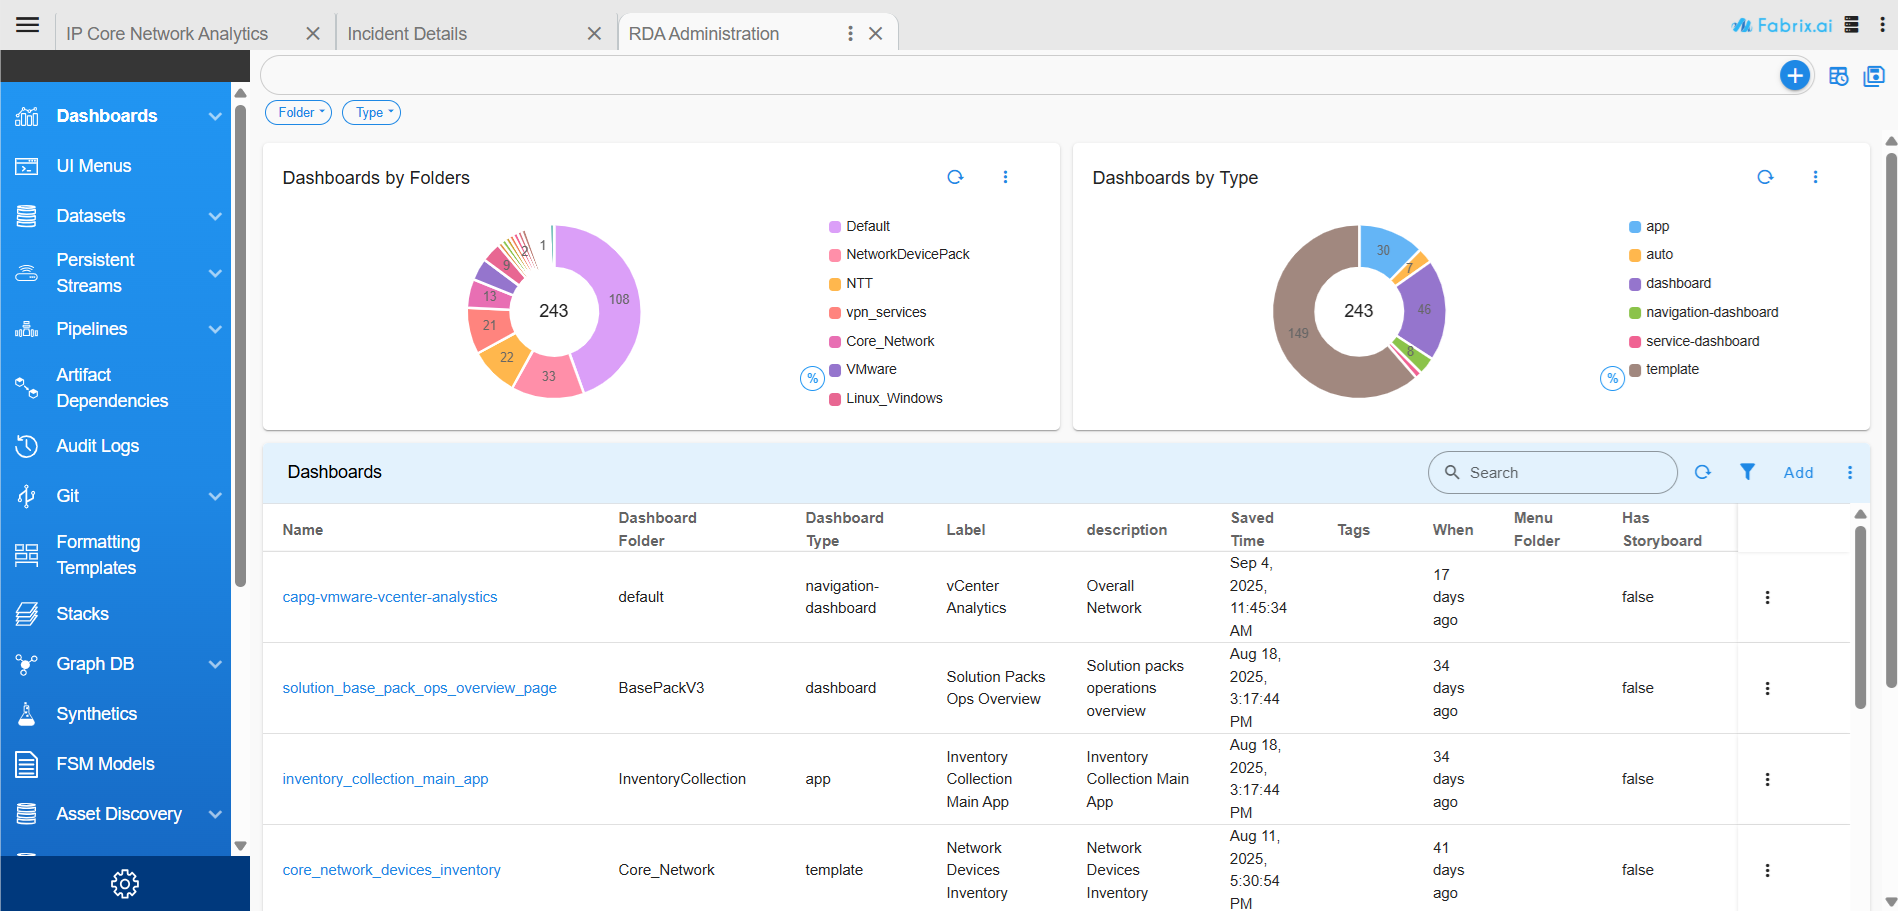
Click on Home Menu -> Configuration -> RDA Administration which would show:
Click on Pipelines -> Draft Pipelines
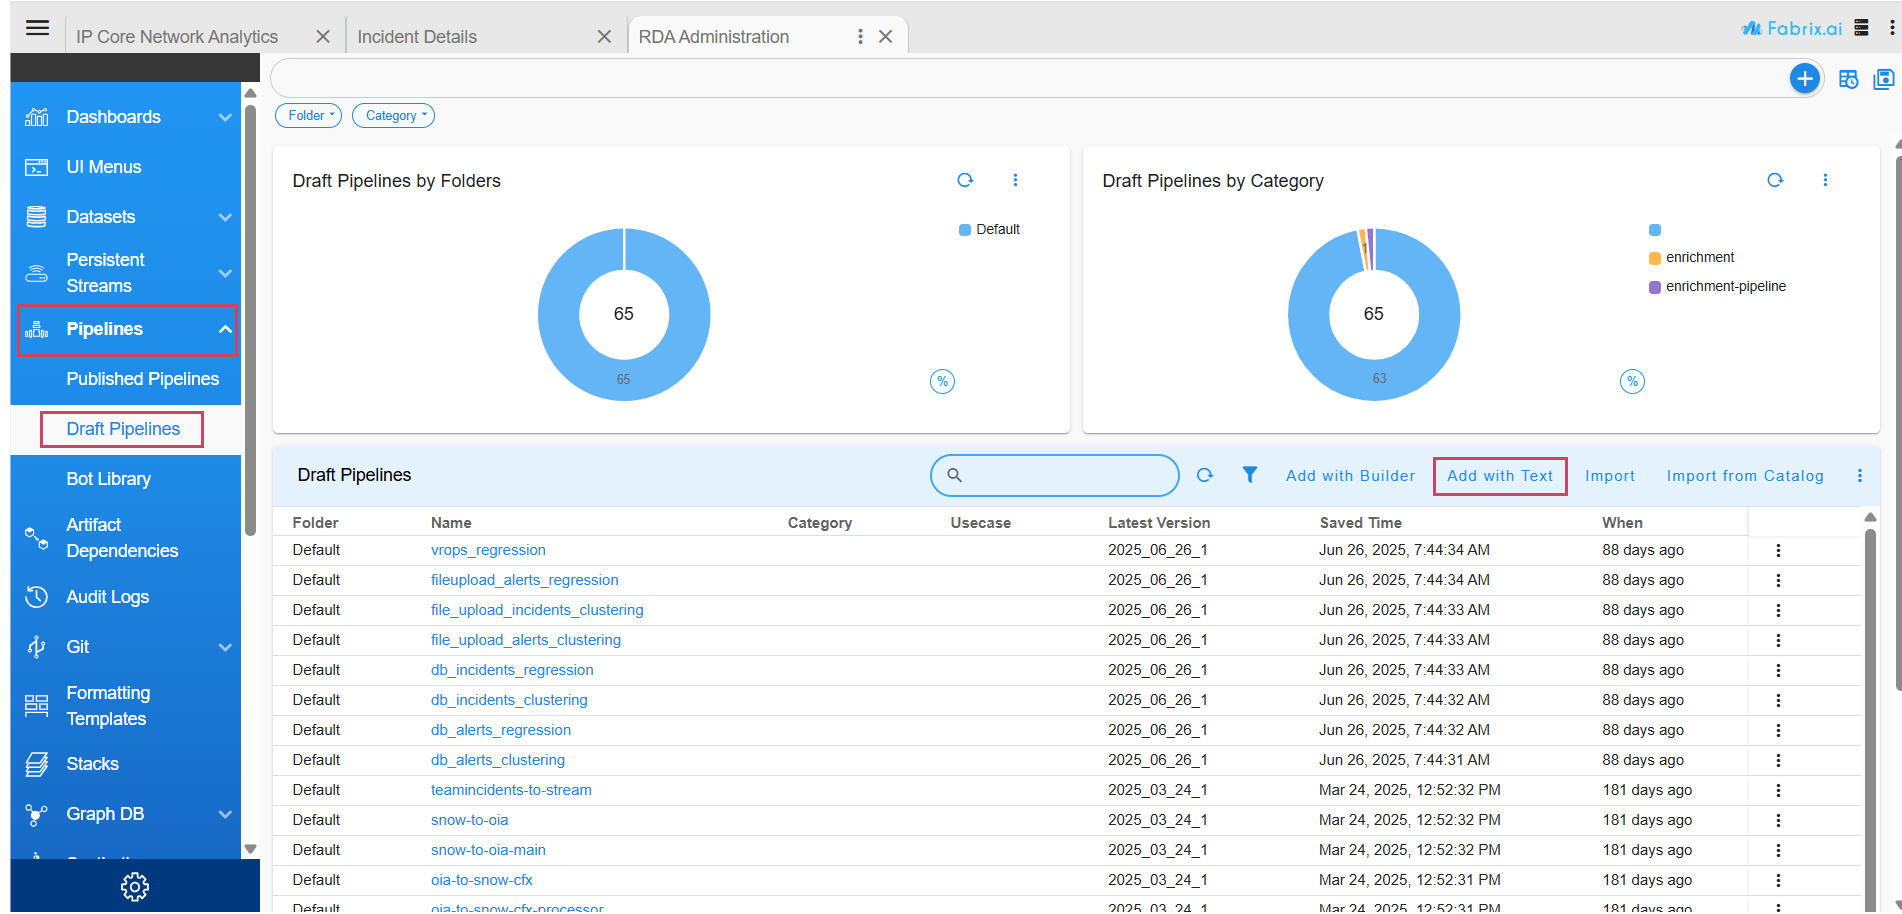
Select Draft Pipelines and Click on Add with Text action to add the pipeline.
Specify guide-example-produce-logs as Pipeline name. Version should be in YYYY_MM_DD_n format. Copy paste following contents into the 'Content' section and click 'Save'.
Pipeline table should show following pipeline and Pop-up actions:
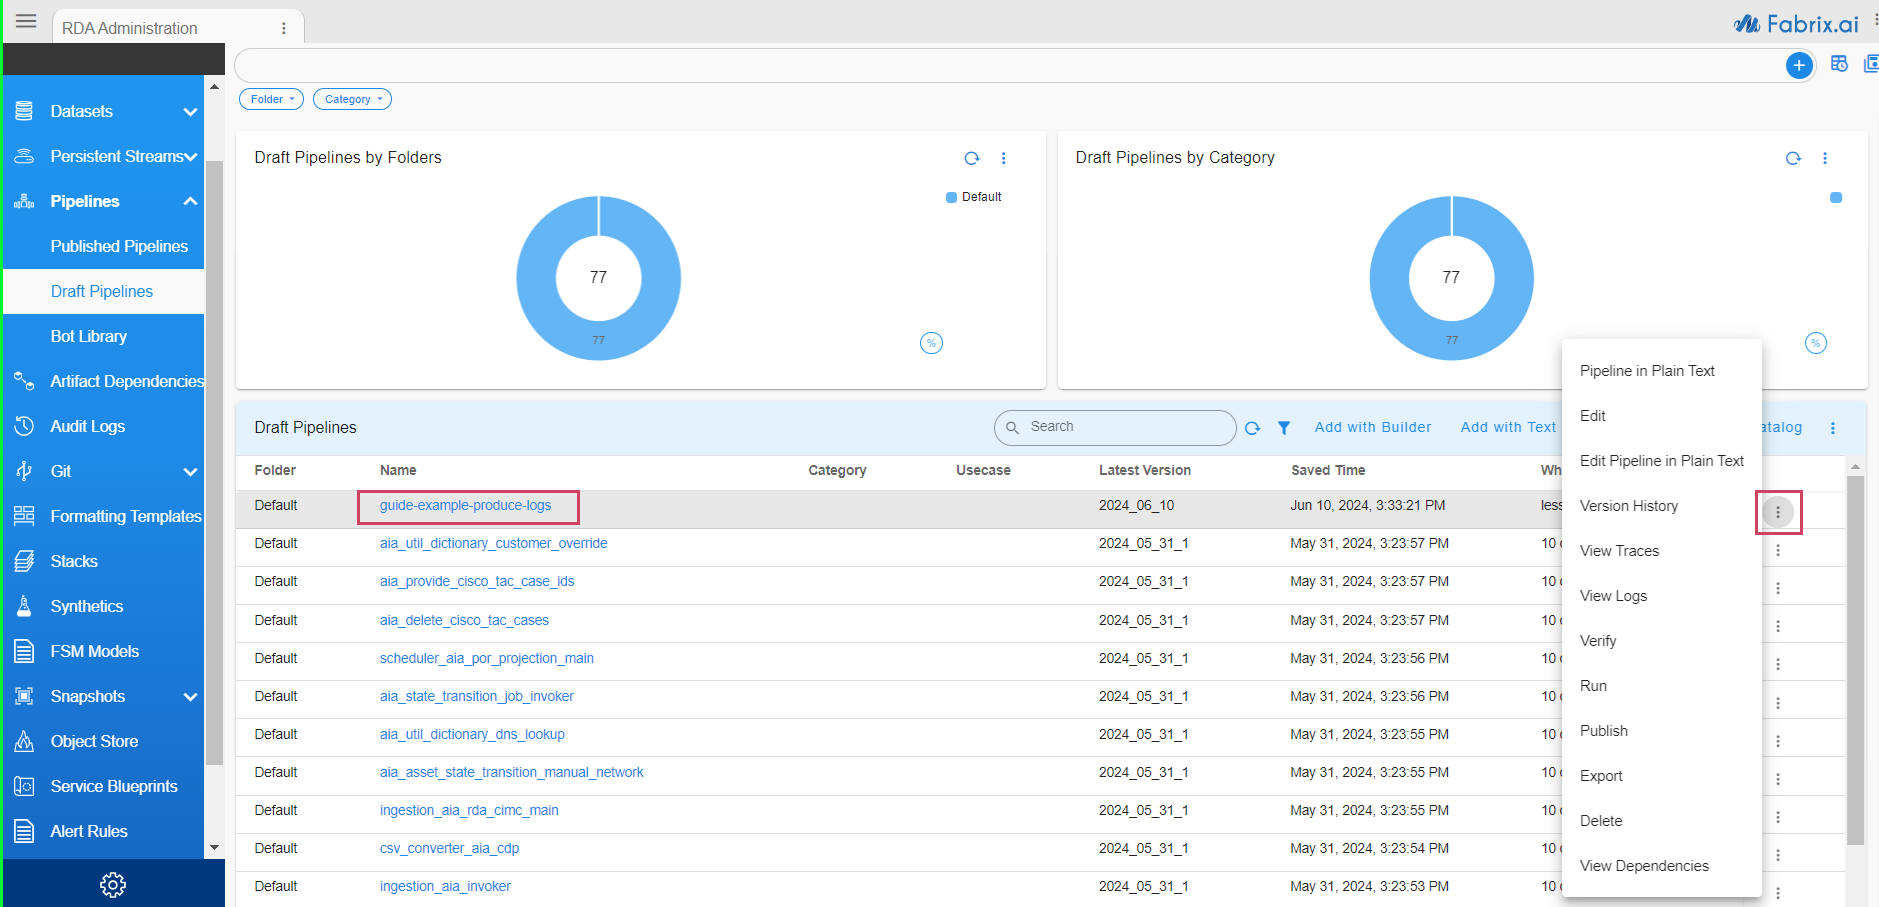
Click Run from the pop-up actions for that pipeline. RDAF would start running the pipeline on one of the RDA Worker nodes.
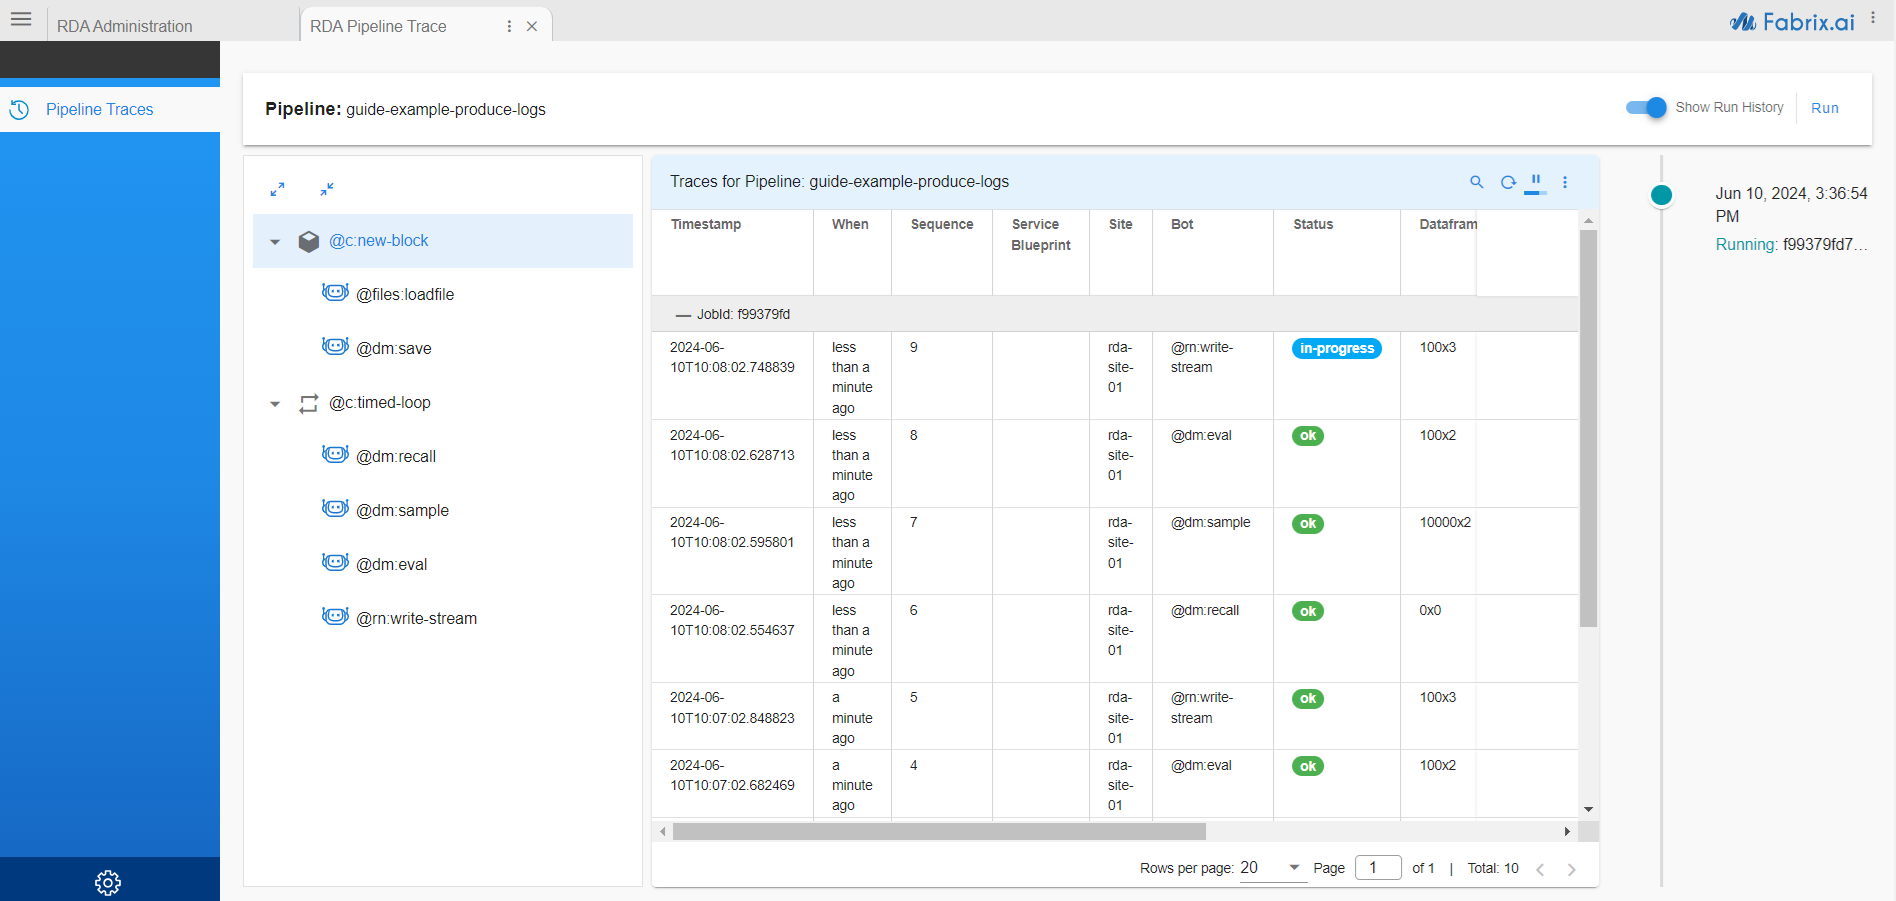
You can view most recent traces for each bot that is getting executed in this pipeline using View Traces popup action.
Example Traces Report would show:
9. Reading data from an RDA Stream
Earlier pipeline has been writing randomly selected messages to an RDA Stream. Let us see how we can consume it.
If you have installed RDA CLI Client in any of the supported environments and if you are already connected your RDAF, you can use following command to verify that messages are being published to the desired stream:
It would show output similar to the following:
Note
rdac.py read-stream command can be terminated using Ctrl+C (If you ran the command inside Jupyter notebook, you would need to restart the Kernel to stop the command)
10. Building stream consumer pipeline
For this exercise let us start creating a new pipeline guide-example-consume-logs.
The bot @rn:read-stream is Source bot. It reads set of messages from the the stream and sends it to next bot (if any).
Note that all bots that read stream are forever looping bots. They don't need to be placed inside a loop like write-stream bots.
This bot has two parameters:
name = "synthetic-logs-raw": This stream name should match the name used in our producer pipeline.group = "example": This parameter specifies how the data is replicated between different consumers. If two different consumers use same group name, only one of them will receive any specific message posted on that stream. If they use different group names, each consumer will receive copy of every message posted to that stream.
Normally, we would do following tasks in a log / event consumer pipeline (in that order):
- Save the raw / unfiltered logs to Log Archive.
- Do some filtering and remove some noise / events deemed un-necessary.
- Send filtered data to a destination.
For now, we will skip step #1 and come back to this later in this guide.
In real world, we will use more advanced techniques for filtering, but for the sake of this guide, we will use only basic filtering. Most simple way to filter out some data is to use *dm:filter Bot.
So the pipeline now looks like this:
In the above pipeline we are asking to include any data that matches the specified filter criteria. In this case *dm:filter bot will filter out any rows where column device has value 10.10.131.56. This bot accepts CFXQL and refer to the link for full syntax.
Now that we have filtered out some data, let us send remaining data (if any) to a destination. Normally it would be an ITSM or ITOM or Log Management Tool. For simplicity, let us send this to a NULL stream.
In RDAF, NULL streams are special purpose streams which simply discard the data.
11. Sending data to Log Archive
RDAF uses AWS S3 or any compatible storages to archive any data using the ingestion timestamp and indexes the data using MINUTE part the timestamp. For example, if the event had been ingested at the timestamp 2022-03-28 15:03:45 it would be saved under the folder 2022/03/28/15/03/ in object storage.
Normally, you would provide storage details for archiving your logs in RDA Portal using menu Data → Log Archives → Add
For the sake of simplicity, we will use RDAF Built-in object storage. The bot @dm:create-logarchive-repo will create a named Log Archive repo in that built-in storage.
Following pipeline would create the archive (if does not exist already):
The above bot is using 3 parameters:
repo = "demo_logarchive": Name of the log archive repository to be created in object storageprefix = "demo_logs/": Object path prefix inside the object storage bucket.retention = 31: How long to retain the data in the archive. In this case keeps minimum of 31 days.
We will use @dm:logarchive-save bot to actually save the data in the above archive repository.
Let us take a look at the pipeline that combines reading of data from a stream along with archiving.
We have created a two block pipeline. Once we create the Log Archive in first bot, we need to start reading the data from RDA Stream using @rn:read-stream bot. However, @rn:read-stream is a Source bot. It can only be used at the beginning of any Block in RDA pipeline. @c:new-block can be used anytime we need to insert simple block.
Within one Log Archive, we can have any number of named Archives. In this case we are saving the data under archive exammple_guide_syslogs.
Save the pipeline data in RDA Pipeline using Section-8 Instructions with name guide-example-consume-logs.
12. Stopping the pipelines
In RDA Studio:
- Pipelines can be stopped by restarting the Kernel where the pipelines are currently running
Using RDA CLI Client
- List of active jobs can be queried using
rdac.py jobs - Any specific job can be evicted using
rdac.py evict
rdac.py evict command accepts following parameters:
    --jobid JOBID  RDA worker jobid. If partial must match only one job.
    --yes          Do not prompt for confirmation, evict if job is found
13. Introducing service blueprints
So far we have seen:
- How to build a simple pipeline in Studio, Run it, Inspect data
- How to publish pipelines using RDA Portal and run them in RDAF
- How to create loops
- How to read and write to streams
- How to archive data in object storage.
In this simple example, we have created two pipelines:
guide-example-produce-logsguide-example-consume-logs
These two pipelines can be considered as single service as they work together to address a specific need.
In this section we will learn about RDA Service Blueprints which will help to:
- Manage lifecycle of a service in RDA
- Manage scalability
- Manage dependencies between pipelines, other artifacts like Credentials
- Create and Manage Service specific dashboards
Each RDA Service Blueprint is typically a single YAML file. Let us take a look at our first blueprint:
Following are the parameters we used in the Service Blueprint:
name: Name of the Blueprint. This is visible in the Services.id: Unique ID for the service. Each Service Blueprint ID in an RDA Fabric should be unique.version: Version of the blueprint inYYYY_MM_DD_nformat.category: Optional label for the blueprint category. Example categories are ITSM, ITOM, AIOPS, Log Analytics. Optional.comment: A descriptive text explaining the blueprint purpose. Optionalenabled: Boolean value. If set tofalse, blueprint will be disabled and pipelines will not be scheduled for execution.type: Must be set to 'Service'.provider: Name of the company or contact information creator of the blueprint. Optional.service_pipelines: List. Zero or more objects listing pipelines that are part of the Service. See below for more details.artifact-dependency-validation: Section to control the pre-validation of a blueprint. See below for more details.
Service Pipelines Section (service_pipelines)
In RDA Service Blueprints, the term Service Pipeline implies that pipeline must be in always running mode. These pipelines are typically infinite looping pipelines or pipelines reading from a stream. RDAF monitors the status of each Service Pipeline continuously. If any of the Service Pipeline exits or fails, it will restart.
Let us take a look at the first Service Pipeline in our blueprint above:
Service Pipeline parameters:
name: Name of the Pipelinelabel: Label for the Pipelineversion: Version of the pipeline to use.*implies any latest version of the pipeline.site_type: Valid values areregexorname. If set toregex, the site parameter is interpreted as a regular expression. If set toname, the site parameter is interpreted as an exact name of the site. Default isregexsite: Either name of pattern identifying the Site for the RDA Worker(s). RDAF uses prefixcfx-for all workers hosted in cfxCloud.instances: Number of instances to start for this Service Pipeline. Default is 1. If set to 0, no instances would be scheduled. User can configure this value from RDA Portal.scaling_policy: Defines manual scaling policy for this service pipeline.min_instances: Minimum number of instances user is allowed to configure for this service pipeline.max_instances: Maximum number of instances user is allowed to configure for this service pipeline.
Artifact Validation Section (artifact-dependency-validation)
RDAF performs audit of all aspects of a service blueprint on a periodic basis. This audit typically checks for following:
- Ensure specified pipelines & versions are found in the system
- Ensure that all artifacts such as Credentials, Datasets and Log Archives are properly created.
- Ensures that specified sites have at least one RDA Worker deployed.
Warning
If the audit fails, RDAF will not schedule the pipelines.
In this example consumer pipeline, we are creating the log archive repository using bot. So inform the RDAF Audit function to skip this specific validation:
14. Deploying service blueprint in RDA Portal
First, let us verify that following two pipelines have been published using RDA Portal:
guide-example-produce-logsguide-example-consume-logs
Login to RDA Portal. click on Configuration -> Rda Administration -> Pipelines -> Published Pipelines
Search for guide using quick search. If the report looks something like this, we have the necessary pipelines:
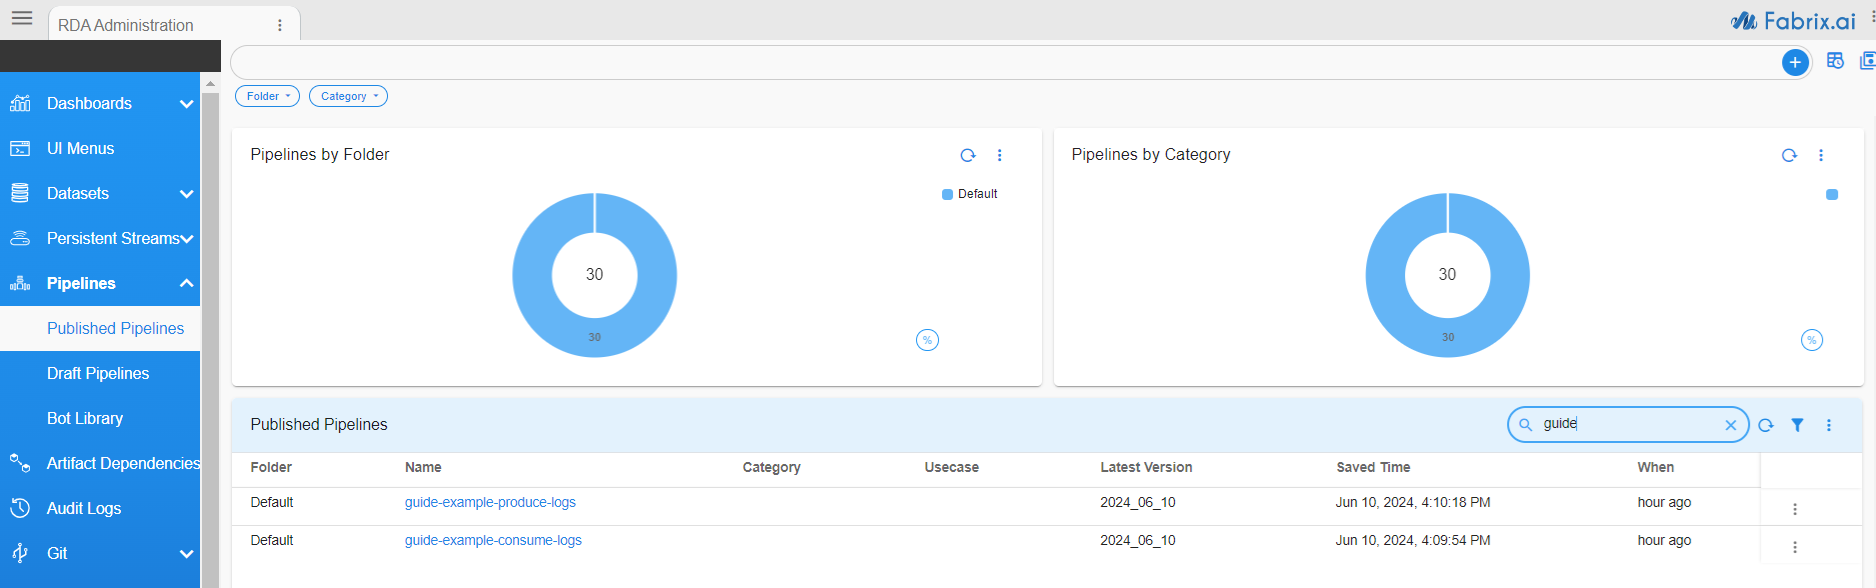
If you do not see the necessary pipelines, follow the instructions at Section-8 Instructions and publish the pipelines.
click on Home Menu -> Configuration -> Rda Administration -> Service Blueprints
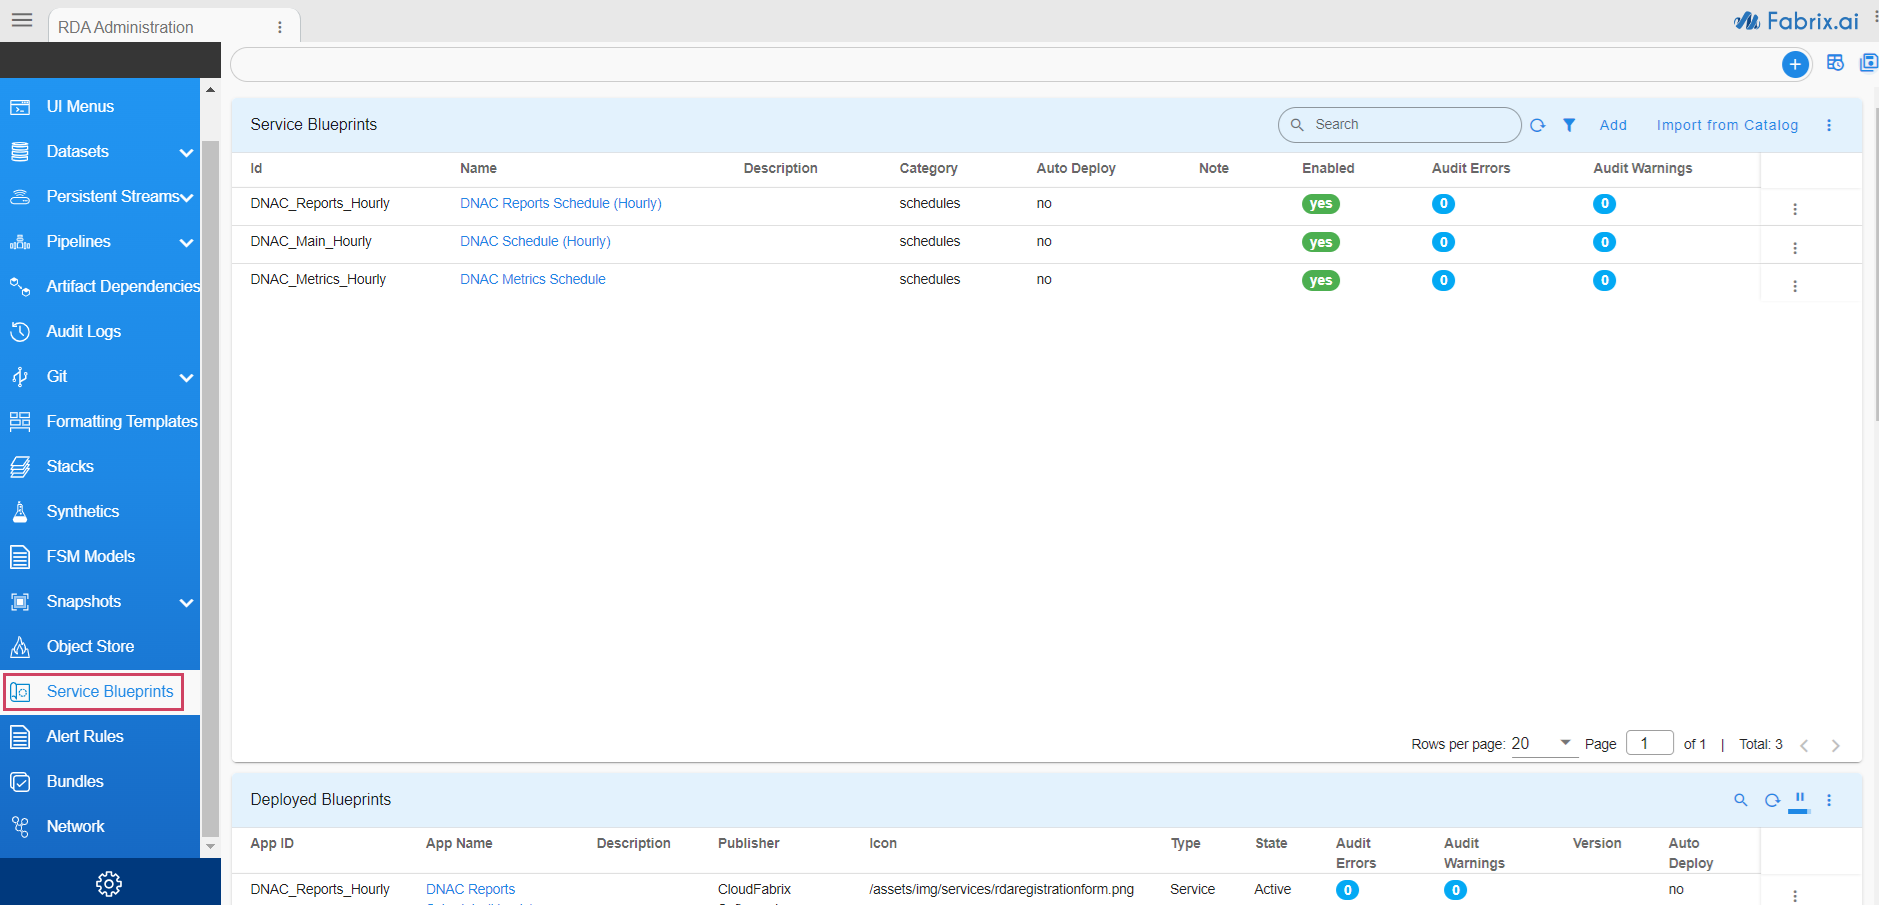
Use Add action to copy paste following blueprint:
It may take few seconds for the Blueprint to be imported. Click Refresh on the on the report and search for guide to look for our blueprint.
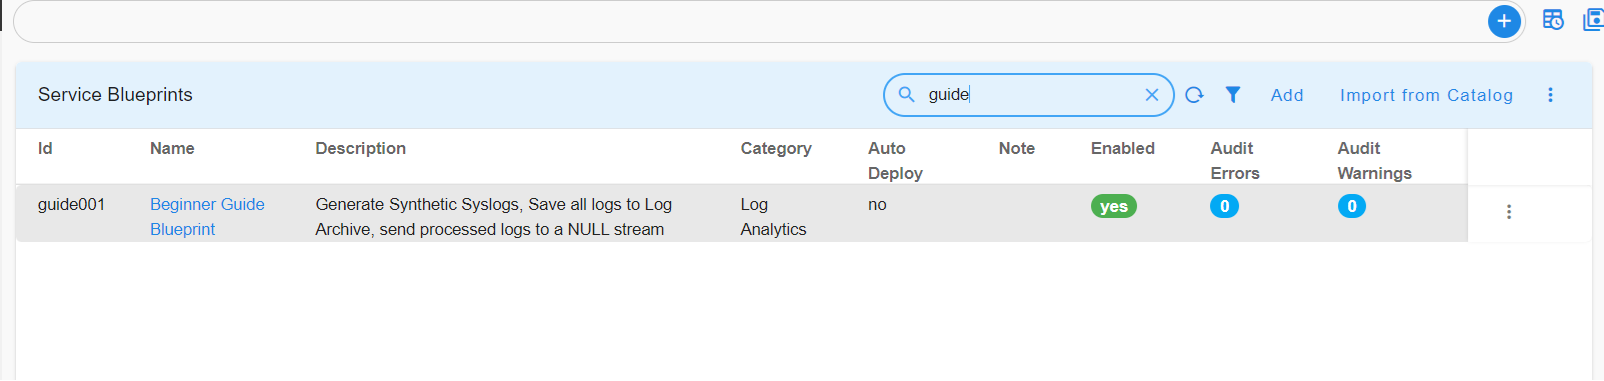
If the Audit Errors and Audit Warnings show zeros, it means we have successfully imported.
15. Understanding service blueprint details dashboard
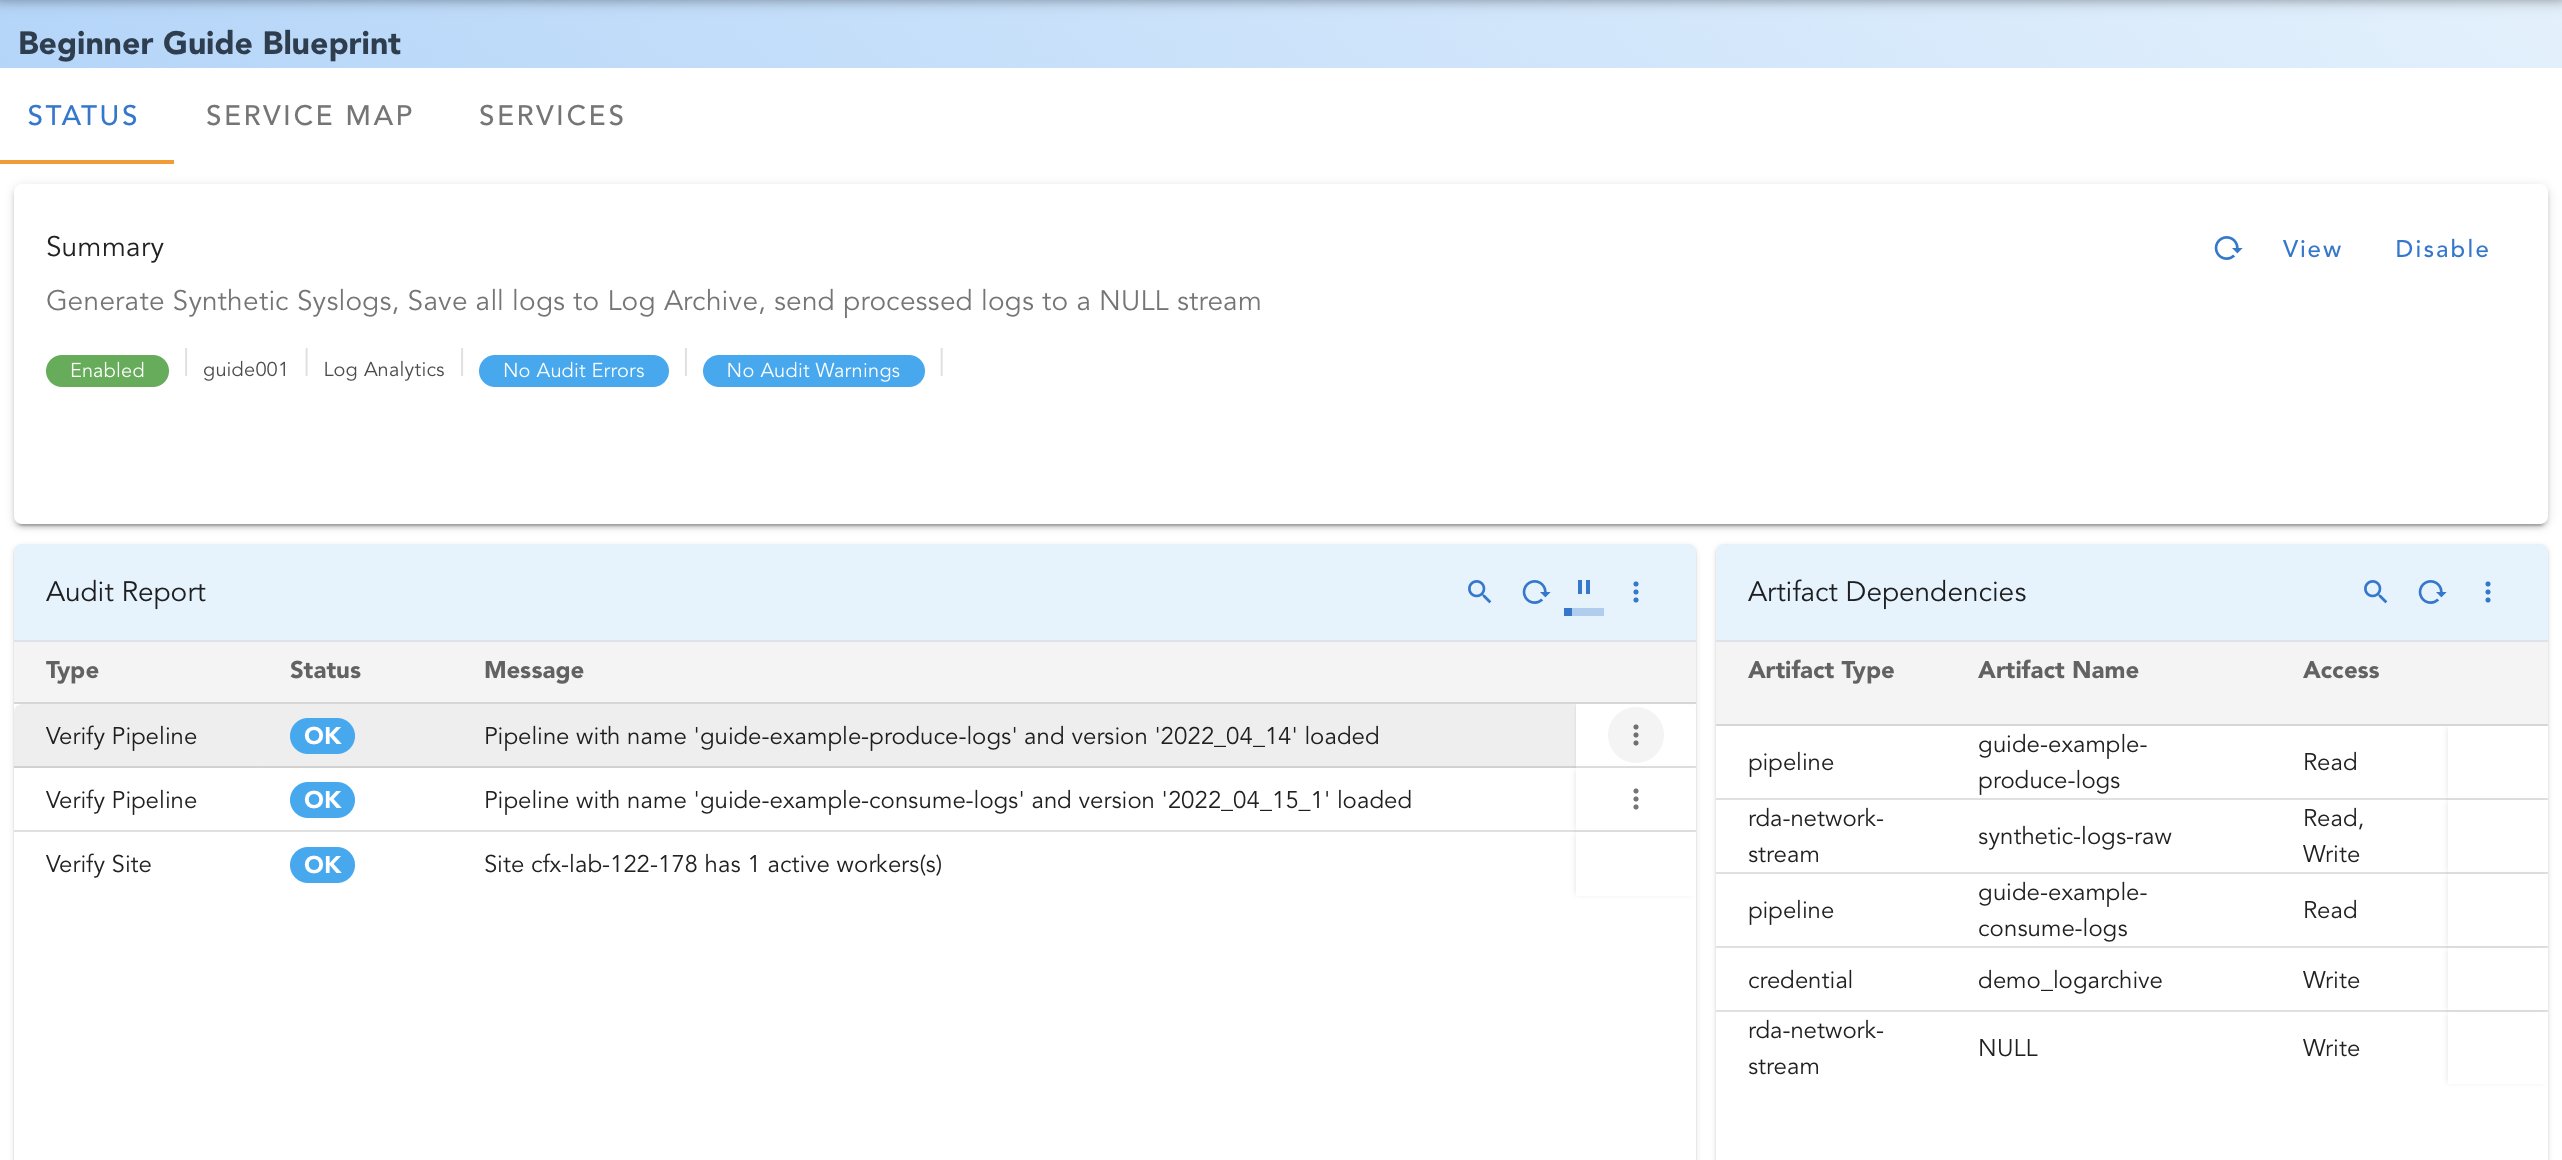
When you Click on the example Beginner Guide Blueprint, it would look something like this:
1. STATUS
-
Summary Report: This report shows current status of the blueprint and number of audit errors/ warnings. You can see YAML text of the blueprint by clicking 'View'. Blueprint can be Enabled / Disabled from this report.
-
Audit Report: Shows list of audit checks performed and their status. If there were any errors or warnings, they can be remediated by clicking on the pop-up action for each row.
-
Artifact Dependencies: Show list of various artifacts consumed / produced by this blueprint.
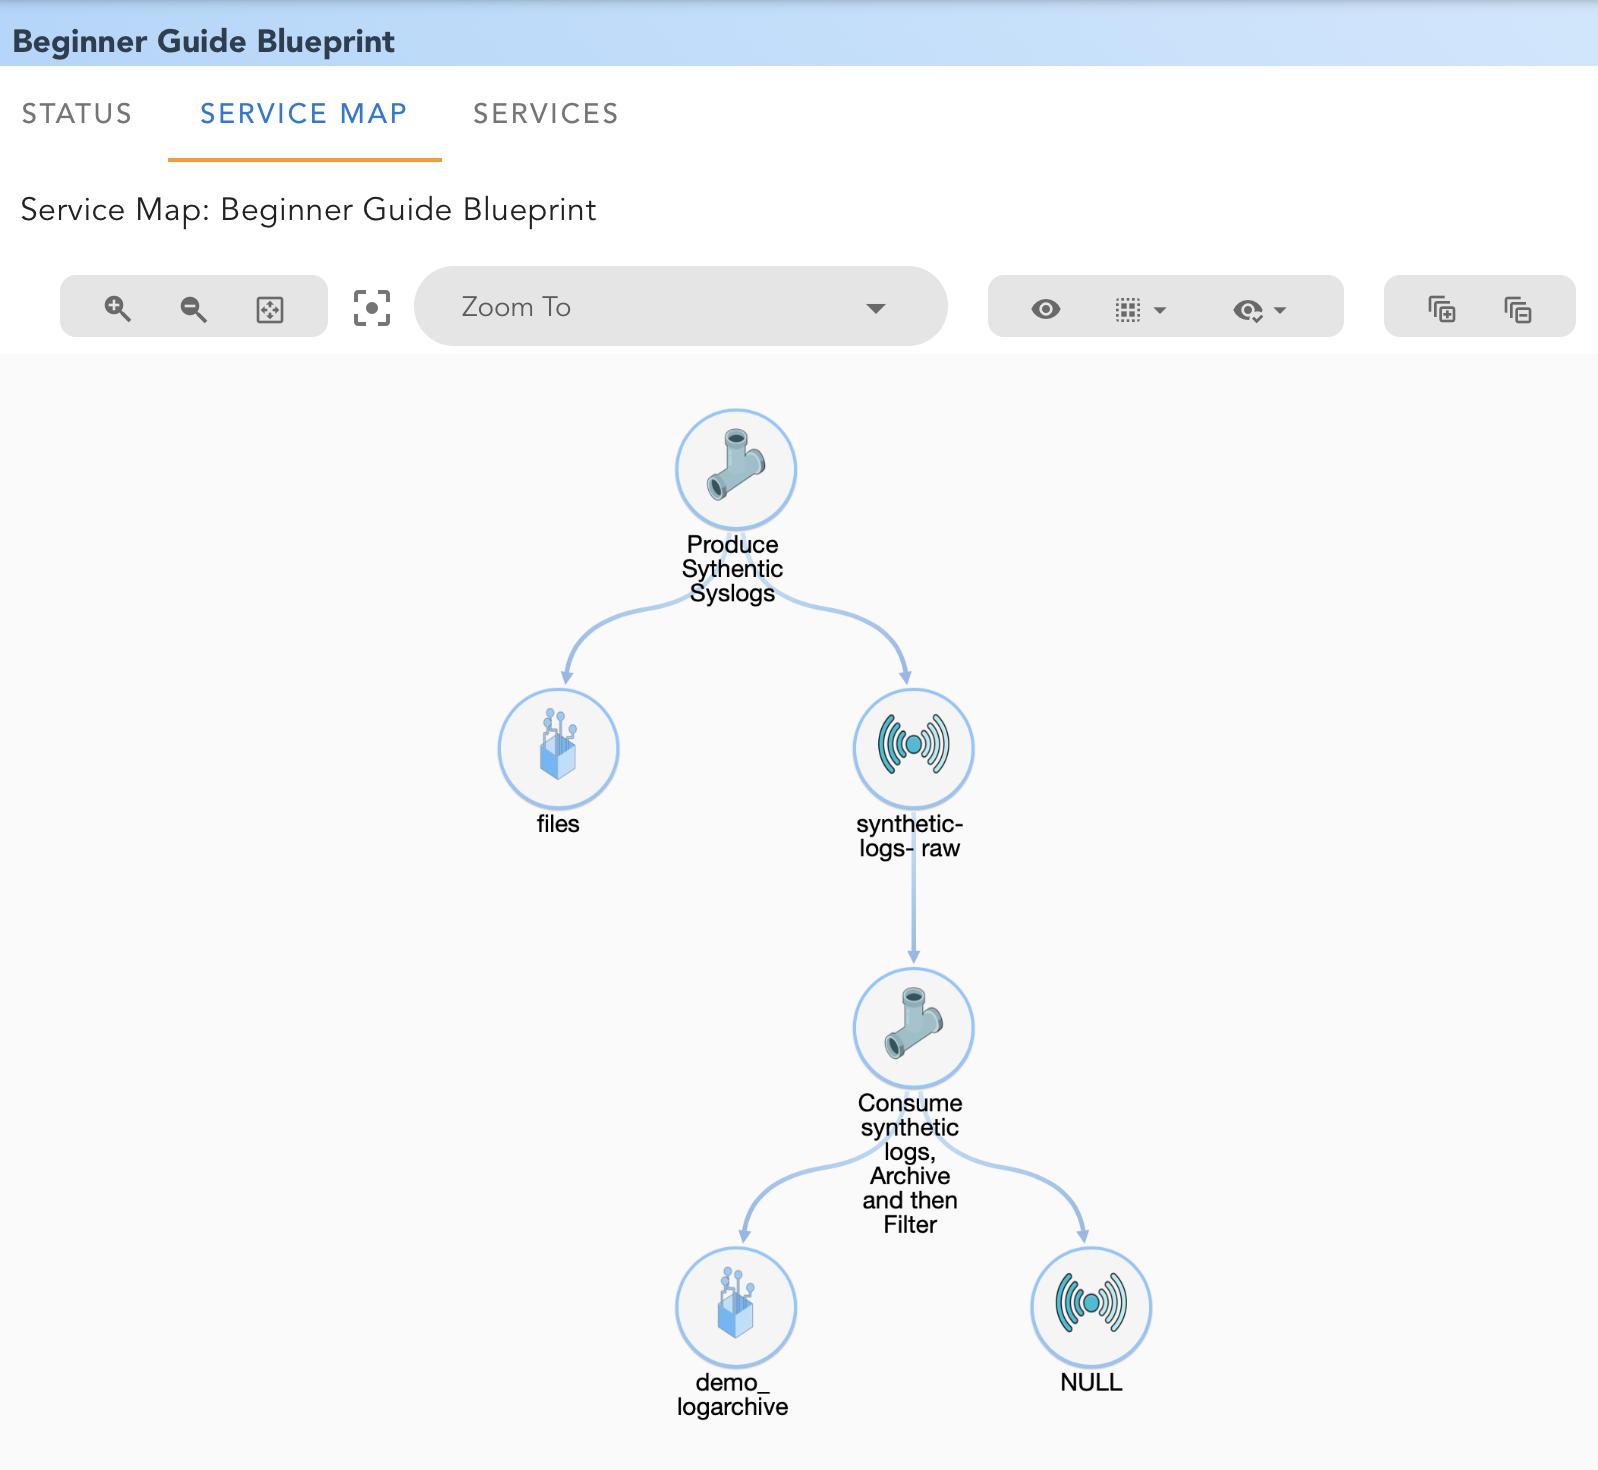
2. SERVICE MAP
RDAF automatically analyzes the blueprint and all related artifacts, and creates a visual map of the Service and possible interaction between various pipelines, data sources and destinations.
For our example service, the service map would look like this:
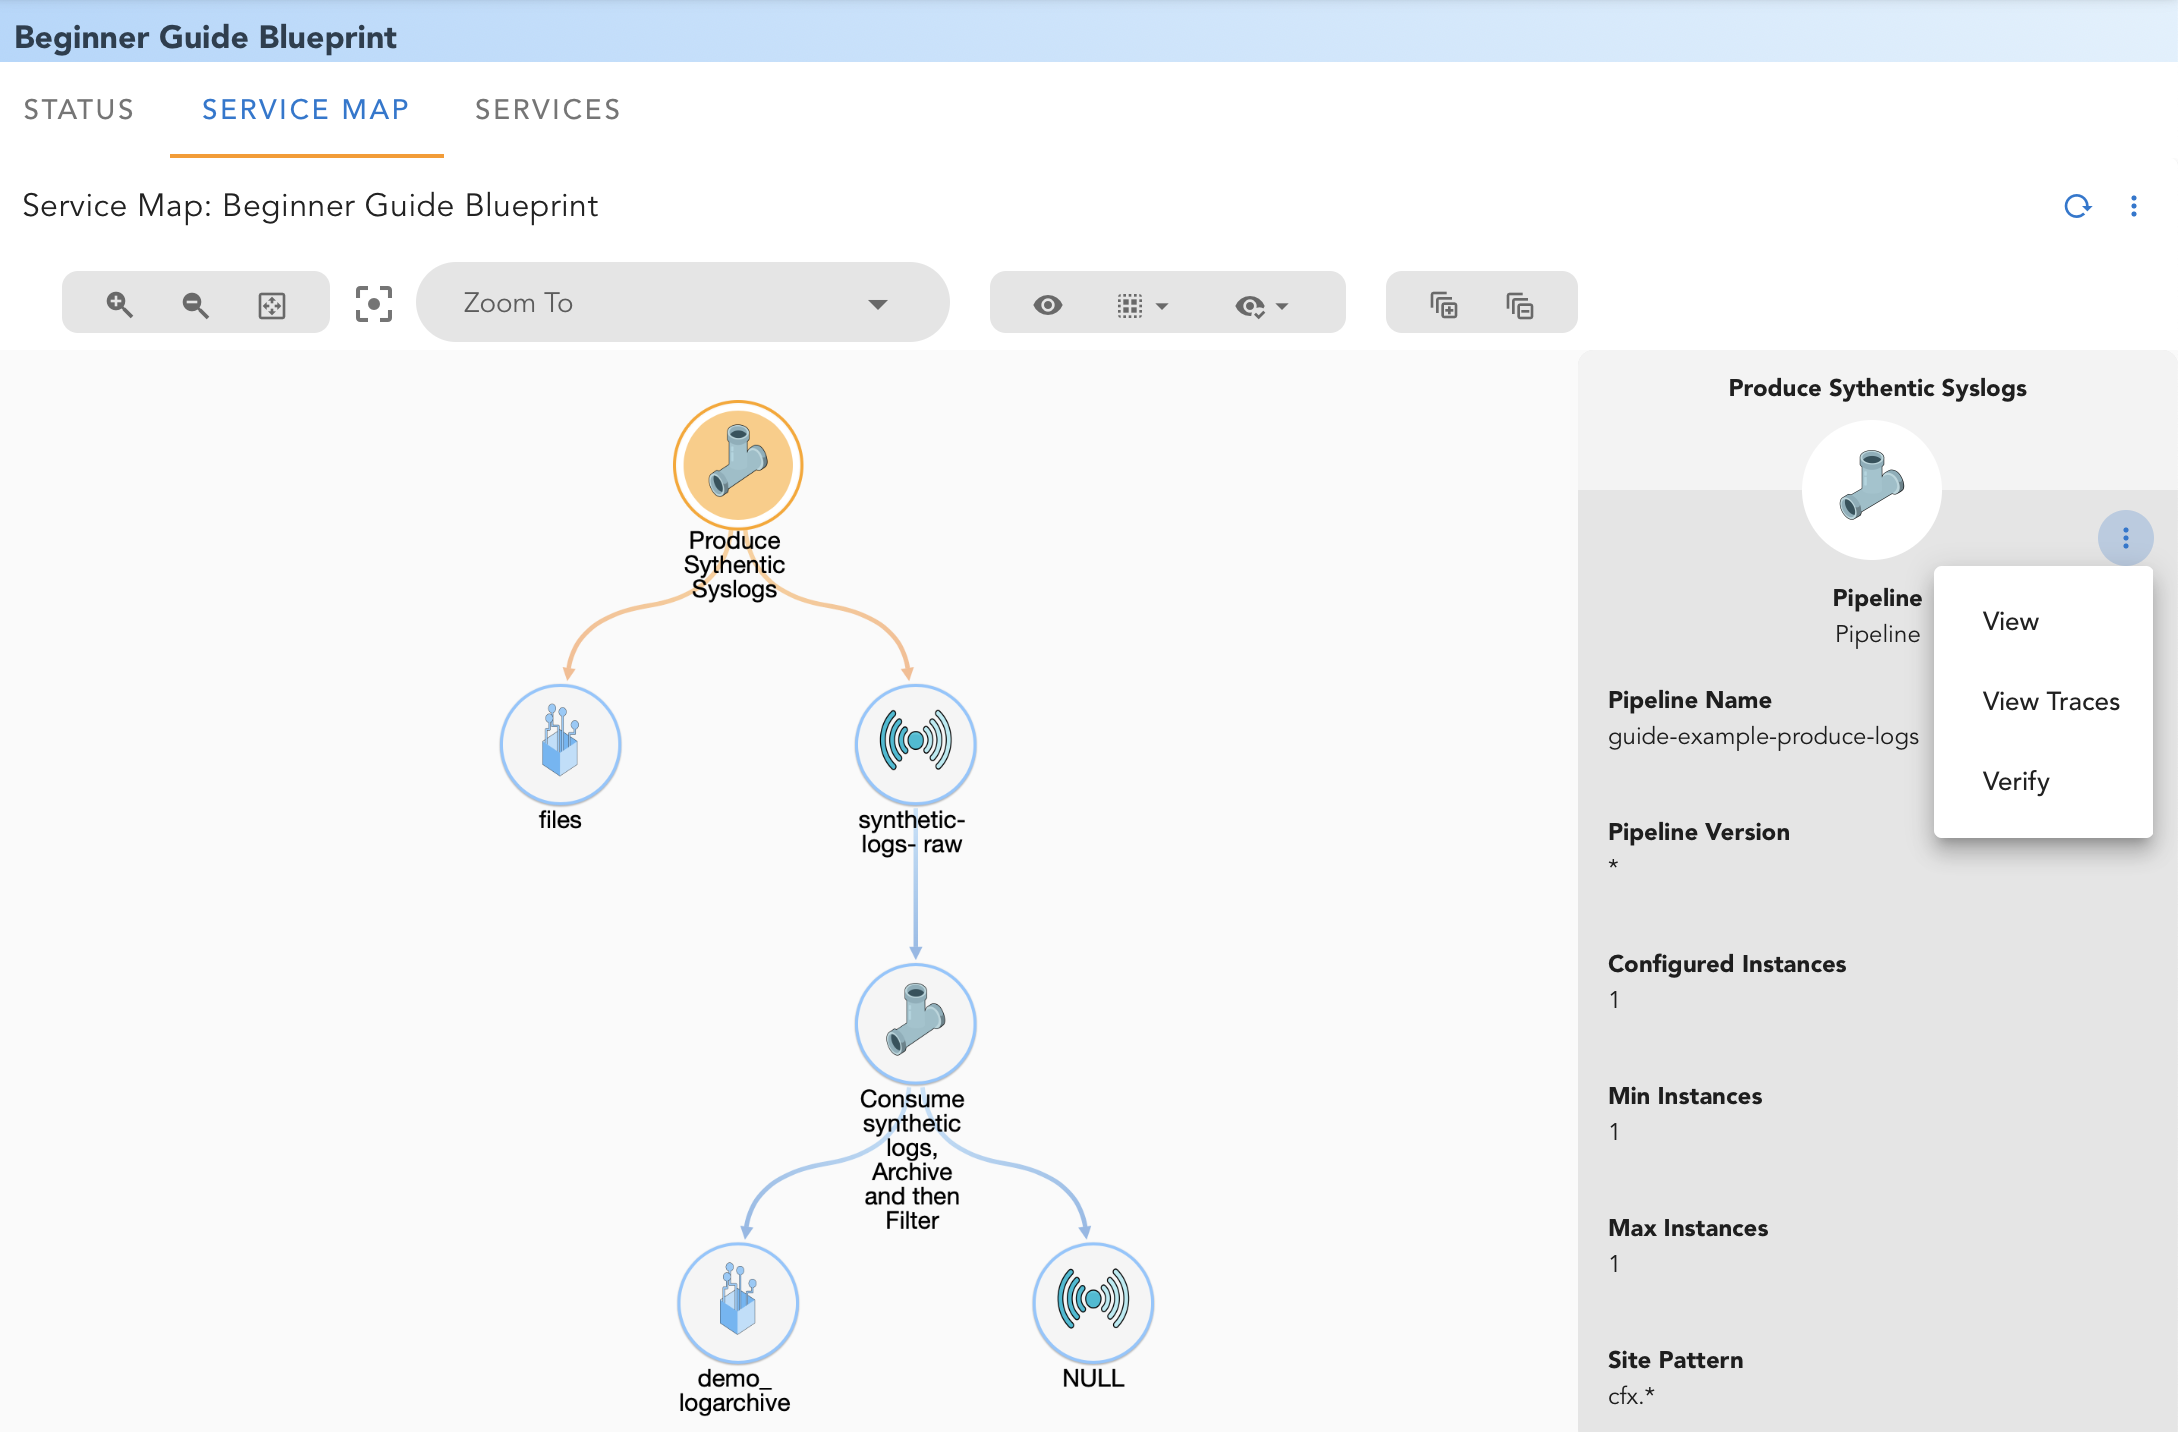
By selecting a pipeline or any other artifact, you can view additional details:
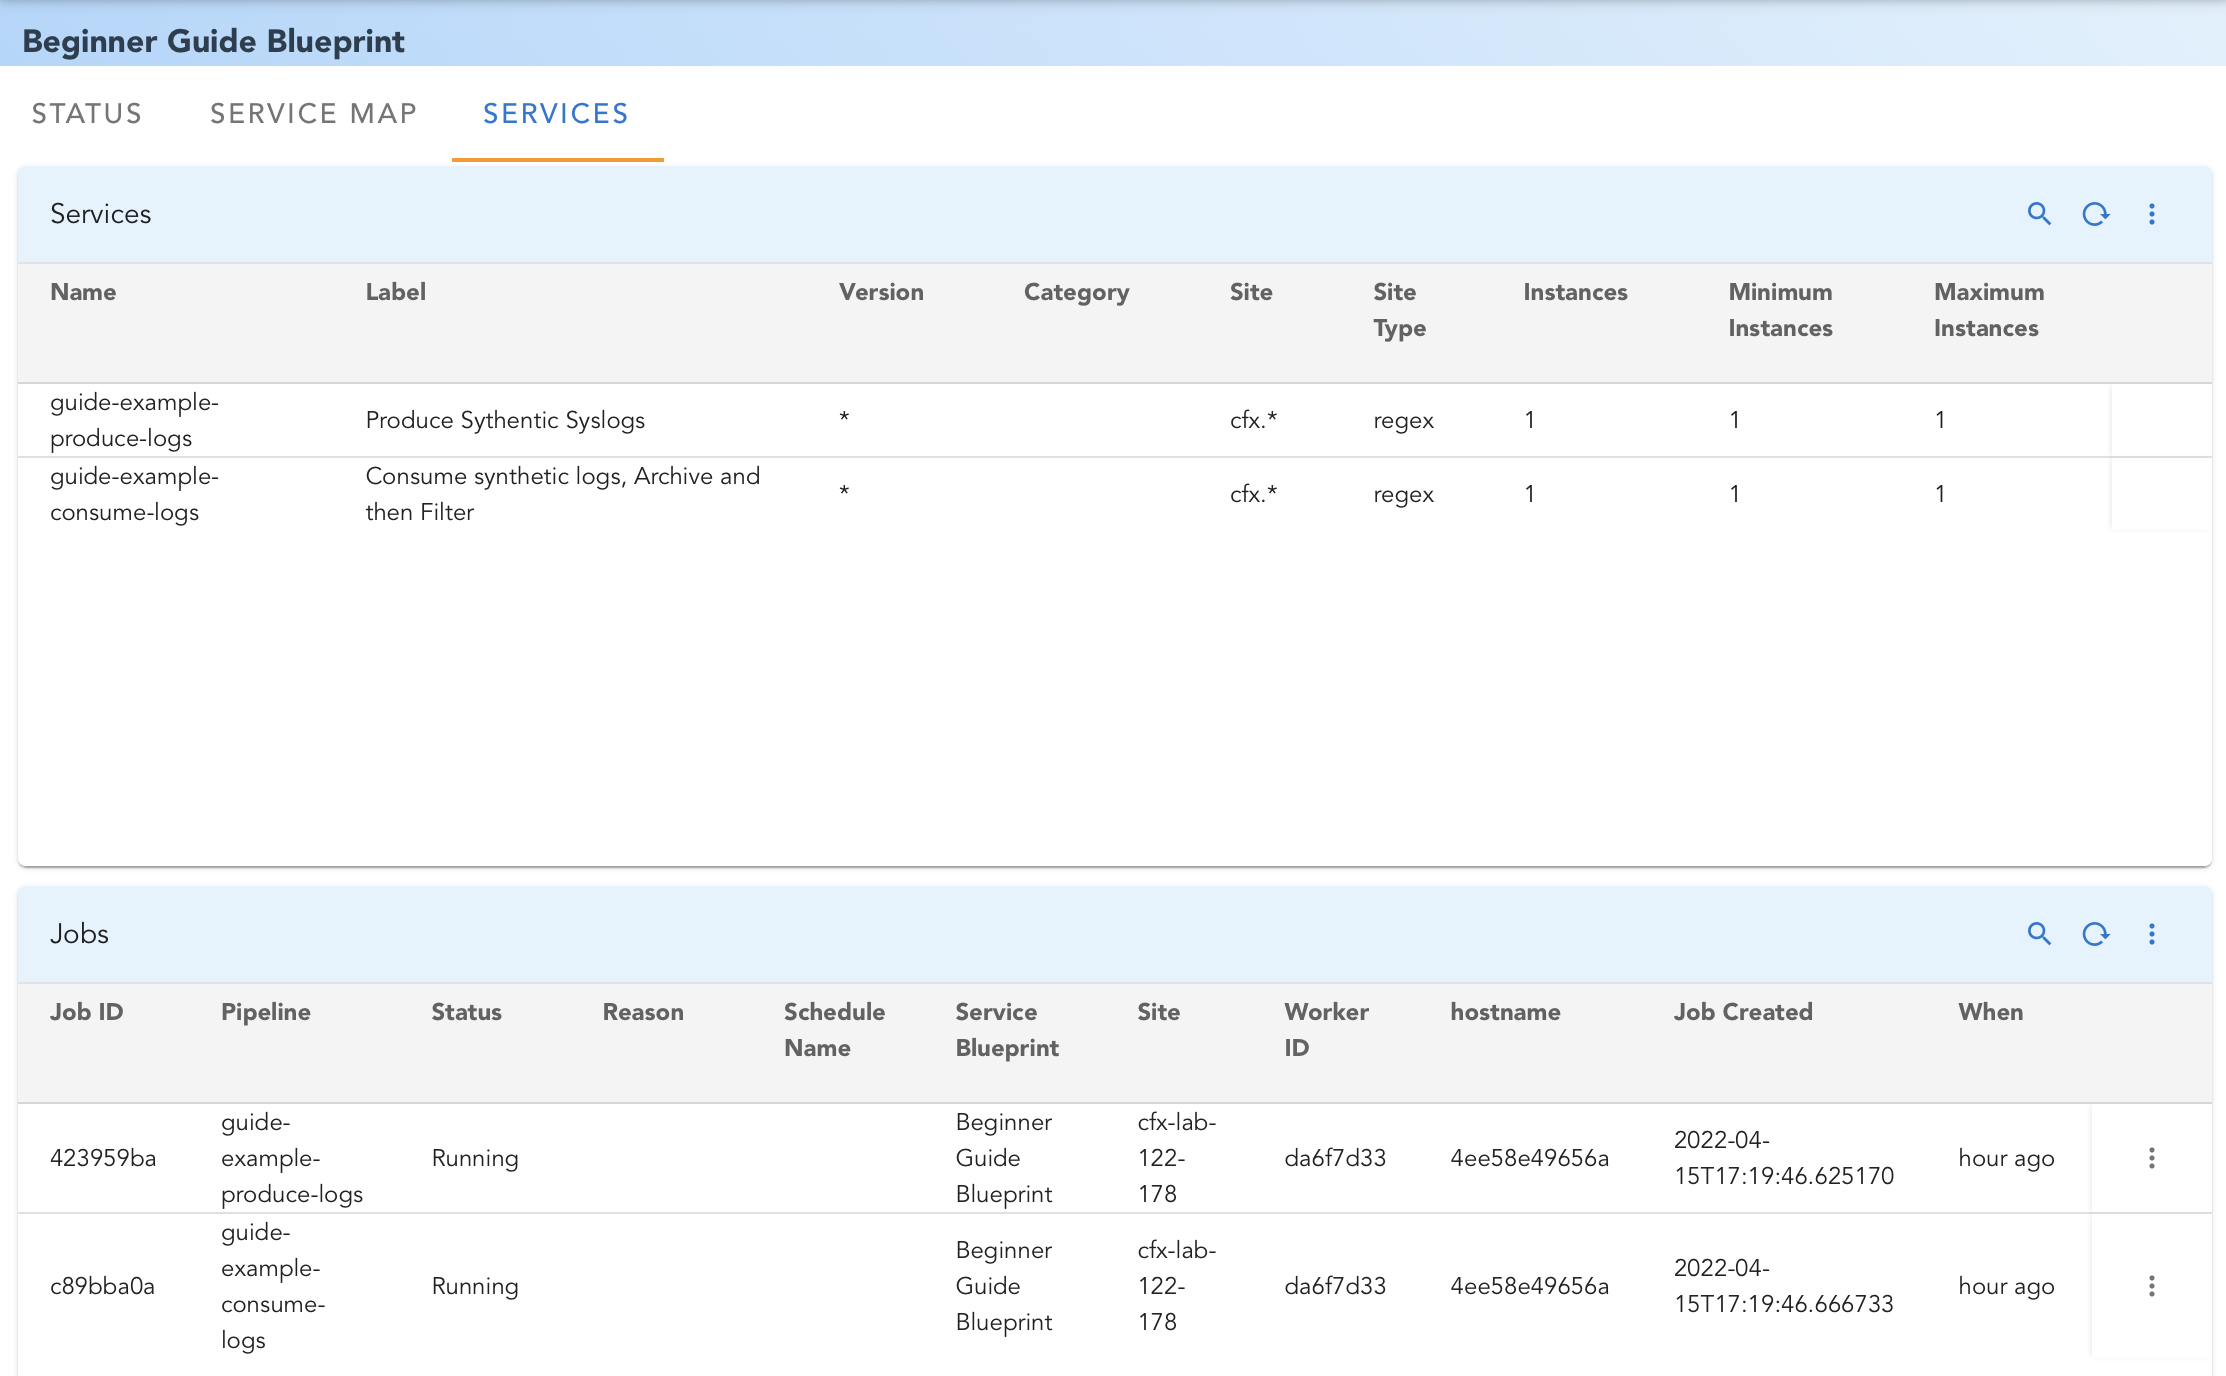
3. SERVICES:
This tab shows current status of all Service Pipelines in the blueprint. Screenshot below shows typical status for our example blueprint:
16. Deploy External Opensearch and Switching Streams From Platform To External Opensearch
This Section contains information on the Switching streams from Platform Opensearch To External Opensearch
1.Prerequisites
Note
From Section 1 To Section 1.1.3 comes under prerequisites
Use the latest tags
Below are the pre-requisites which must be met before Migrating
-
The certified RDAF Cli Version on VM should be 1.5.1 or Higher
-
The Target Open search nodes must have same Username and Password
-
Please find the below steps for Cli Upgrade
- Download the RDAF Deployment CLI's newer version 1.5.1 bundle
- Upgrade the
rdafCLI to version 1.5.1
- Verify the installed
rdafCLI version is upgraded to 1.5.1
- Download the RDAF Deployment CLI's newer version 1.5.1 bundle and copy it to RDAF management VM on which
rdafdeployment CLI was installed.
- Extract the
rdafCLI software bundle contents
- Change the directory to the extracted directory
- Upgrade the
rdafCLI to version 1.5.1
- Verify the installed
rdafCLI version
1.1 External Opensearch Setup (Standalone or HA Cluster)
1.1.1 RDAF CLI Usage for External Opensearch
- Please use the below mentioned command for RDAF CLI Usage for External Opensearch
usage: opensearch_external [-h] [--debug] {} ...

Manage the Opensearch External

positional arguments:
 {}          commands
  setup        Setup Opensearch External
  add-opensearch-external-host
            Add extra opensearch external vm
  install       Install the RDAF opensearch_external containers
  status       Status of the RDAF opensearch_external Component
  upgrade       Upgrade the RDAF opensearch_external Component
  start        Start the RDAF opensearch_external Component
  stop        Stop the RDAF opensearch_external Component
  down        Start the RDAF opensearch_external Component
  up         Stop the RDAF opensearch_external Component
  reset        Reset the Opensearch External Component

optional arguments:
 -h, --help      show this help message and exit
 --debug        Enable debug logs for the CLI operations
rdauser@infra-93:~$
- Please use the below mentioned command for External opensearch setup using RDAF CLI
rdauser@infra13340:~$ rdaf opensearch_external setup
What is the SSH password for the SSH user used to communicate between hosts
SSH password:
Re-enter SSH password:
What is the host(s) for cluster manager?
opensearch cluster manager host(s)[]: 192.168.102.69
What is the host(s) for cluster clients?
opensearch cluster client host(s)[]: 192.168.102.69
Do you want to configure cluster zoning? [yes/No]: No
What is the host(s) for data nodes?
opensearch cluster data host(s)[]: 192.168.102.69
What is the user name you want to give for opensearch cluster admin user that will be created and used by the RDAF platform?
opensearch user[rdafadmin]:
What is the password you want to use for opensearch admin user?
opensearch password[7XvJqlSxTd]:
Re-enter opensearch password[7XvJqlSxTd]:
2024-11-29 04:11:02,810 [rdaf.component.opensearch_external] INFO     - Doing setup for opensearch_external
2024-11-29 04:11:14,079 [rdaf.component.opensearch_external] INFO     - Created opensearch external configuration at /opt/rdaf/config/opensearch_external/opensearch.yaml on 192.168.102.69
[+] Pulling 11/1149,181 [rdaf.component] INFO     -
✔ opensearch Pulled                                                      31.4s
✔ b741dbbfb498 Pull complete                                            7.8s
✔ 9b98b52b7e47 Pull complete                                            8.4s
✔ 15f0f9977346 Pull complete                                            8.5s
✔ 3ad72b8a8518 Pull complete                                           31.1s
✔ 4f4fb700ef54 Pull complete                                           31.1s
✔ 98cabfd2ffca Pull complete                                           31.2s
✔ c81b98a60c3f Pull complete                                           31.2s
✔ 3cd896096cca Pull complete                                           31.2s
✔ bb771aa5679e Pull complete                                           31.2s
✔ acea08536baf Pull complete                                           31.3s
2024-11-29 04:12:01,121 [rdaf.component.opensearch_external] INFO     - Setup completed successfully
rdauser@infra13340:~$
rdauser@infra13340:~$ rdaf opensearch_external setup
What is the SSH password for the SSH user used to communicate between hosts
SSH password:
Re-enter SSH password:
What is the host(s) for cluster manager?
opensearch cluster manager host(s)[]: 192.168.121.202,192.168.121.203,192.168.121.204
What is the host(s) for cluster clients?
opensearch cluster client host(s)[]: 192.168.121.202,192.168.121.203,192.168.121.204
Do you want to configure cluster zoning? [yes/No]: No
What is the host(s) for data nodes?
opensearch cluster data host(s)[]: 192.168.121.202,192.168.121.203,192.168.121.204
What is the user name you want to give for opensearch cluster admin user that will be created and used by the RDAF platform?
opensearch user[rdafadmin]:
What is the password you want to use for opensearch admin user?
opensearch password[7XvJqlSxTd]:
Re-enter opensearch password[7XvJqlSxTd]:
2024-11-29 04:11:02,810 [rdaf.component.opensearch_external] INFO     - Doing setup for opensearch_external
2024-11-29 04:11:14,079 [rdaf.component.opensearch_external] INFO     - Created opensearch external configuration at /opt/rdaf/config/opensearch_external/opensearch.yaml on 192.168.133.46
2024-11-29 04:11:14,410 [rdaf.component.opensearch_external] INFO     - Created opensearch external configuration at /opt/rdaf/config/opensearch_external/opensearch.yaml on 192.168.133.47
2024-11-29 04:11:14,766 [rdaf.component.opensearch_external] INFO     - Created opensearch external configuration at /opt/rdaf/config/opensearch_external/opensearch.yaml on 192.168.133.48
[+] Pulling 11/1149,181 [rdaf.component] INFO     -
✔ opensearch Pulled                                                      31.4s
✔ b741dbbfb498 Pull complete                                            7.8s
✔ 9b98b52b7e47 Pull complete                                            8.4s
✔ 15f0f9977346 Pull complete                                            8.5s
✔ 3ad72b8a8518 Pull complete                                           31.1s
✔ 4f4fb700ef54 Pull complete                                           31.1s
✔ 98cabfd2ffca Pull complete                                           31.2s
✔ c81b98a60c3f Pull complete                                           31.2s
✔ 3cd896096cca Pull complete                                           31.2s
✔ bb771aa5679e Pull complete                                           31.2s
✔ acea08536baf Pull complete                                           31.3s
2024-11-29 04:12:01,121 [rdaf.component.opensearch_external] INFO     - Setup completed successfully
rdauser@infra13340:~$
rdauser@pslautox1plreg01:~$ rdaf opensearch_external setup
What is the SSH password for the SSH user used to communicate between hosts
SSH password:
Re-enter SSH password:
What is the host(s) for cluster manager?
opensearch cluster manager host(s)[]: 192.168.230.81,192.168.230.82,192.168.230.83
What is the host(s) for cluster clients?
opensearch cluster client host(s)[]: 192.168.230.81,192.168.230.82,192.168.230.83
Do you want to configure cluster zoning? [yes/No]: yes
Please specify the number of zones to be configured
Number of Zones[2]: 3
What is the host(s) for data nodes in zone-0?
opensearch cluster data host(s) for zone-0[]: 192.168.230.84
What is the host(s) for data nodes in zone-1?
opensearch cluster data host(s) for zone-1[]: 192.168.230.85
What is the host(s) for data nodes in zone-2?
opensearch cluster data host(s) for zone-2[]: 192.168.230.86
What is the user name you want to give for opensearch cluster admin user that will be created and used by the RDAF platform?
opensearch user[rdafadmin]:
What is the password you want to use for opensearch admin user?
opensearch password[VV5Bk4nbB1]:
Re-enter opensearch password[VV5Bk4nbB1]:
2025-02-24 18:49:42,394 [rdaf.component.opensearch_external] INFO     - Doing setup for opensearch_external
Step 1. Create a JSON file named os_external.json with the following structure
{
"cluster-manager-host": ["<list of cluster manager hosts>"],
"client-host": ["<list of client hosts>"],
"data-host": ["<list of data hosts>"],
"os-zoning": true/false,
"zones": {
    "zone-0": ["<host IPs>"],
    "zone-1": ["<host IPs>"],
    "zone-2": ["<host IPs>"]
},
"os-external-admin-user": "<admin username>",
"os-external-admin-password": "<admin password>",
"ssh_password": "<ssh password>",
"ssh_user": "<ssh username>",
"no_prompt": true/false
}
Note
Adjust the values as per your environment, especially the host IPs and credentials.
Step 2. Execute the setup command using the configuration file
Step 3. The setup output will display progress messages, such as copying SSH keys, creating directories, and provisioning containers. For example
2025-08-25 06:49:03,712 [rdaf.component.opensearch_external] INFO - Doing setup for opensearch_external
...
2025-08-25 06:49:49,315 [rdaf.component.opensearch_external] INFO - Setup completed successfully
Step 4. After completion, verify the status using the below given command.
+---------------------+-----------------+-----------------+--------------+-----+
| Name                | Host            | Status          | Container Id | Tag |
+---------------------+-----------------+-----------------+--------------+-----+
| opensearch_external | 192.168.107.187 | Not Provisioned | N/A          | N/A |
| opensearch_external | 192.168.107.188 | Not Provisioned | N/A          | N/A |
| opensearch_external | 192.168.107.189 | Not Provisioned | N/A          | N/A |
+---------------------+-----------------+-----------------+--------------+-----+
Step 1. Create a JSON file named os_external_wo_zoning.json with the following structure.
{
"cluster-manager-host": ["192.168.107.187", "192.168.107.188", "192.168.107.189"],
"client-host": ["192.168.107.187", "192.168.107.188", "192.168.107.189"],
"data-host": ["192.168.107.187", "192.168.107.188", "192.168.107.189"],
"os-zoning": false,
"os-external-admin-user": "rdafadmin",
"os-external-admin-password": "admin1234",
"ssh_password": "rdauser1234",
"ssh_user": "rdauser",
"no_prompt": true
}
Step 3. The output will include logs similar to
2025-09-01 02:45:35,982 [rdaf.component.opensearch_external] INFO - Doing setup for opensearch_external
...
2025-09-01 02:46:13,717 [rdaf.component.opensearch_external] INFO - Setup completed successfully
Step 4. After setup completes, verify the status using the following command.
+---------------------+-----------------+-----------------+--------------+-----+
| Name                | Host            | Status          | Container Id | Tag |
+---------------------+-----------------+-----------------+--------------+-----+
| opensearch_external | 192.168.107.187 | Not Provisioned | N/A          | N/A |
| opensearch_external | 192.168.107.188 | Not Provisioned | N/A          | N/A |
| opensearch_external | 192.168.107.189 | Not Provisioned | N/A          | N/A |
+---------------------+-----------------+-----------------+--------------+-----+
1.1.3 External opensearch Install using RDAF CLI
- Please use the below mentioned command for External opensearch Installation using RDAF CLI
rdauser@primary180:~$ rdaf opensearch_external install --tag 1.0.4.1
2024-12-03 04:54:48,530 [rdaf.component] INFO     - Pulling opensearch_external images on host 192.168.107.187
2024-12-03 04:54:48,918 [rdaf.component] INFO     - 1.0.4.1: Pulling from internal/rda-platform-opensearch
Digest: sha256:fc0c794872425d40b28549f254a4a4c79813960d4c4d1491a29a4cd955953983
Status: Image is up to date for docker1.cloudfabrix.io:443/internal/rda-platform-opensearch:1.0.4.1
docker1.cloudfabrix.io:443/internal/rda-platform-opensearch:1.0.4.1
2024-12-03 04:54:48,920 [rdaf.component] INFO     - Pulling opensearch_external images on host 192.168.107.188
2024-12-03 04:54:49,344 [rdaf.component] INFO     - 1.0.4.1: Pulling from internal/rda-platform-opensearch
Digest: sha256:fc0c794872425d40b28549f254a4a4c79813960d4c4d1491a29a4cd955953983
Status: Image is up to date for docker1.cloudfabrix.io:443/internal/rda-platform-opensearch:1.0.4.1
docker1.cloudfabrix.io:443/internal/rda-platform-opensearch:1.0.4.1
2024-12-03 04:54:49,346 [rdaf.component] INFO     - Pulling opensearch_external images on host 192.168.107.189
2024-12-03 04:54:49,741 [rdaf.component] INFO     - 1.0.4.1: Pulling from internal/rda-platform-opensearch
Digest: sha256:fc0c794872425d40b28549f254a4a4c79813960d4c4d1491a29a4cd955953983
Status: Image is up to date for docker1.cloudfabrix.io:443/internal/rda-platform-opensearch:1.0.4.1
docker1.cloudfabrix.io:443/internal/rda-platform-opensearch:1.0.4.1
[+] Running 1/14:51,842 [rdaf.component] INFO     -
 ✔ Container os_external-opensearch_external-1  Started                    0.2s
[+] Running 1/14:52,804 [rdaf.component] INFO     -
 ✔ Container os_external-opensearch_external-1  Started                    0.3s
[+] Running 1/14:53,676 [rdaf.component] INFO     -
 ✔ Container os_external-opensearch_external-1  Started                    0.2s
2024-12-03 04:54:53,688 [rdaf.component.opensearch_external] INFO     - Updating config.json with os_external endpoint.
2024-12-03 04:54:53,691 [rdaf.component.platform] INFO     - Creating directory /opt/rdaf/config/network_config
2024-12-03 04:54:54,238 [rdaf.component.platform] INFO     - Creating directory /opt/rdaf/config/network_config
2024-12-03 04:54:54,805 [rdaf.component.platform] INFO     - Creating directory /opt/rdaf/config/network_config
2024-12-03 04:54:55,358 [rdaf.component.platform] INFO     - Creating directory /opt/rdaf/config/network_config
2024-12-03 04:54:56,002 [rdaf.component.opensearch_external] INFO     - Updating policy.json with os_external endpoint.
rdauser@primary180:~$
opensearch.yaml in the following path cd /opt/rdaf/config/opensearch
Note
The user must follow the instructions given below and restart the External OpenSearch Container in order to migrate data using Reindex. If not please disregard these instructions.
- Example Configuration in
Opensearch.yaml
reindex.remote.allowlist: ["192.168.107.110:9200","192.168.109.50:9200"]
reindex.remote.whitelist: ["192.168.107.110:9200","192.168.109.50:9200"]
reindex.ssl.verification_mode: none
- reindex.remote.allowlist : Provide comma seperated Platform opensearch Node Ips and port
- reindex.remote.whitelist : Provide comma seperated Platform opensearch Node Ips and port
- reindex.ssl.verification_mode : It should be none
- The following command can be used to Stop External Opensearch nodes
- The following command can be used to Start External Opensearch nodes
2. Verification
2.1 Verification of os_external Section in rdaf.cfg
This Section shows how os_external section can be verified in rdaf.cfg file
2.2 Verification of os_external in config.json File
This Section shows how os_external section can be verified in config.json file
 "os_external": {
        "hosts": [
            "192.168.102.69"
        ],
        "port": 9200,
        "scheme": "https",
        "ssl_verify": false,
        "$user": "eyJzYWx0IjogIkRwVkYiLCAiZGF0YSI6ICJnQUFBQUFCbVI3YTN3ZnNmNTdkRGIzMXNMT2hFM213dHRldWhUVEY0ZmxrLUxVdmZDSlNaVExPRXZWLTZTZlBvQjlPVVFCUjlUZmFwYjRUN0d6SXY2QWVkSXJWSHlFV011QT09In0=",
        "$password": "eyJzYWx0IjogImFrTHoiLCAiZGF0YSI6ICJnQUFBQUFCbVI3YTM1aU1OZUFHNHE3WmRPVTBhV25YRy1QMEk4SUdCYTZMVlRsWVVnZndJTFJ4dXExcmthcGo2VmtWSE9ZRXdPUEJ1YWxuV2VSVkE3bGprSG9oMXc1UmM3UT09In0="
    }
Note
Verification Step: The above cat command spits the above content (in json format) and is expected to have one os_external elements as highlighted in yellow color in the above example.
2.3 Verification of pstream-mappings in policy.json File
This Section shows how pstream-mappings can be verified in policy.json file
{
    "pstream-mappings": [
        {
            "pattern": "admin-90915a066fd14c3ea8d828e7aa7fde27.*",
            "es_name": "cfx_admin_es",
            "tenant_specific": true
        },
        {
            "pattern": "rda.*",
            "es_name": "default"
        },
        {
            "pattern": "os-external-admin-90915a066fd14c3ea8d828e7aa7fde27.*",
            "es_name": "os_external_default"
        },
        {
            "pattern": "os-external-rda.*",
            "es_name": "os_external_default"
        },
        {
            "pattern": "os-external-.*",
            "es_name": "os_external_default"
        },
    {
            "pattern": ".*",
            "es_name": "default"
        }
    ],
    "credentials": {
        "es": {
            "cfx_admin_es": {
                "hosts": [
                    "192.168.125.217"
                ],
                "port": "9200",
                "user": "90915a066fd14c3ea8d828e7aa7fde27adminuser",
                "password": "LtcgfYK5L1",
                "scheme": "https",
                "ssl_verify": false
            },
            "os_external_default": {
                "hosts": [
                    "192.168.102.69"
                ],
                "user": "xxxxxx",
                "password": "xxxxxx",
                "port": "9200",
                "scheme": "https",
                "ssl_verify": false
            }
        }
    }
}
Note
Verification Step: The above cat command splits the above content (in json format) and is expected to have lines which are highlighted in Yellow as shown in the above example outpput
3. Collector Service Restart
Restart the collector service whenever external opensearch is added.
+---------------------+-----------------+------------------+--------------+------------+
| rda_collector       | 192.168.107.125 | Up 5 minutes     | 484a115a4852 | 8.2        |
+---------------------+-----------------+------------------+--------------+------------+
4. Api-Server Service Restart
Before upgrading the platform services, restart the api-server whenever External OpenSearch is added.
+---------------------+-----------------+------------------+--------------+------------+
| rda_api_server      | 192.168.107.125 | Up 5 minutes     | a4852484a115 | 8.2        |
+---------------------+-----------------+------------------+--------------+------------+
Note
If the user has completed the OpenSearch Extended configuration before upgrading the API Server, then skip this step.
5. Creation of Pstream using External Opensearch
Warning
The following sections 5.1 and 5.2 must be completed in order, any delays could result in data loss.
The following showcases how to switch a platform based Pstream (ex. syslog_udp_event_stream) to External Opensearch
5.1 Delete Existing Pstream Name That Needs to be Moved to External OS
Delete the Pstream syslog_udp_event_stream which is using default opensearch from the UI
-
Navigation Path : Home -> Configuration -> RDA Administration -> Persistent Streams -> Select the stream (syslog_udp_event_stream)
-
Make a note of the value from the column Index/Table Name corresponding to the above
syslog_udp_event_stream.
- Navigation Path : Home -> Configuration -> RDA Administration -> Persistent Streams -> Select stream actions → Delete
Important
Do not select the check box “It would delete all the data (Unrecoverable)”
5.2 Create a Pstream using External Opensearch
Note
If the data is for large pstreams used for Metrics, Logs and Events Data (which typically takes up 20GB+ space). It is recommended to use ISM based PStreams. Please refer to ISM Based pstreams
Create Pstream using external opensearch from RDAF UI
Create a new pstream with the same name syslog_udp_event_stream that we deleted in the above step with attributes as shown below
-
Navigation Path : Home -> Configuration -> RDA Administration -> Persistent Streams -> Add
-
Make a note of the value from the column Index/Table Name corresponding to the above
syslog_udp_event_stream.
External Opensearch
A new pstream is created identical to [label-1] with the prefix os-external
default “Index/Table Name” value is [label-1] for local OpenSearch.
       90915a066fd14c3ea8d828e7aa7fde27-stream-01faa2b2-syslog_udp_event_stream
Newly created “index/Table Name” in the remote OpenSearch as os-external-[label-1]
       os-external-90915a066fd14c3ea8d828e7aa7fde27-stream-01faa2b2-syslog_udp_event_stream
6. How to Access Old Data
6.1 Create a Stream With Old Index
Create a new stream syslog_udp_event_stream_old using Rdaf Cli VM with the old index name
rdac pstream add --name syslog_udp_event_stream_old --index 90915a066fd14c3ea8d828e7aa7fde27-stream-01faa2b2-syslog_udp_event_stream
User should now be able to view the old data using syslog_udp_event_stream_old stream
7. Migrating the Data Using Reindex
The steps mentioned below must be followed if the user wishes to migrate data from an older index to an external OpenSearch index.
Login to the External opensearch nodes and update opensearch.yaml in the following path cd /opt/rdaf/config/opensearch
- Example Configuration in
Opensearch.yaml
reindex.remote.allowlist: ["192.168.107.110:9200","192.168.109.50:9200"]
reindex.remote.whitelist: ["192.168.107.110:9200","192.168.109.50:9200"]
reindex.ssl.verification_mode: none
- reindex.remote.allowlist : Provide comma seperated Platform opensearch Node Ips and port
- reindex.remote.whitelist : Provide comma seperated Platform opensearch Node Ips and port
- reindex.ssl.verification_mode : It should be none
- The following command can be used to Stop External Opensearch nodes
- The following command can be used to Start External Opensearch nodes
-
Now use the Reindex functionality to move data from the Platform Index to the External OS Index.
-
Here's a basic example of how one can structure the reindex request using the Elasticsearch
-
Please run the below mentioned example commands
curl -s -k -X POST -u "externalos_username:externalos_password"  "https://<externalos_ip>:9200/_reindex?wait_for_completion=false"  --insecure -vvv  -H 'Content-Type: application/json' -d'
{
   "source":{
      "remote":{
         "host":"https://<platform-os_ip>:9200",
         "username":"platformos_username",
         "password":"platformos_password"
      },
      "index": "platformos_index or Source_index name"
   },
   "dest":{
      "index": "Externalos_index or destination_index name"
   }
}'
curl -s -k -X POST -u "username:password"  "https://192.168.107.110:9200/_reindex?wait_for_completion=false"  --insecure -vvv  -H 'Content-Type: application/json' -d'
{
   "source":{
      "remote":{
         "host":"https://192.168.109.50:9200",
         "username":"xxxxxx",
         "password":"xxxxxx"
      },
      "index": "90915a066fd14c3ea8d828e7aa7fde27-stream-01faa2b2-syslog_udp_event_stream"
   },
   "dest":{
      "index":"os-external-90915a066fd14c3ea8d828e7aa7fde27-stream-01faa2b2-syslog_udp_event_stream"
   }
}'
Note
User can verify reindex status using task id(user can get this from reindex command output)
rdauser@es-svc:~$ curl -s -k -X POST -u “username:password”  “https://192.168.107.110:9200/_reindex?wait_for_completion=false”  --insecure -vvv  -H ‘Content-Type: application/json’ -d’
{
   “source”:{
      “remote”:{
         “host”:“https://192.168.107.50:9200”,
         “username”:“xxxxxxx”,
         “password”:“xxxxxxx"
      },
      “index”: “90915a066fd14c3ea8d828e7aa7fde27-stream-01faa2b2-syslog_udp_event_stream”
   },
   “dest”:{
      “index”:“os-external-90915a066fd14c3ea8d828e7aa7fde27-stream-01faa2b2-syslog_udp_event_stream”
   }
}'
*   Trying 192.168.107.110:9200...

* Connection #0 to host 192.168.107.110 left intact
{"task":"gLEBVzS7S4eBpUEZ7swY9Q:40252"}
- To verify the reindex status, use the API below by updating the highlighted task ID.
curl -s -k -X GET -u "username:password" "https://192.168.107.110:9200/_tasks/<task id>" --insecure | jq .
{
 "completed": true,
 "task": {
  "node": "gLEBVzS7S4eBpUEZ7swY9Q",
  "id": 40252,
  "type": "transport",
  "action": "indices:data/write/reindex",
  "status": {
   "total": 21333851,
   "updated": 0,
   "created": 21333851,
   "deleted": 0,
   "batches": 21334,
   "version_conflicts": 0,
   "noops": 0,
   "retries": {
    "bulk": 0,
    "search": 0
   },
   "throttled_millis": 0,
   "requests_per_second": -1.0,
   "throttled_until_millis": 0
  },
  "description": "",
  "start_time_in_millis": 1740713226820,
  "running_time_in_nanos": 3225338319601,
  "cancellable": true,
  "cancelled": false,
  "headers": {}
 },
 "response": {
  "took": 3225091,
  "timed_out": false,
  "total": 21333851,
  "updated": 0,
  "created": 21333851,
  "deleted": 0,
  "batches": 21334,
  "version_conflicts": 0,
  "noops": 0,
  "retries": {
   "bulk": 0,
   "search": 0
  },
  "throttled": "0s",
  "throttled_millis": 0,
  "requests_per_second": -1.0,
  "throttled_until": "0s",
  "throttled_until_millis": 0,
  "failures": []
 }
}