CloudFabrix Asset Analytics App for Splunk
1. Overview
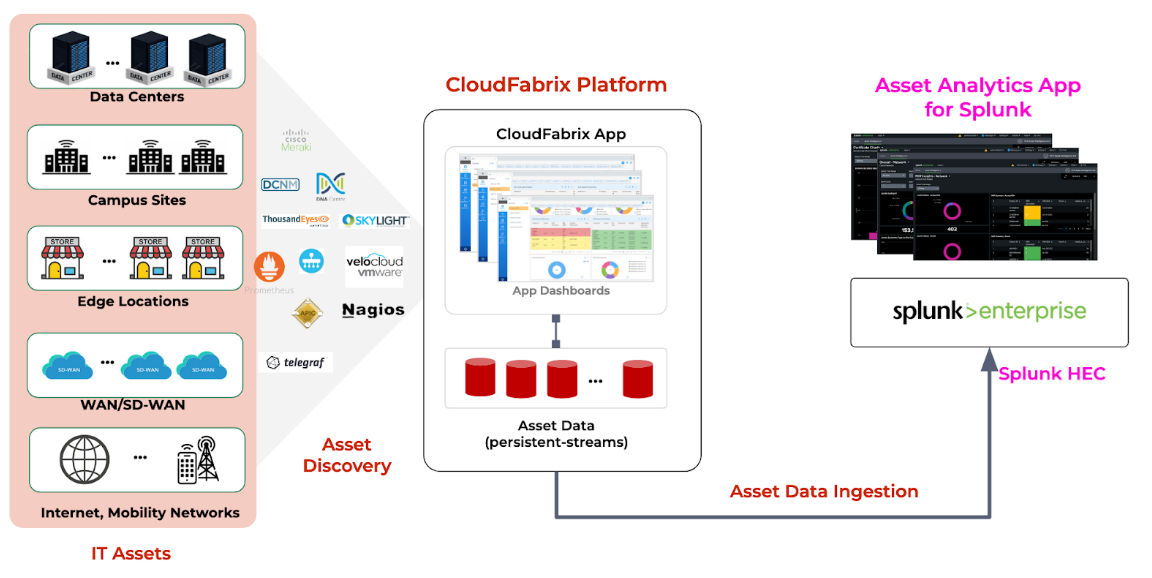
CloudFabrix is a trusted Cisco and Splunk Partnerverse Build partner, offering the Robotic Data Automation Fabric (RDAF) for data integration and enrichment through low-code bots. The CloudFabrix Asset Analytics App for Splunk enhances asset management by providing application dependency mapping and enriched data from Datacenter, Campus, Edge and SD-WAN environments. Use cases include Data Center modernization, Application Rationalization, Lifecycle Management, Capacity Utilization, Real-Time Asset Data Collection and CMDB updates.
1.1 Use Cases
Use Cases for ITOps, IT Planning and Network admins are as follows
a) Data Center Modernization and Refresh
-
Optimize resource allocation: Identify underutilized assets and consolidate workloads to reduce costs and improve efficiency.
-
Plan for future growth: Analyze capacity trends to anticipate future needs and avoid bottlenecks.
b) Application Modernization
-
Assess application performance: Monitor resource consumption and identify performance bottlenecks to optimize application performance.
-
Identify migration opportunities: Evaluate the suitability of applications for cloud migration or containerization based on resource utilization and dependencies.
c) Asset Lifecycle Analytics
-
Track asset health and performance: Monitor asset health metrics to proactively identify and address potential issues.
-
Optimize maintenance schedules: Use lifecycle data to schedule maintenance and replacements efficiently.
d) Capacity Utilization
-
Optimize resource allocation: Identify underutilized or overutilized resources to ensure efficient use of capacity.
-
Forecast future needs: Analyze capacity trends to predict future requirements and avoid capacity shortages.
e) Change Management
-
Assess impact of changes: Evaluate the potential impact of changes on resource utilization and performance.
-
Ensure compliance: Verify that changes adhere to established policies and procedures.
f) Real-Time Asset Data Collection and CMDB Update
-
Maintain accurate asset inventory: Ensure that the CMDB is always up to date with real-time asset data.
-
Improve incident response: Quickly identify affected assets and resolve issues efficiently.
g) Multi-Vendor Compute, Network, Storage, Licensing Insights
-
Gain unified visibility: Obtain comprehensive insights into the performance and utilization of assets from multiple vendors.
-
Optimize vendor relationships: Use data-driven insights to negotiate better terms with vendors.
1.2 Benefits
-
Unified Asset Management: Consolidate tools, improve accuracy, and establish a single source of truth for asset data.
-
Cost Efficiency: Optimize resource utilization, reduce OPEX by up to 40%, and enable cost avoidance through better asset management and vendor negotiations.
-
Risk Mitigation: Reduce security risks by staying current with hardware/software lifecycle and ensuring accurate replacement and upgrade costs.
-
Productivity & Automation: Achieve up to 95% time savings with automation, reducing manual intervention and simplifying change management.
2. How it Works Getting Data In (GDI) Overview
The Asset Analytics App is an app built for Splunk Enterprise platform, that provides IT asset insights using various dashboards, which visualize the data in Splunk indexer. Initially when the App is installed it will not have any data and all the widgets will show empty values. For the App to work as intended, a mandatory component called CloudFabrix (CFX) RDA Edge needs to be deployed externally to the Splunk platform. CFX RDA Edge is responsible for performing asset discovery, enrichment and ingesting the data into Splunk index using HEC token. Without the CFX RDA Edge, the App will not work and will not be able to visualize any data.
2.1 CloudFabrix RDAF
CloudFabrix utilizes low-code bots (akin to Function as a Service) and pipelines to conduct asset discovery and integrate tools. A more comprehensive construct, the Service Blueprint, facilitates the implementation of use cases by packaging essential pipelines, dashboards and other artifacts. When instantiated, Service Blueprints can operate as Services on a continuous basis (like Linux daemons), on a schedule (like cron jobs), or on-demand. CloudFabrix offers a specialized Service Blueprint designed for the Asset Analytics App for Splunk. This blueprint will ingest asset data into Splunk via HEC.
2.2 Asset Discovery
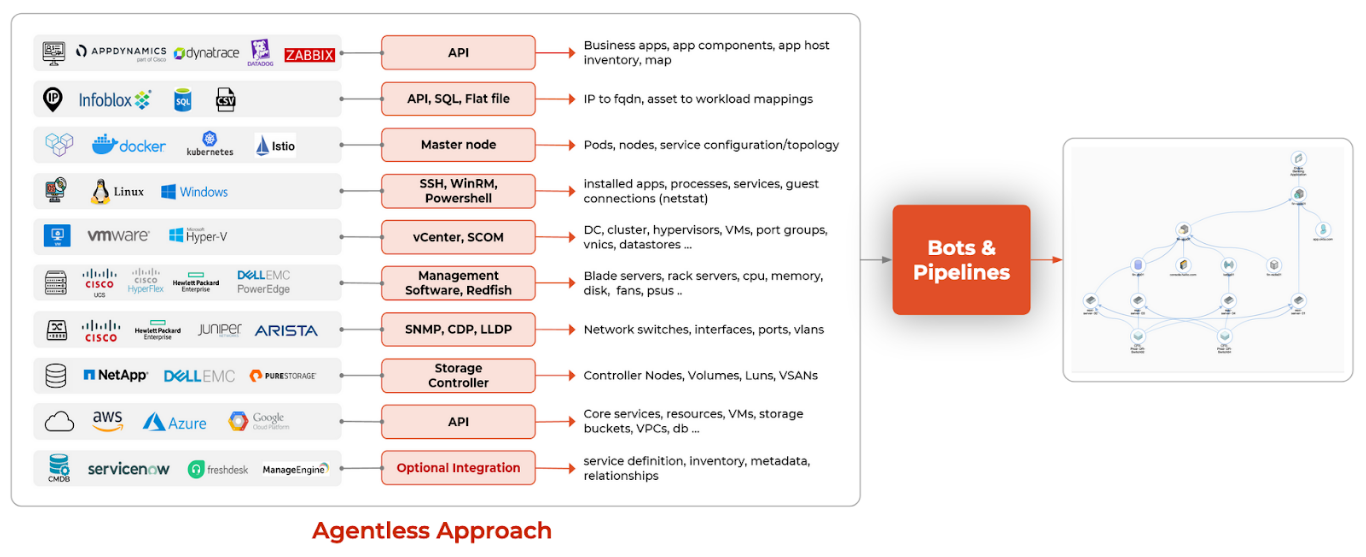
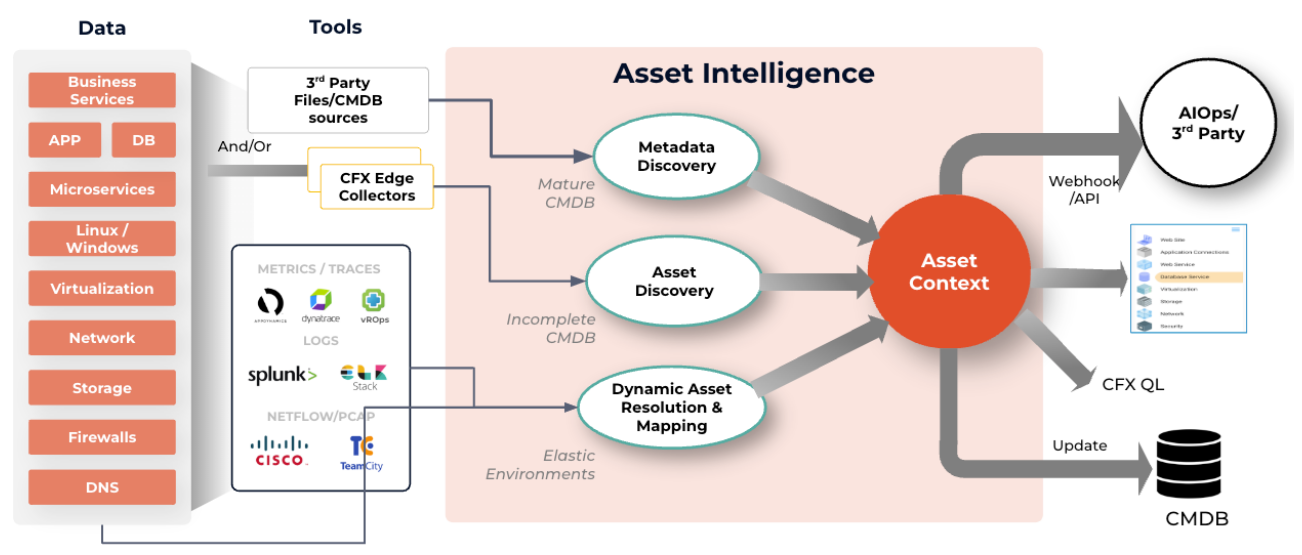
CloudFabrix RDA Fabric employs an agentless approach for Asset Discovery, eliminating reliance on CMDB. By integrating with existing monitoring tools, element managers, management software and even direct device integrations, RDA consolidates, contextualizes and enriches application dependency mapping. The module conducts both periodic discovery and subscribes to real-time logs, events and change notifications, ensuring an accurate and unified representation of assets across domains and environments.
2.3 Asset Insights
RDA integrates with external vendors to understand the lifecycle state of every device type, which is typically identified by a product ID (PID). Vendors like Cisco provide APIs (ex: Smartnet Total Care SNTC) or through End of Life notifications (EoS/EoL), that will be incorporated into asset insights to present analytics. For vendors who do not provide such APIs, asset lifecycle data can be easily imported using CSV files. In addition to this, many insights computed.
3. Prerequisites
-
Splunk Enterprise v9.x or v8.x
-
One VM with following system requirements for CloudFabrix RDA Fabric Installation
a) vCPU: 8
b) vMem: 32 GB
c) Disk: 250 GB (Thin Provisioned)
4. Getting Started
Following high-level steps need to be followed to get started with Asset Analytics App for Splunk. Following sections provide detailed instructions for performing each of these steps.
1) Splunk: Install the App
2) Splunk: Explore the App Dashboards
3) Splunk: Configure HEC for Data Ingestion (save HEC token)
4) CFX: Install the CloudFabrix RDA Fabric
5) CFX: Specify Splunk HEC token in RDA Fabric (for CFX->Splunk data ingestion)
6) CFX: Initiate Asset Discovery in RDA Fabric
7) Splunk: View Data in App dashboards
4.1 Splunk: Install the App
In Splunk, there are Two ways to install the App
4.1.1 Browse and Install from Splunkbase
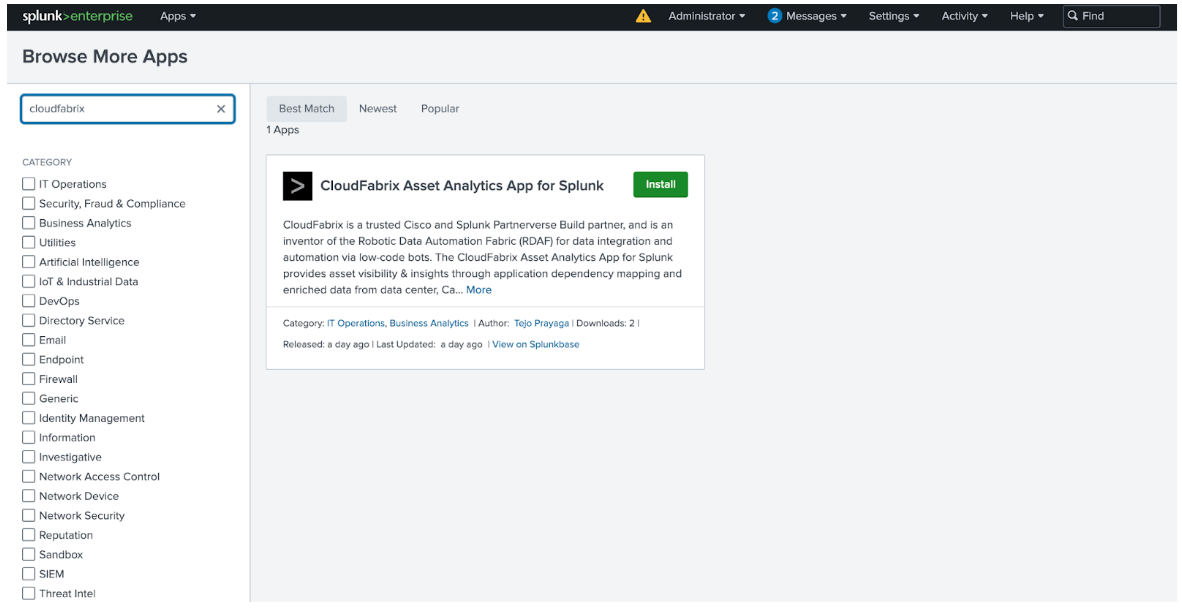
1. Click on the "Apps" menu from the top bar of the Splunk dashboard.
2. Select "Find More Apps" to search for apps from Splunkbase

3. In the "Browse More Apps" page, you can search for "CloudFabrix" and will show the CloudFabrix Asset Analytics App.
4. Once you locate the app, click the "Install" button next to the app.
4.1.2 Download App File and Install from File
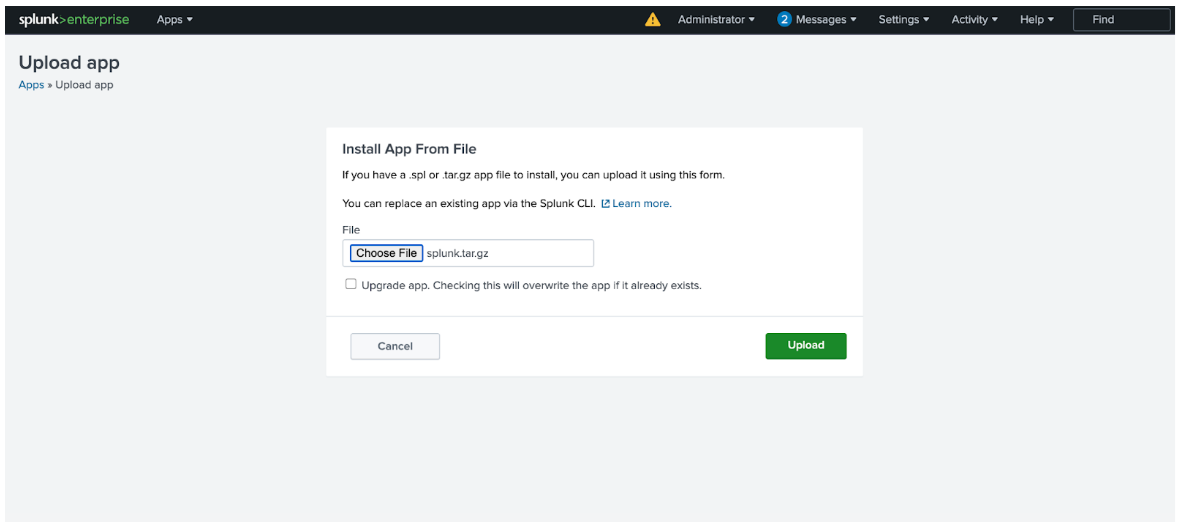
1. If you have a tar.gz app file on your local system, you can install it directly.
2. Navigate to the "Apps" menu and select "Manage Apps"

3. On the Apps page select "Install app from file."
4. On the "Upload App" page, click "Choose File" to upload the app file from your local machine.
5. After selecting the file, click "Upload" to install the app. You also have the option to upgrade an existing app by checking the upgrade box.
4.2 Splunk: Explore the App Dashboards
To navigate to the CFX Asset Analytics app within Splunk, follow these steps
1. From the Splunk dashboard, click on the "Apps" dropdown menu at the top of the screen.
2. Click on the dropdown to view a list of installed apps.
3. In the list, you will see several apps available. Locate and select "CFX Asset Analytics" from the dropdown as shown in the image below.

4. Once selected, the app will load, and you can explore the various dashboards and functionalities within the app.
Once the CFX Asset Analytics app is open in Splunk, there are two main ways to navigate within the app
4.2.1 Navigate Using the Home Page Sidebar
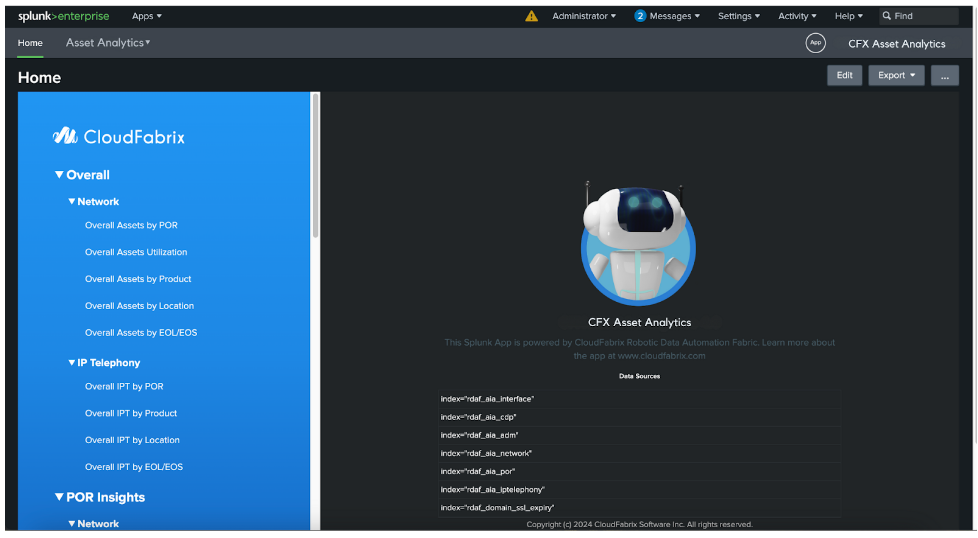
After the app loads, the home page presents a sidebar with various categories and dashboards. You can directly click on any of the options listed to view the corresponding data and visualizations.
For example, in the Network section, user can select dashboards such as "Overall Assets by POR" or "Overall Assets Utilization" to dive into specific network metrics.
This method offers quick access to key dashboards directly from the home screen.
4.2.2 Navigate Using the Top Dropdown Menu
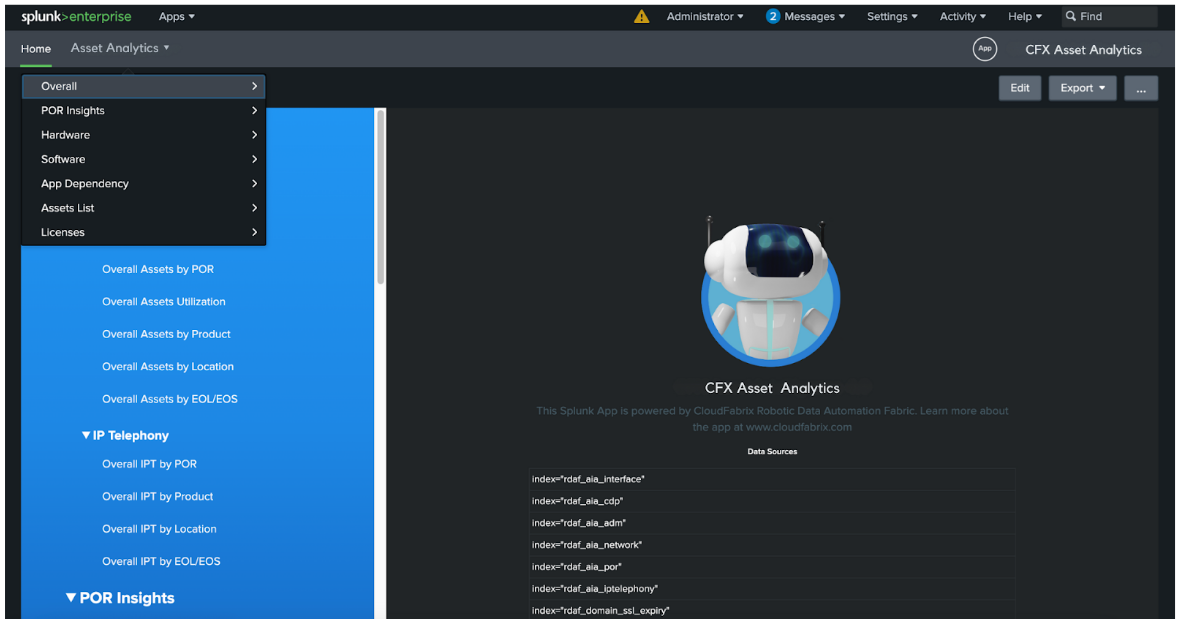
Alternatively, you can navigate through the app by using the Top-Level Dropdown Menu. This menu appears under Asset Analytics in the top bar and provides structured navigation for different sections like "Overall", "POR Insights", "Hardware", and more
By clicking on any section in the dropdown, you will see sub-options for specific dashboards. For instance, under "Overall", you can select dashboards such as "Network" & "IP Telephony"
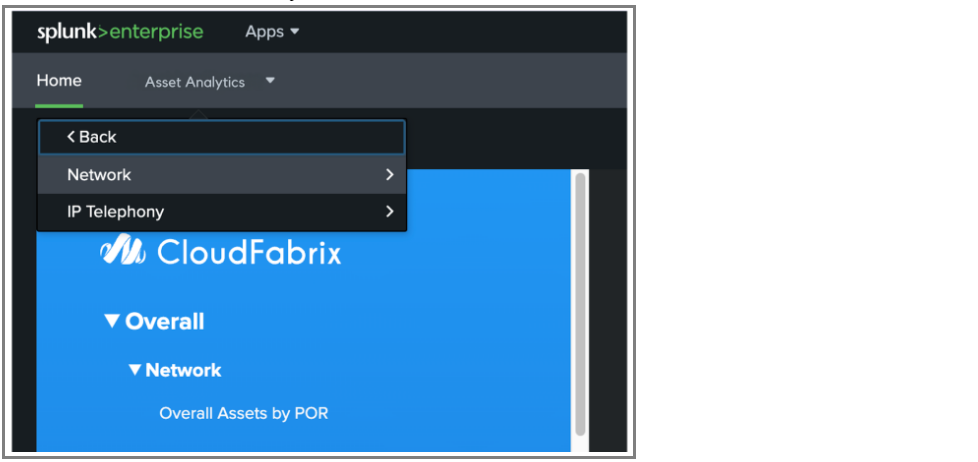
This navigation method is particularly useful when you want to quickly switch between sections or specific dashboards without returning to the home page.
Both methods offer flexibility in navigating the CFX Asset Analytics, allowing users to choose the navigation approach that best fits their needs
4.2.3 High-Level Overview of Key Dashboards
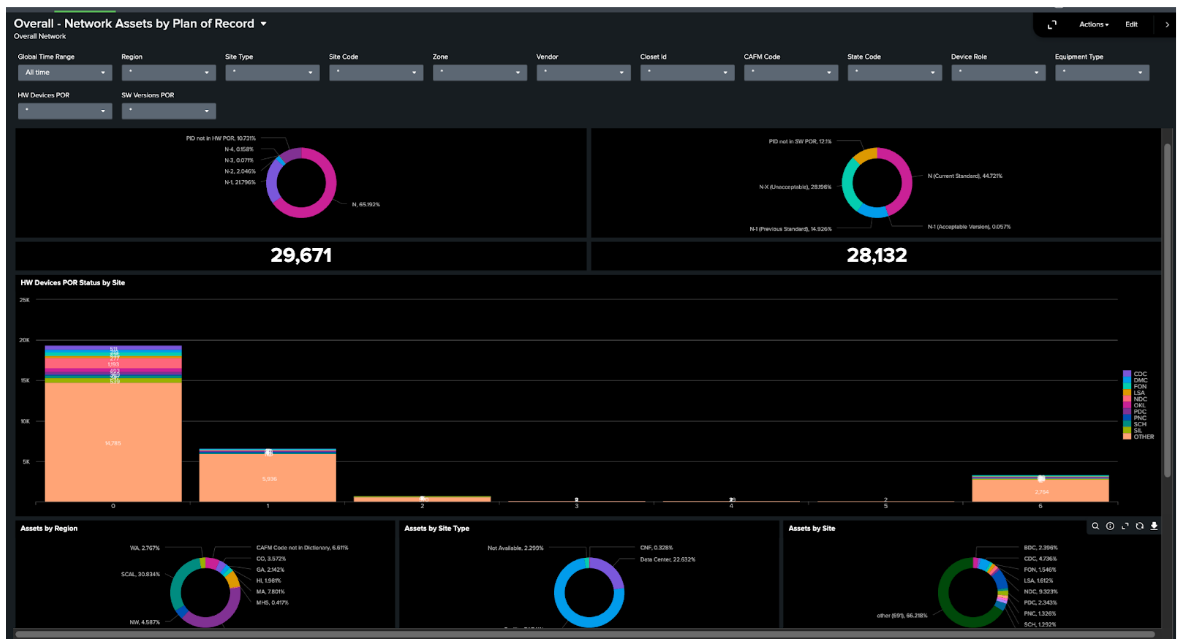
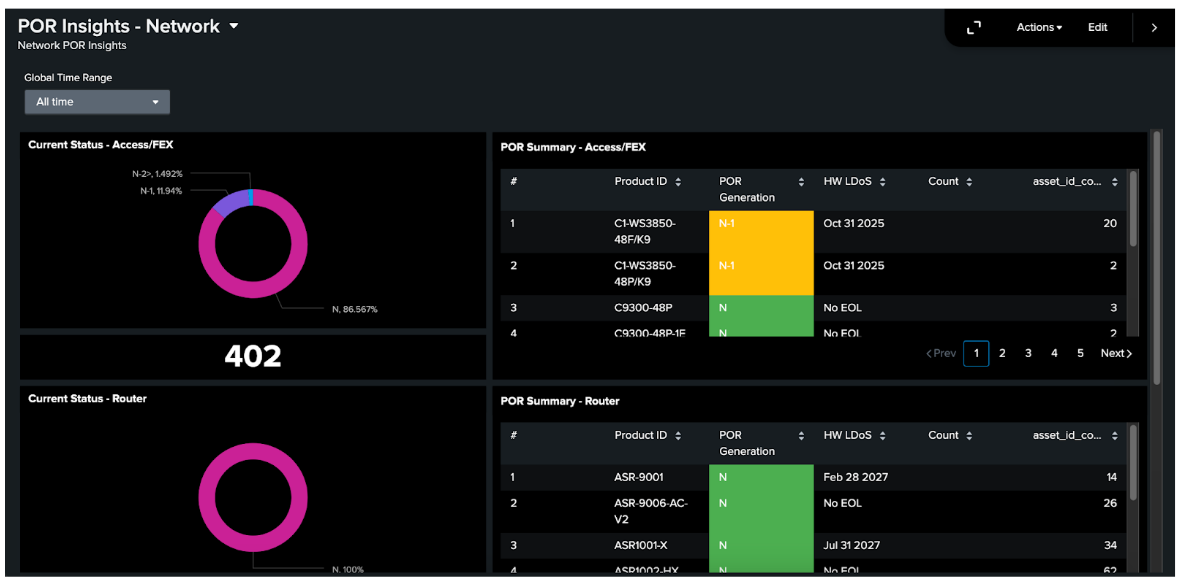
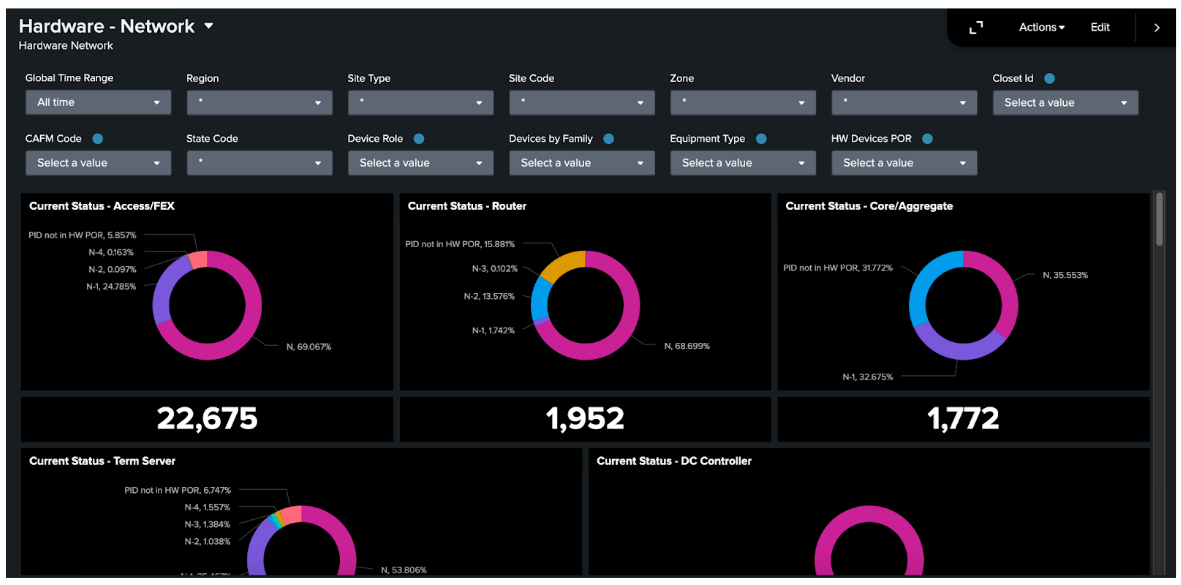
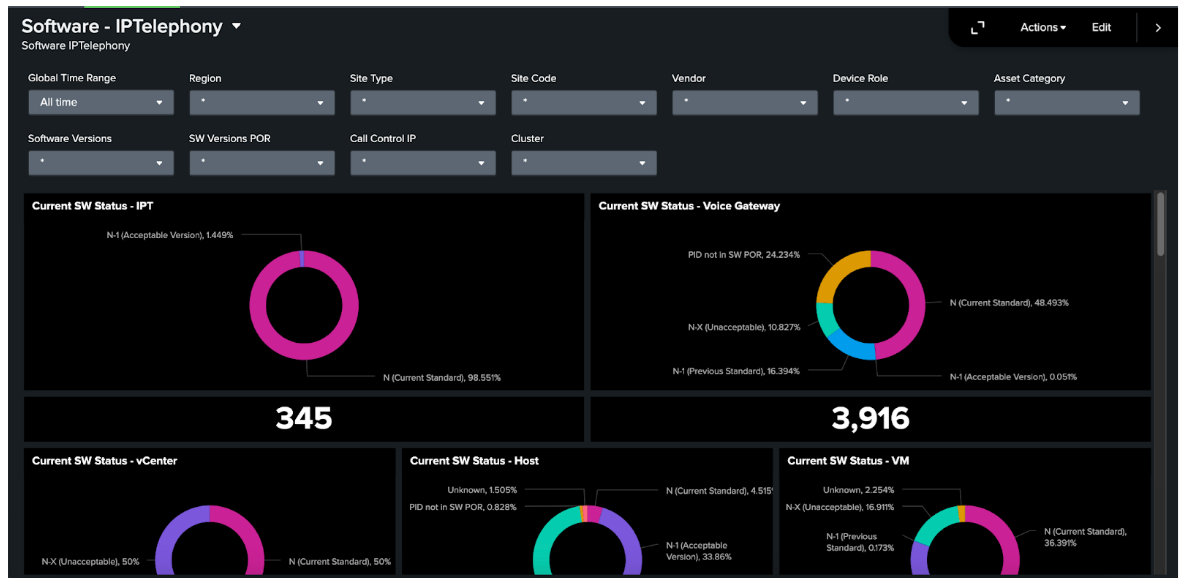
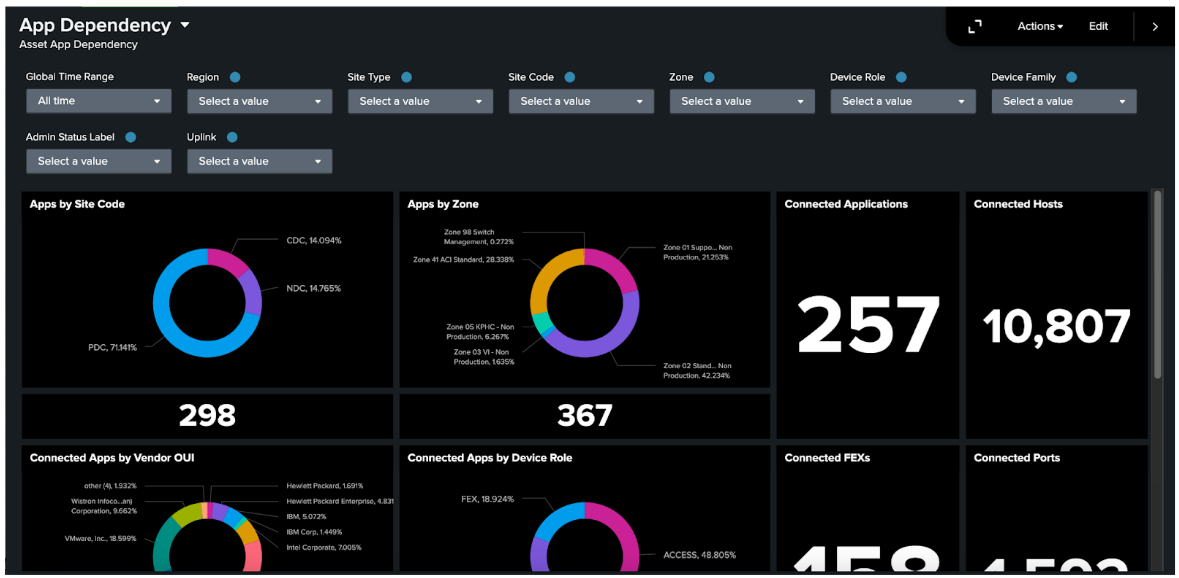
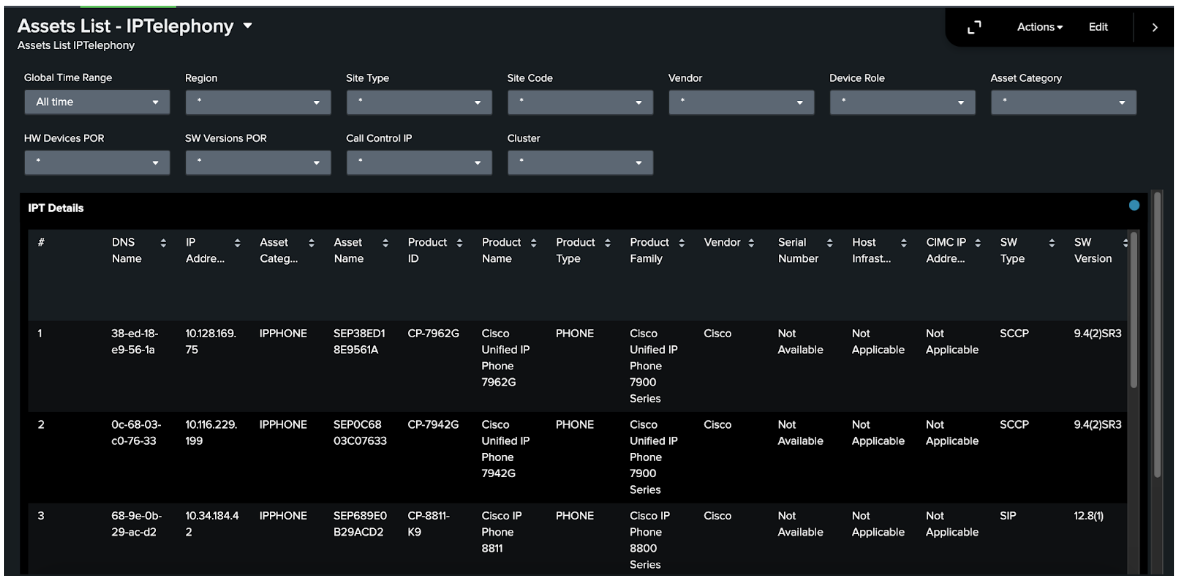
The CFX Asset Analytics app offers a wide range of dashboards, each providing important insights into different aspects of your network and assets. Below are a few examples of the dashboards
Overall --> Network
POR Insights --> Network
Hardware --> Network
Software --> Network
App Dependency --> App Dependency
Asset List --> Network
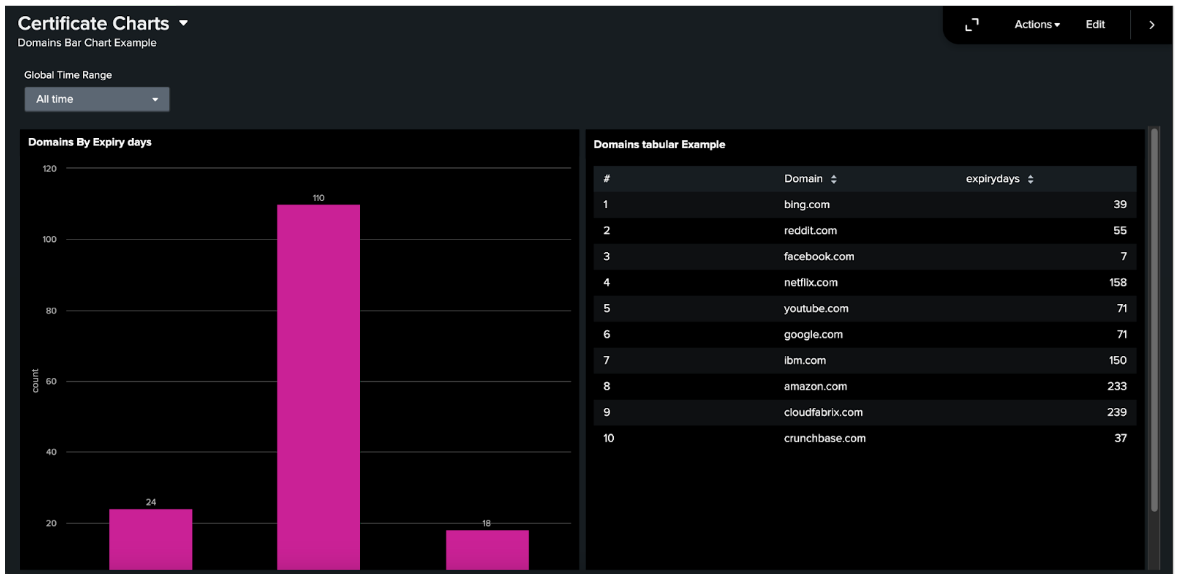
Licenses --> Certificate Charts
4.3 Splunk: Configure HEC for Data Ingestion
For HEC Configuration in Splunk, please refer to the following Configure HEC on Splunk Enterprise for detailed instructions
4.3.1 Enable HTTP Event Collector on Splunk Enterprise
Before user can use Event Collector to receive events through HTTP, you must enable it. For Splunk Enterprise, enable HEC through the Global Settings dialog box.
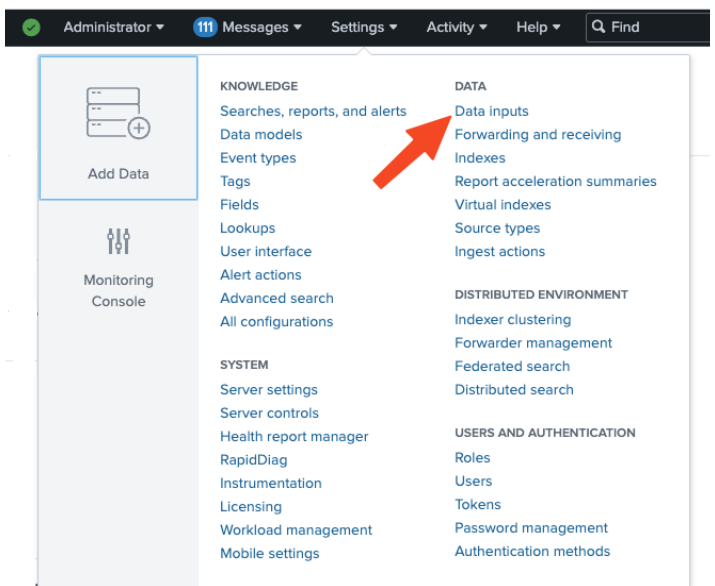
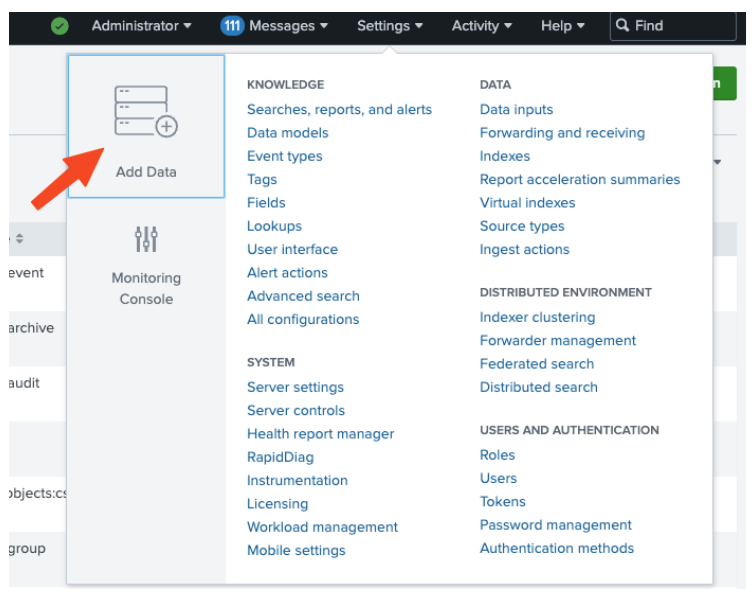
1. Click Settings > Data Inputs
2. Click HTTP Event Collector
3. Click Global Settings

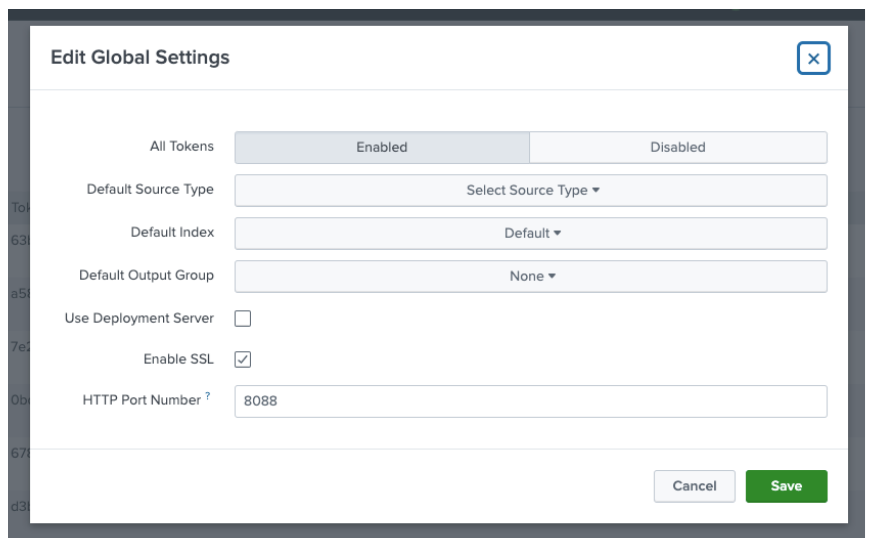
4. In the All Tokens toggle button, select Enabled.
-
(Optional Fields)
-
Choose a Default Source Type for all HEC tokens. You can also type in the name of the source type in the text field above the drop-down list box before choosing the source type.
-
Choose a Default Index for all HEC tokens.
-
Choose a Default Output Group for all HEC tokens.
-
To use a deployment server to handle configurations for HEC tokens, click the Use Deployment Server check box.
-
To have HEC listen and communicate over HTTPS rather than HTTP, click the Enable SSL checkbox.
-
Enter a number in the HTTP Port Number field for HEC to listen on.
-
Confirm that no firewall blocks the port number that you specified in the "HTTP Port Number" field, either on the clients or the Splunk instance that hosts HEC.
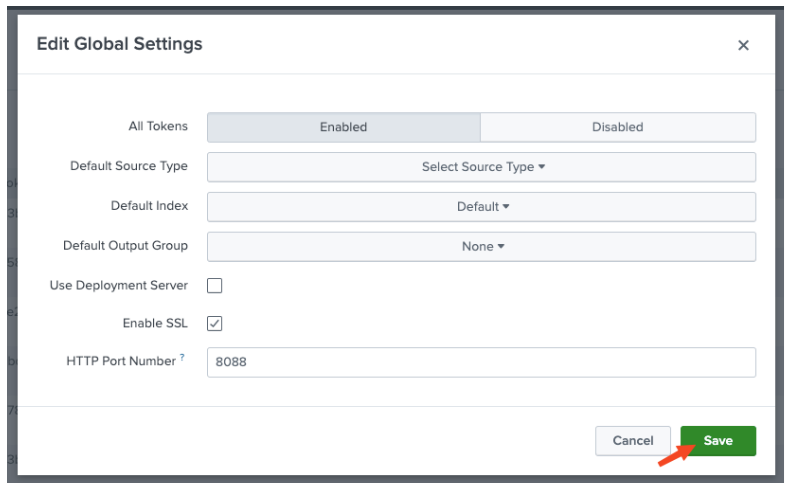
5. Click Save
4.3.2 Create an Event Collector Token on Splunk Enterprise
To use HEC, you must configure at least one token.
1. Click Settings --> Add Data.
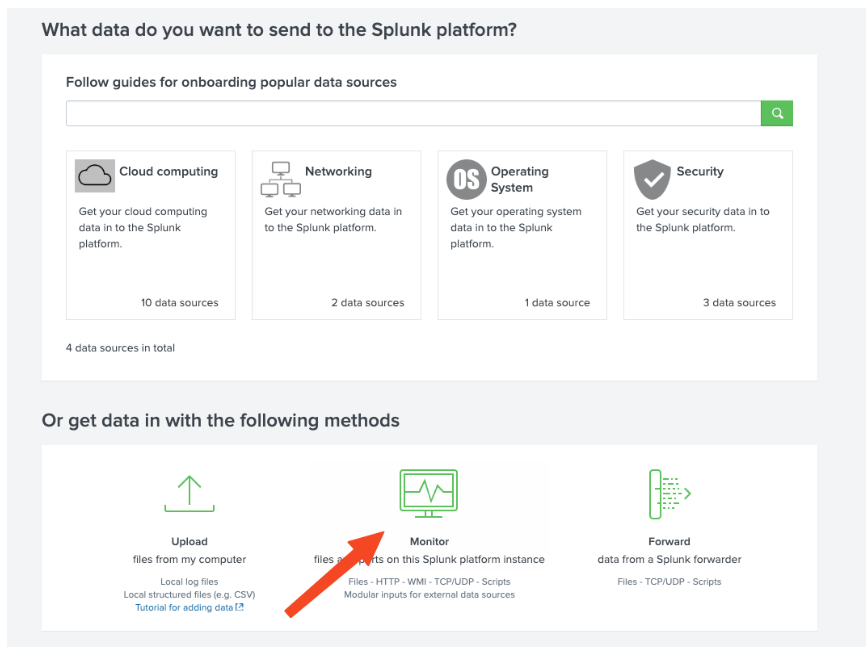
2. Click Monitor
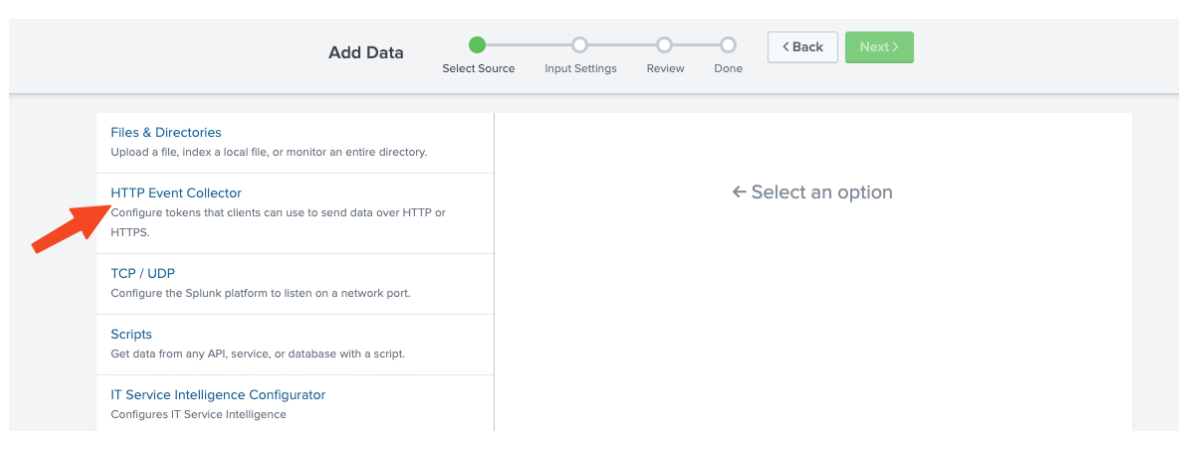
3. Click HTTP Event Collector.
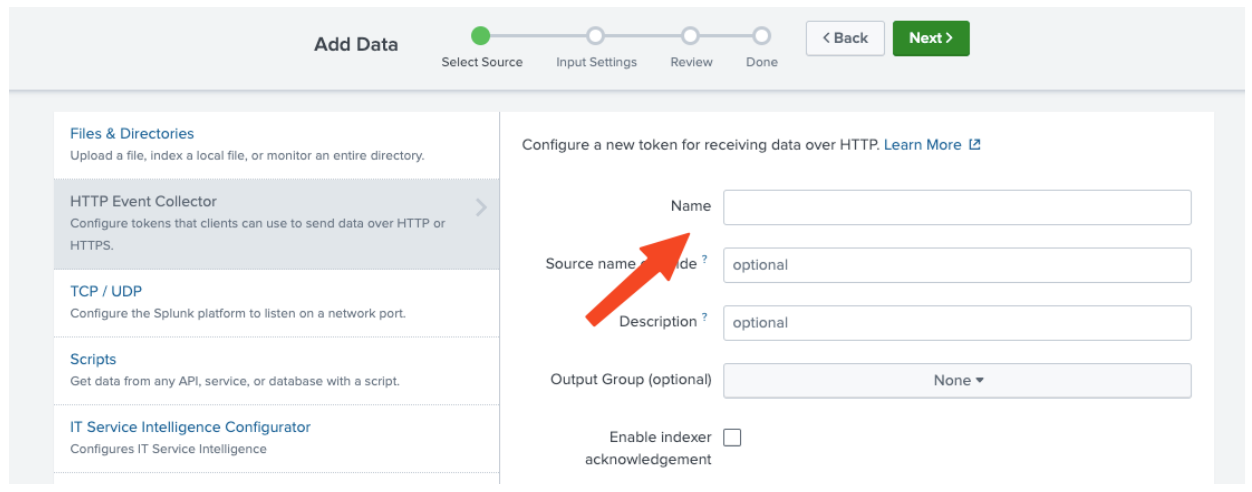
4. In the Name field, enter a name for the token.
-
(Optional)
-
In the Source name override field, enter a source name for events that this input generates.
-
In the Description field, enter a description for the input.
-
In the Output Group field, select an existing forwarder output group.
-
If you want to enable indexer acknowledgment for this token, click the Enable indexer acknowledgment checkbox.
-
Click Next.
-
Confirm the source type and the index for HEC events.
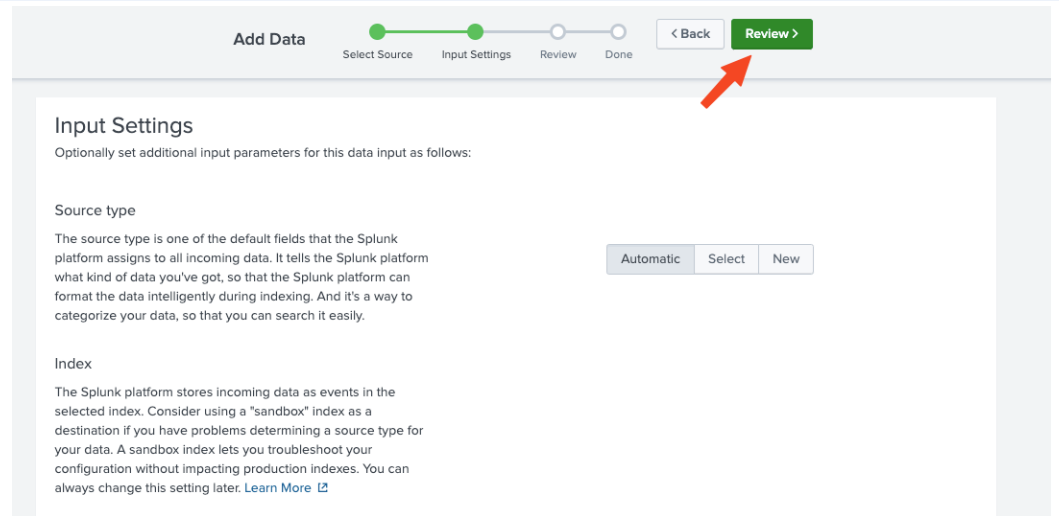
5. Click Review.
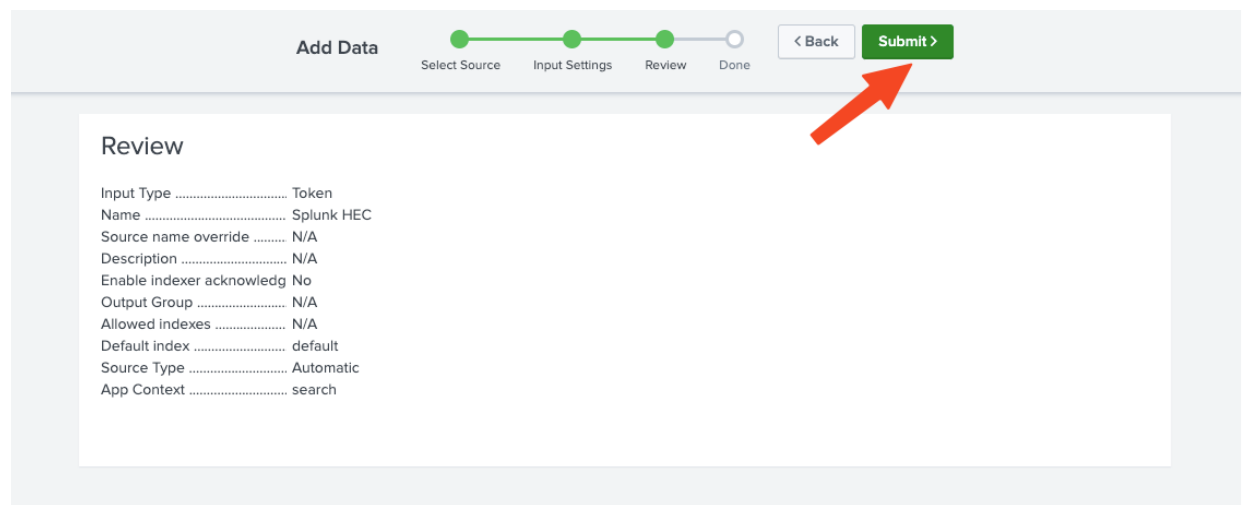
6. Confirm that all settings for the endpoint are what the user wants.
7. If all settings are what the user wants, click Submit. Otherwise, click < Back to make changes.
(Optional) Copy the token value that Splunk Web displays and paste it into another document for reference later.
For more information on Send data to HTTP Event Collector Click Here
4.4 CFX: Installing CloudFabrix RDA Fabric
4.4.1 Overview
Robotic Data Automation Fabric(RDAF) is designed to efficiently manage data across multi-cloud and multi-site environments at scale. Its microservices-based, distributed architecture enables deployment in Kubernetes clusters or native Docker container environments managed by the RDAF deployment CLI.
The RDAF deployment CLI, built on Docker Compose, automates the lifecycle management of RDAF platform components, including installation, upgrades, patching, backup, recovery, and other essential operations.
The RDAF platform comprises a suite of services that can be deployed on a single virtual machine or bare metal server.
4.4.2 System Requirements
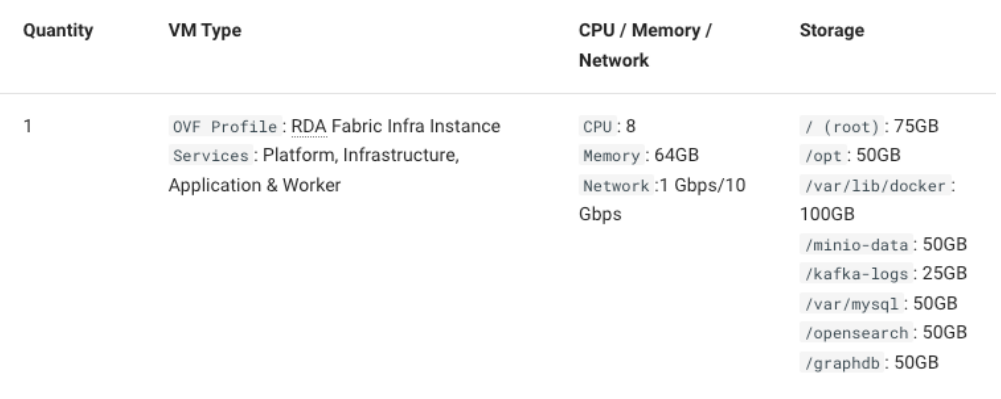
The below configuration is required for enabling the RDA Fabric, Infrastructure and application services to be installed along with Fabric services.
For deployment and configuration options, please refer the below:
1) OVF Based Deployment
2) Deployment on RHEL/Ubuntu OS
4.4.3 Network Layout and Ports
Please refer to the below picture which outlines the network access layout between the RDAF services and the ports used by them.
External Network ports: These ports are exposed for incoming traffic into RDAF platform, such as, portal UI access, RDA Fabric access (NATs, Minio & Kafka) for RDA workers & agents that were deployed at the edge locations, Webhook based alerts, SMTP email based alerts etc.
Asset Discovery and Integrations: Network Ports
Access Protocol Details |
Endpoint Network Ports |
|---|---|
| Windows AD or LDAP - Identity and Access Management - RDAF platform --> endpoints (Windows AD or LDAP) | 389/TCP ,636/TCP |
| SSH based discovery - RDA Worker/Agent (Edge Collector) --> endpoints (Ex: Linux/Unix, Network/Storage Devices) | 22/TCP |
| HTTP API based discovery/Integration: RDA Worker / AIOps app --> endpoints (Ex: SNOW, CMDB, vCenter, K8s, AWS etc.) | 443/TCP, 80/TCP, 8080/TCP |
| Windows OS discovery using WinRM/SSH protocol RDA Worker --> Windows Servers | 5985/TCP, 5986/TCP, 22/TCP |
| SNMP based discovery: - RDA Agent (Edge Collector) --> endpoints (Ex: network devices like switches, routers, firewall, load balancers etc.) | 161/UDP, 161/TCP |
4.4.4 OVF Based Deployment
For deployment using an OVF file, please refer to the following guides:
1. RDAF Platform VMs Deployment Using OVF: Detailed instructions for deploying the RDAF platform using the OVF file can be found here.
2. Post OS Image OVF Deployment Configuration: After the OVF deployment, follow the post-configuration steps outlined here to complete the setup process.
4.4.5 RDAF platform VM Deployment on Ubuntu OS/RHEL
Below steps outlines the required pre-requisites and the configuration to be applied on RHEL or Ubuntu OS VM instances when CloudFabrix provided OVF is not used, to deploy and install RDA Fabric platform, infrastructure, application, worker and on-premise docker registry services.
1. Software Pre-requisites
-
RHEL: RHEL 8.3 or above
-
Ubuntu: Ubuntu 20.04.x or above
-
Python: 3.7.4 or above
-
Docker: 20.10.x or above
-
Docker-compose: 1.29.x or above
For RHEL please refer the following Document
For Ubuntu please refer the following Document
2. Install and Configure RDA Fabric Edge Services
Please refer the following Document on installing, configuring & Completing RDA Fabric Edge Services for above mentioned both OVF Based Deployment & RDAF Platform VM Deployment on Ubuntu OS/RHEL
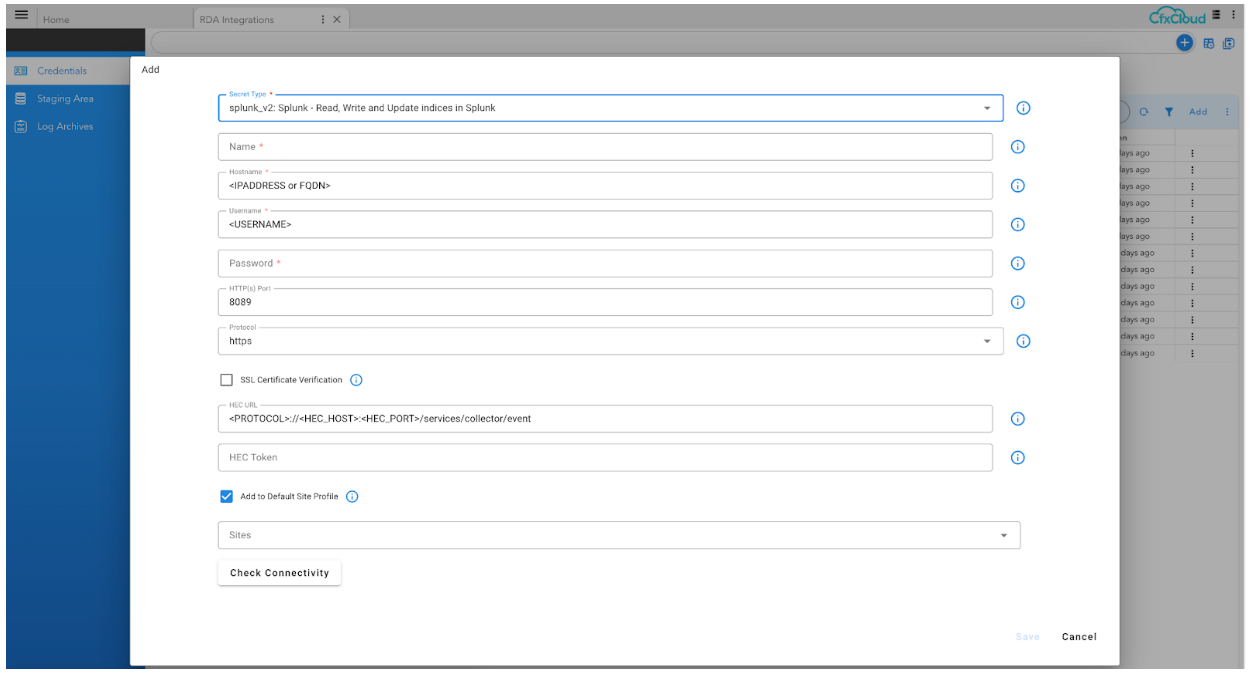
4.5 CFX: Specify Splunk HEC token in RDA Fabric
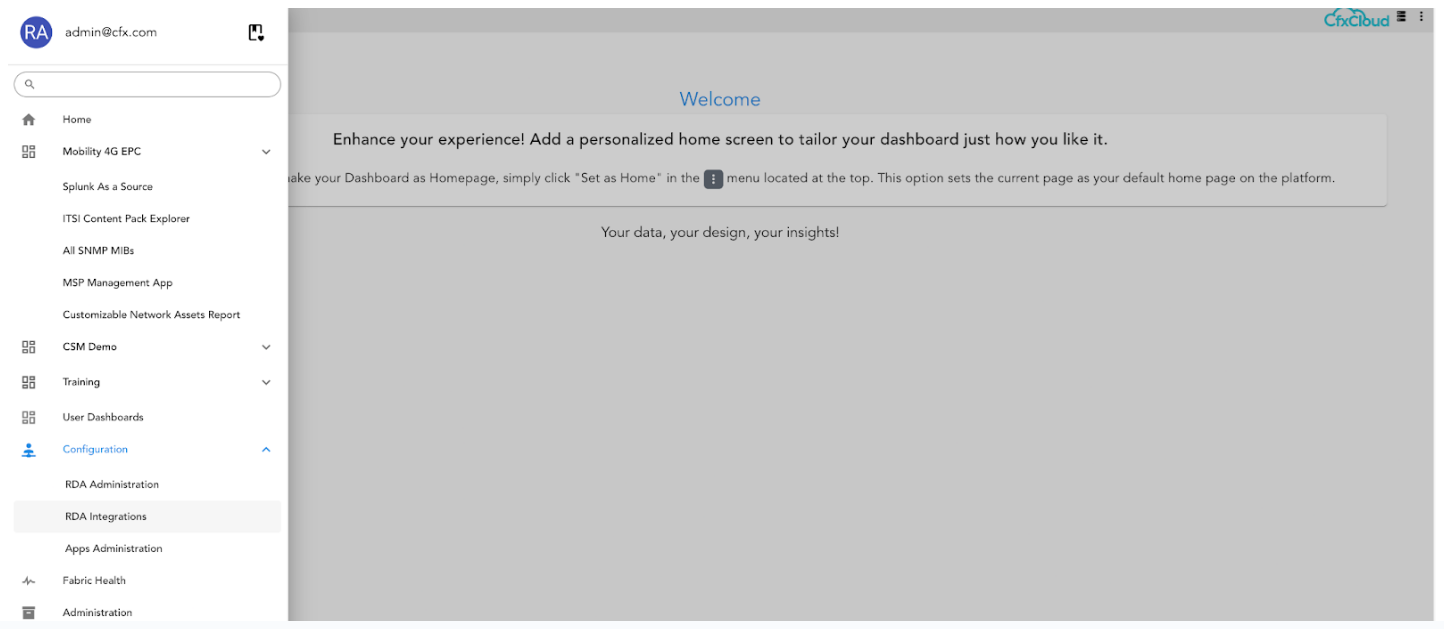
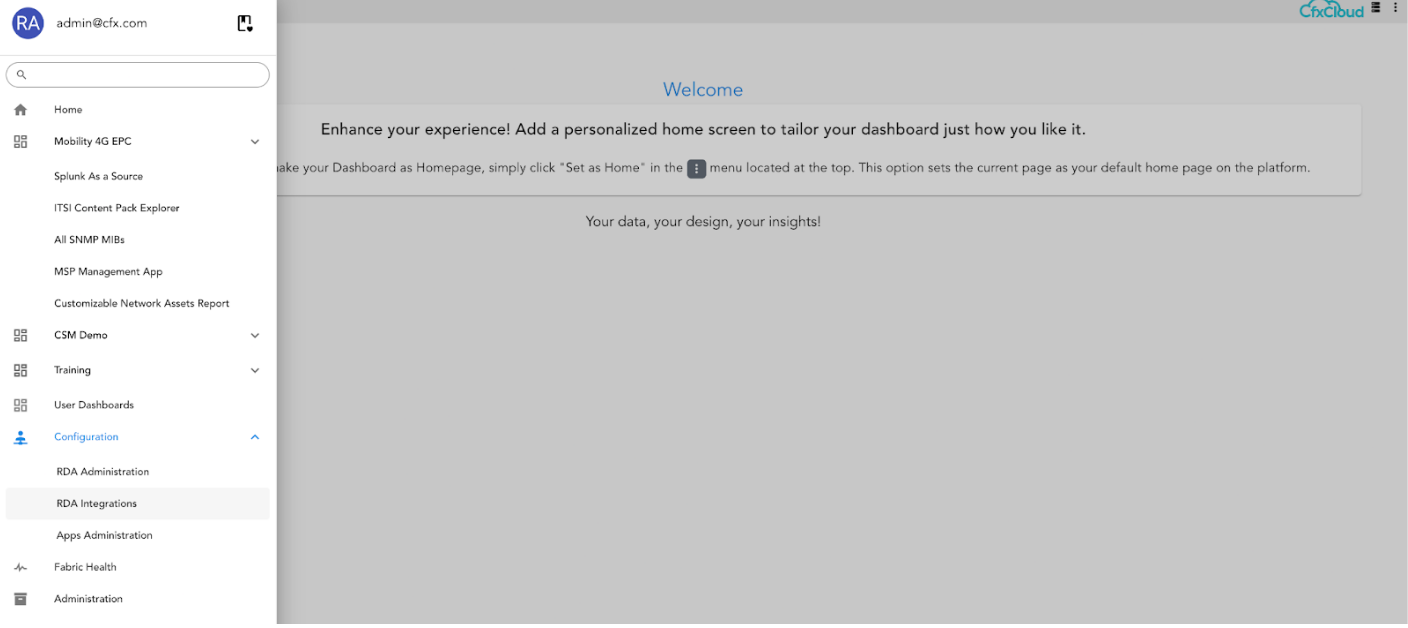
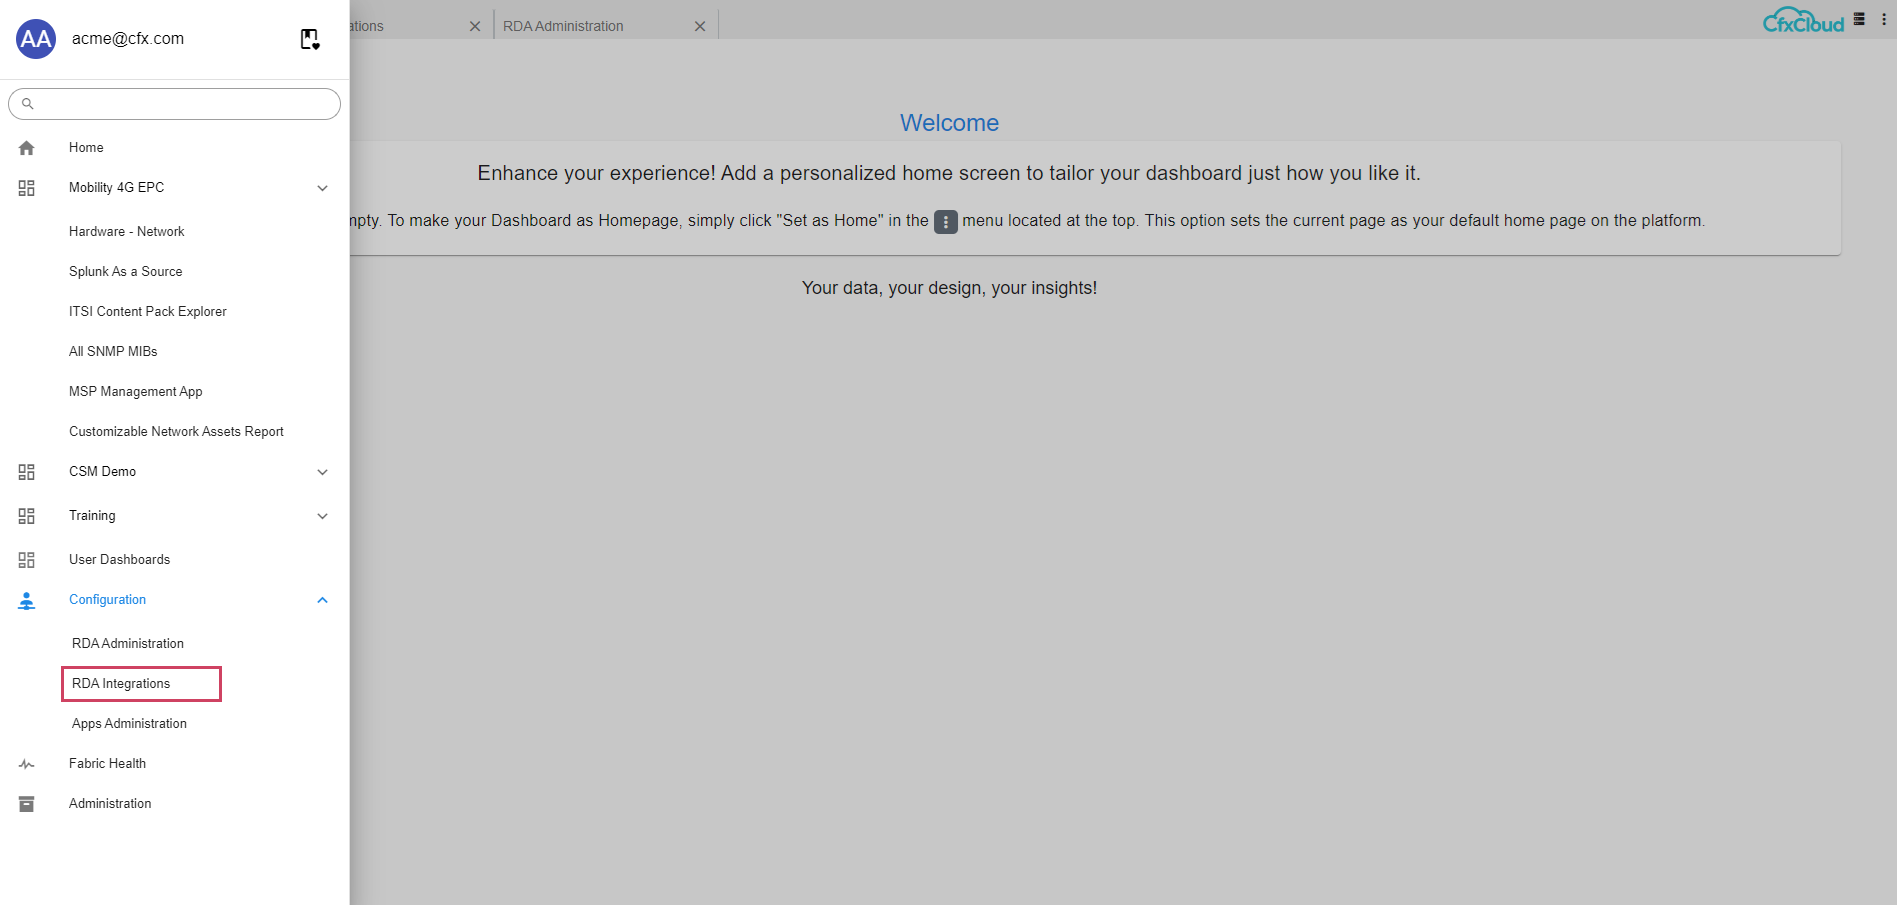
1. Please click on the following in order to enter into RDA Integrations
2. Please click on Add for adding the credentials
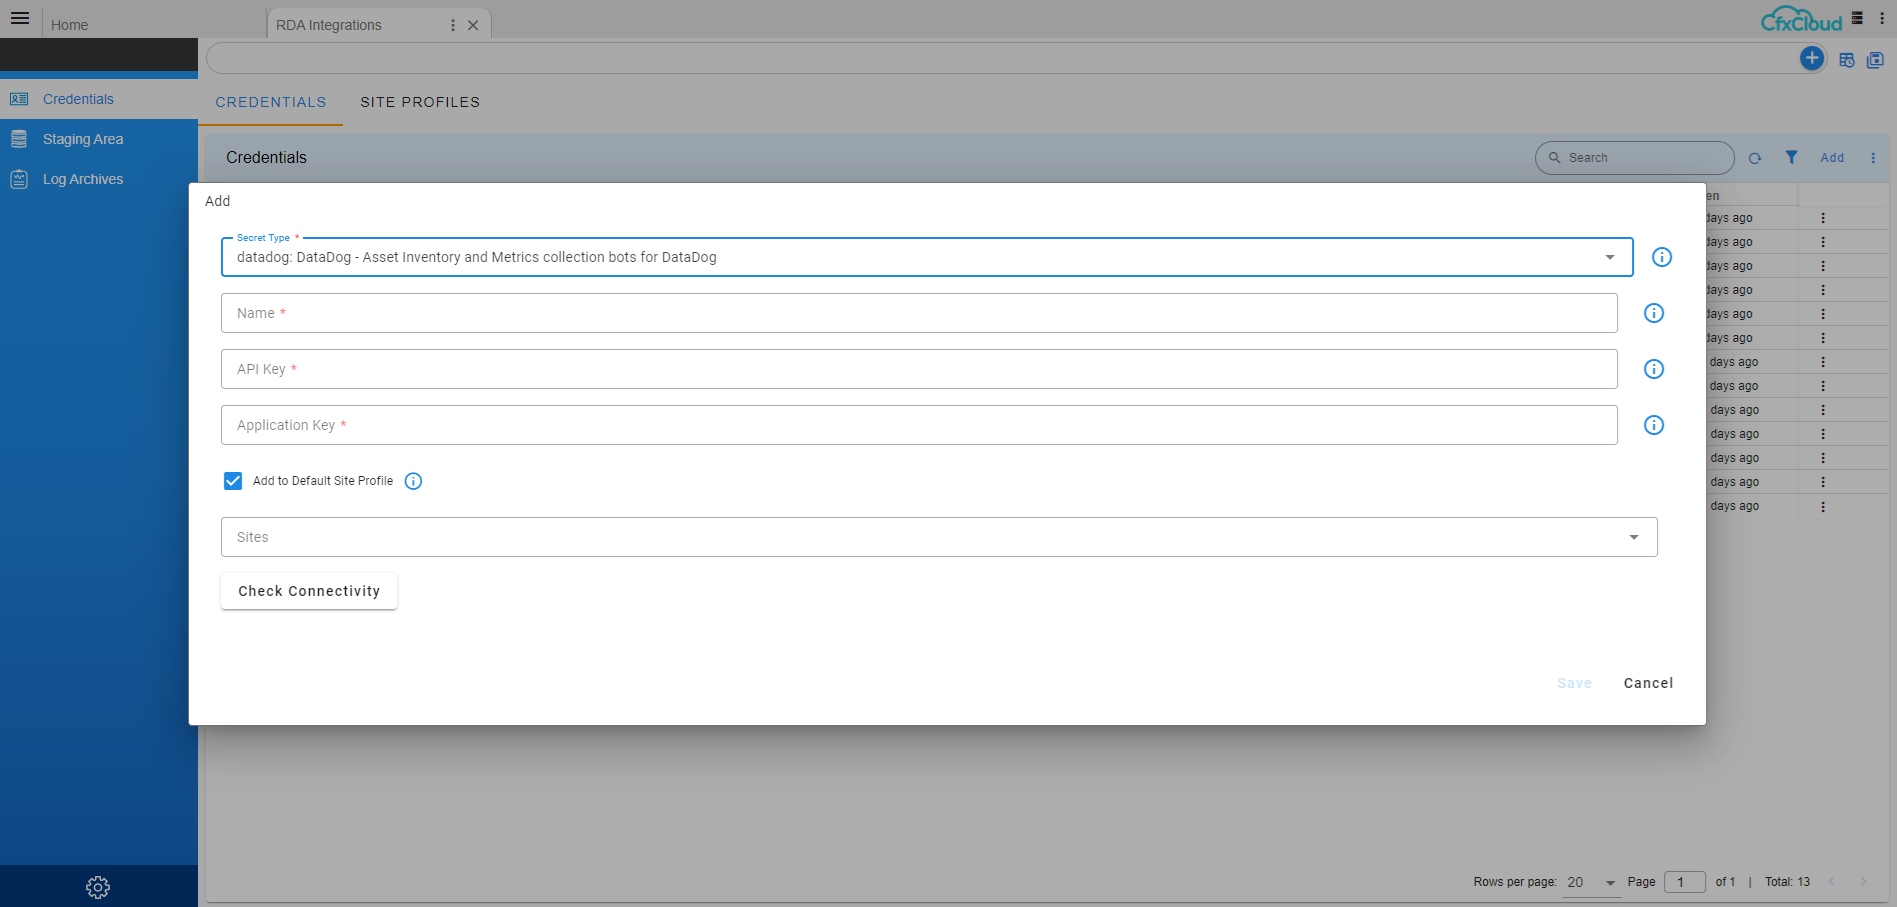
3. Please select the Splunk V2 from the options and here are the items needs to be filled
4.6 CFX: Initiate Asset Discovery in RDA Fabric
The following steps provide the high level overview on getting started with Asset Analytics (AIA):
-
Discovering VMware Environment
-
Discovering Linux and Windows Servers
-
Discovering Network Devices
-
Discovering Other IT Assets
-
Performing Customizations
The below Topology/Full-Stack context provides on how the AIA works in RDA Cloud Fabric platform
4.6.1 Discovering VMware Environment
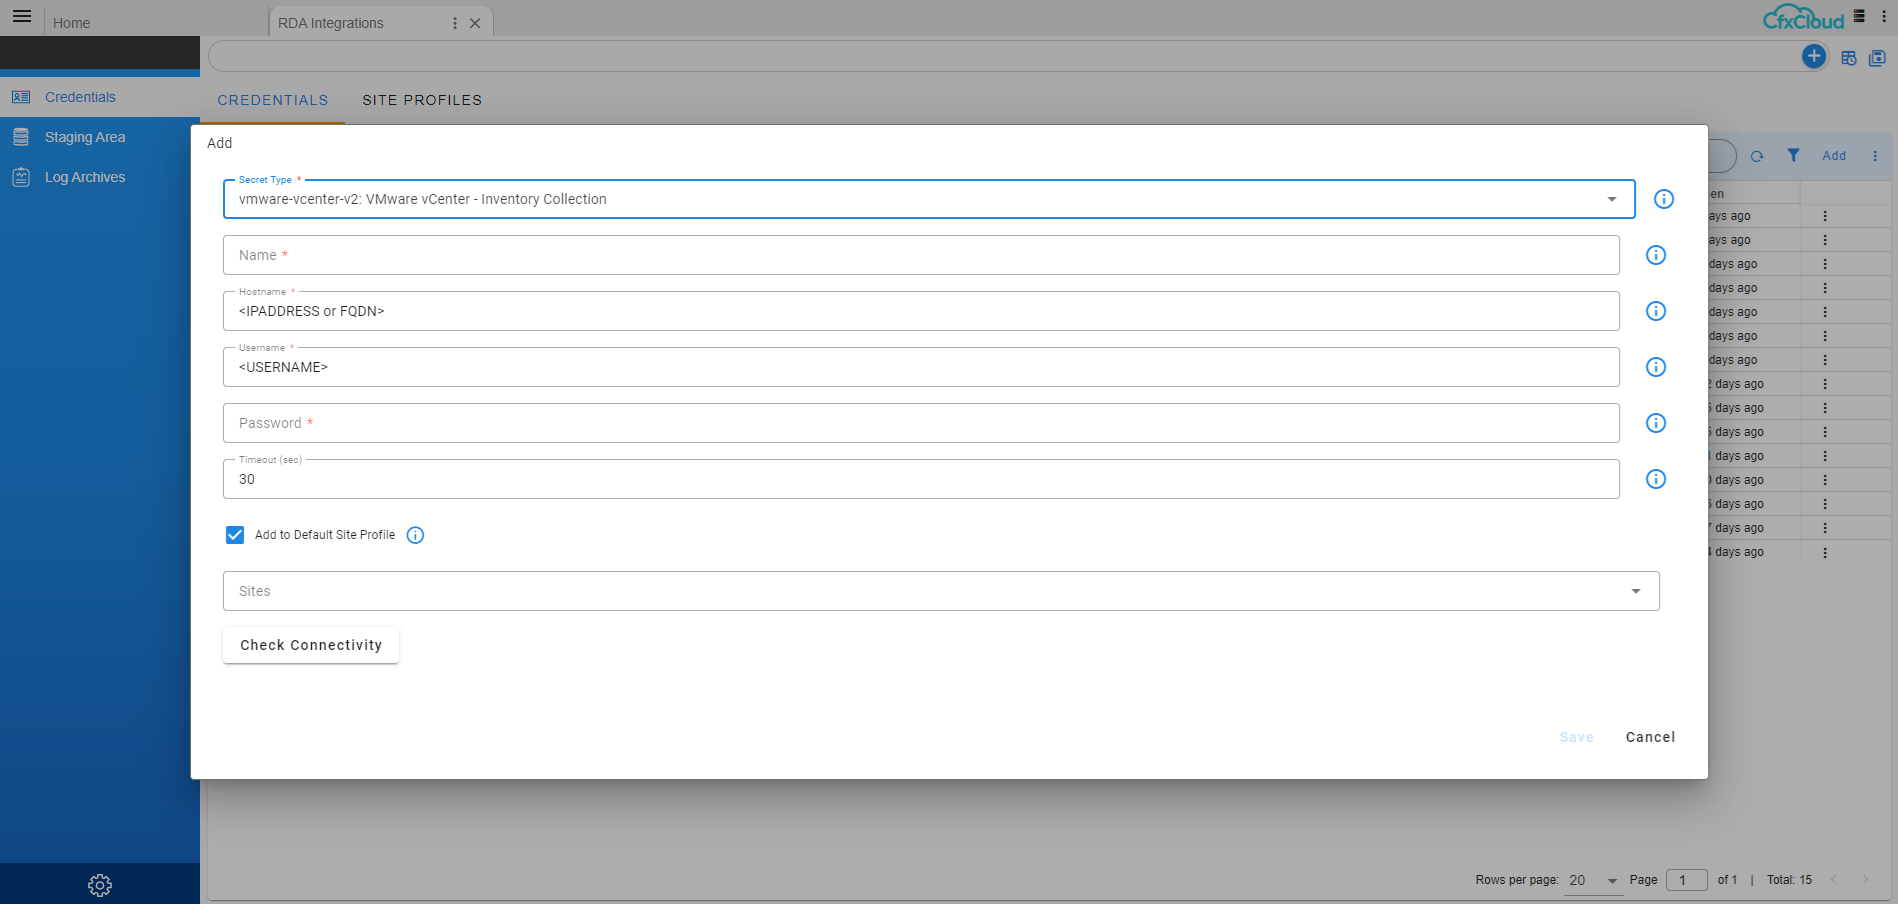
1. Add vCenter Source Credentials
- Login to UI with tenant admin user acme@cfx.com
- Please click on the following in order to enter into RDA Integrations Go to Home --> RDA Integrations
- Please click on Add for adding the credentials
Click on Configuration -->RDA Integrations --> Click on Credentials --> click on Add
- Select credentials type as vmware-vcenter-v2: VMware vCenter - Inventory Collection and provide below details
Credential Name: vcenter_src_name (Name should be same like mentioned here)
Hostname: IP address of vCenter
Username: xxxxxxxx
Password: xxxxxxxxx
Site: worker site
Click on Check connectivity and click on Save to save the credentials
2. Create pstreams for vCenter
{
    "unique_keys": [
        "unique_id"
    ],
    "timestamp": "collection_timestamp",
    "search_case_insensitive": true,
    "_settings": {
        "number_of_shards": 3,
        "number_of_replicas": 1,
        "refresh_interval": "30s"
    }
}
{
    "unique_keys": [
        "left_id",
        "right_id"
    ],
    "_settings": {
        "number_of_shards": 3,
        "number_of_replicas": 1,
        "refresh_interval": "15s"
    }
}
3. We need to change the tenant_id in the below pipelines
vmware_vcenter_datastore_inventory_collection_pipelinevmware_vcenter_esxi_host_inventory_collection_pipelinevmware_vscenter_host_network_inventory_collection_pipelinevmware_vcenter_vswitch_inventory_collection_pipelinevmware_vcenter_storage_adapter_inventory_collection_pipelinevmware_vcenter_vm_inventory_collection_pipelinevcenter_vcenter_src_name_inventory_data_exec_pipeline
4.6.2 Discovering Linux and Windows Servers
1. Add the master dataset – windows_linux_master
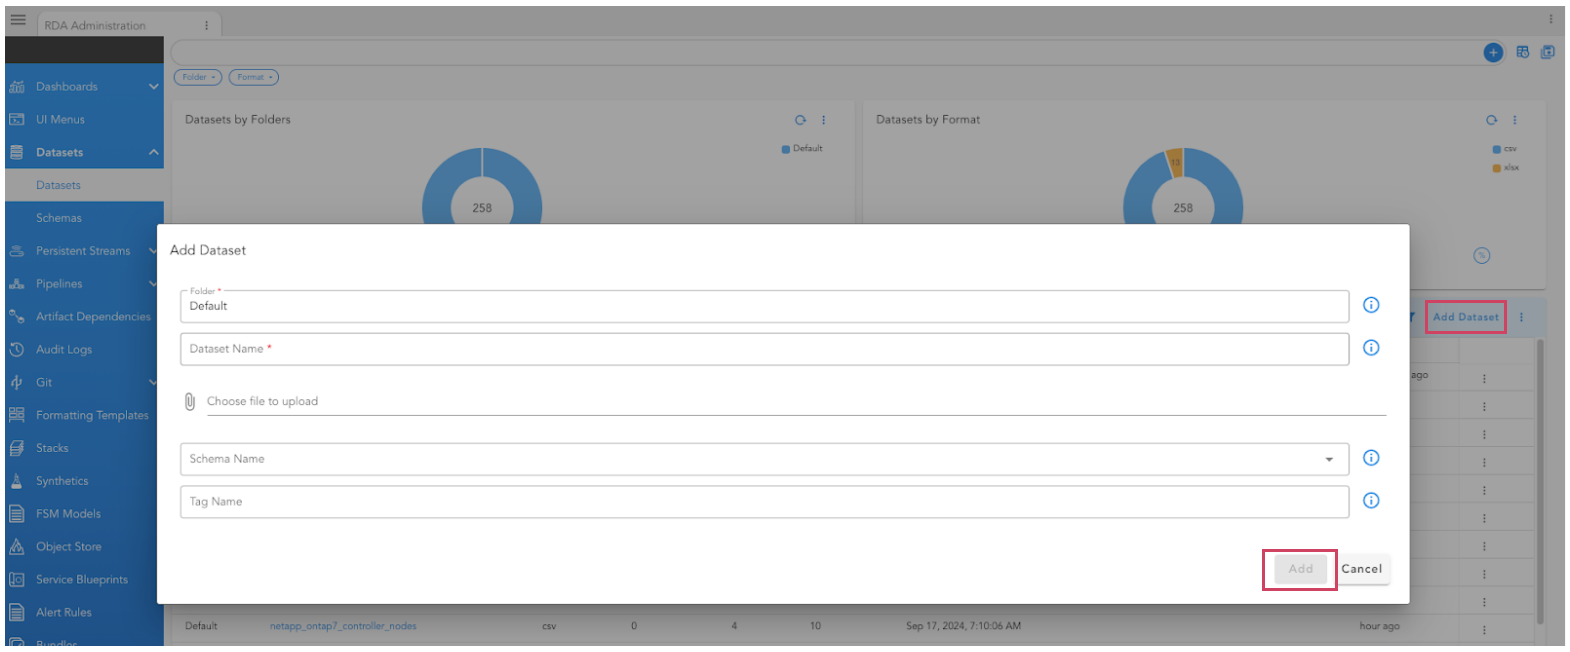
Login to UI and Click on Configuration → RDA Administration → click on Datasets
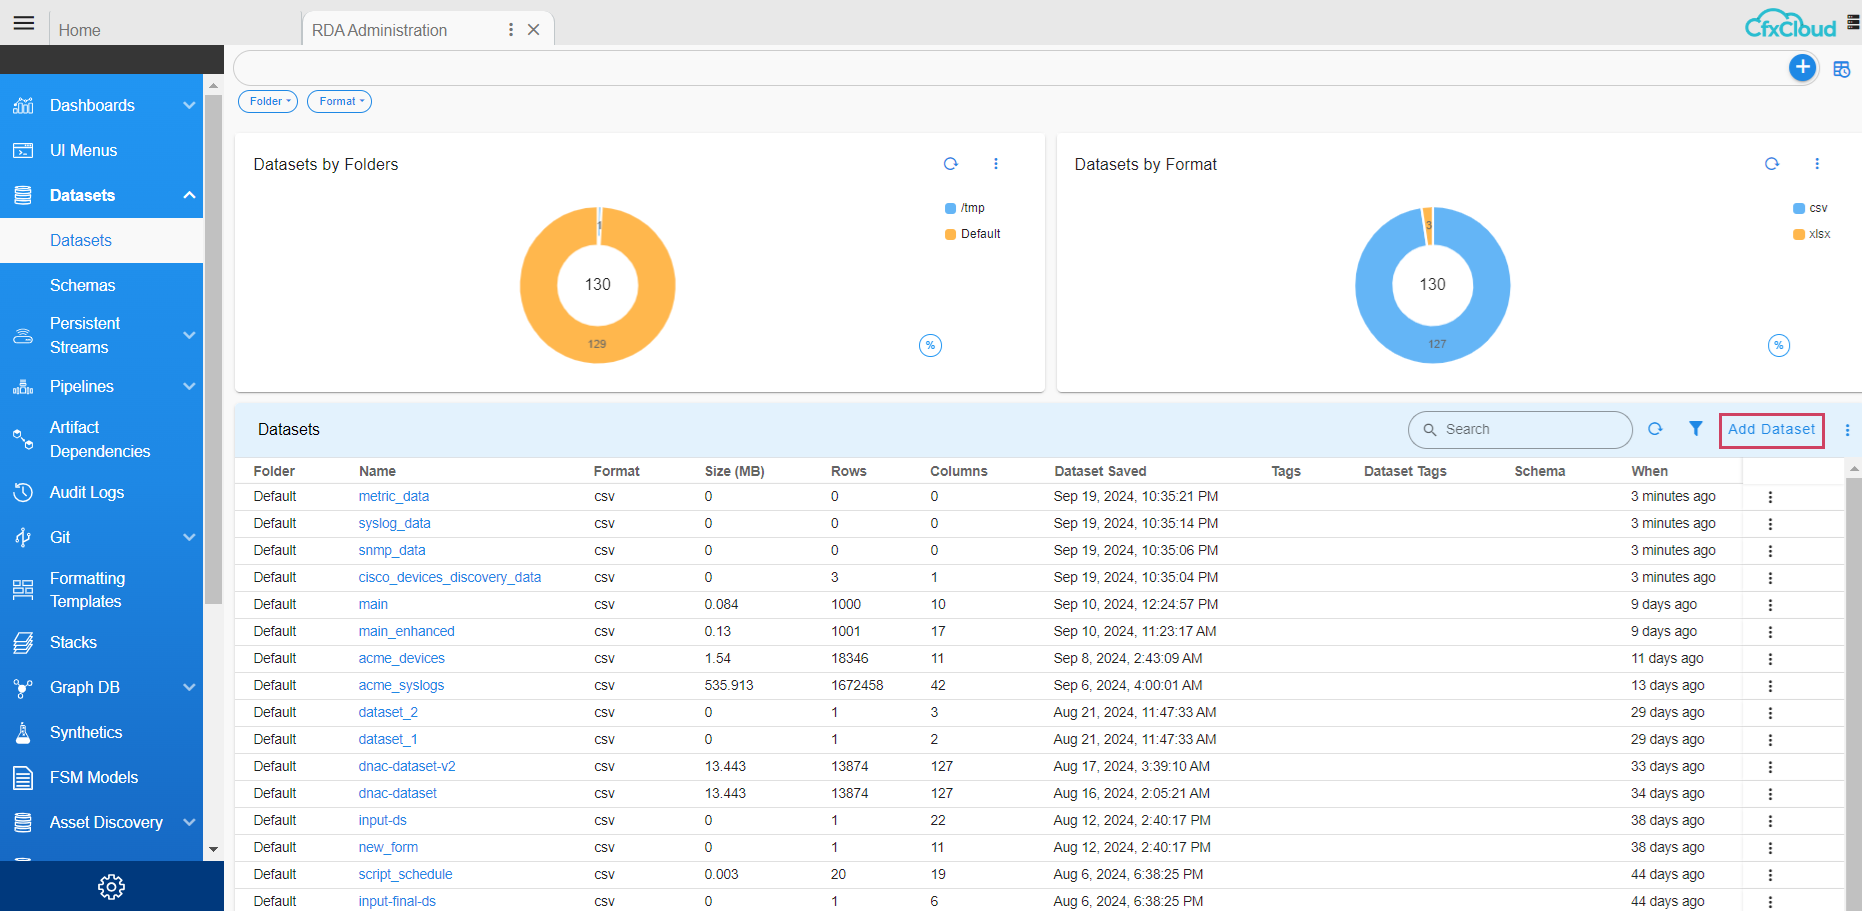
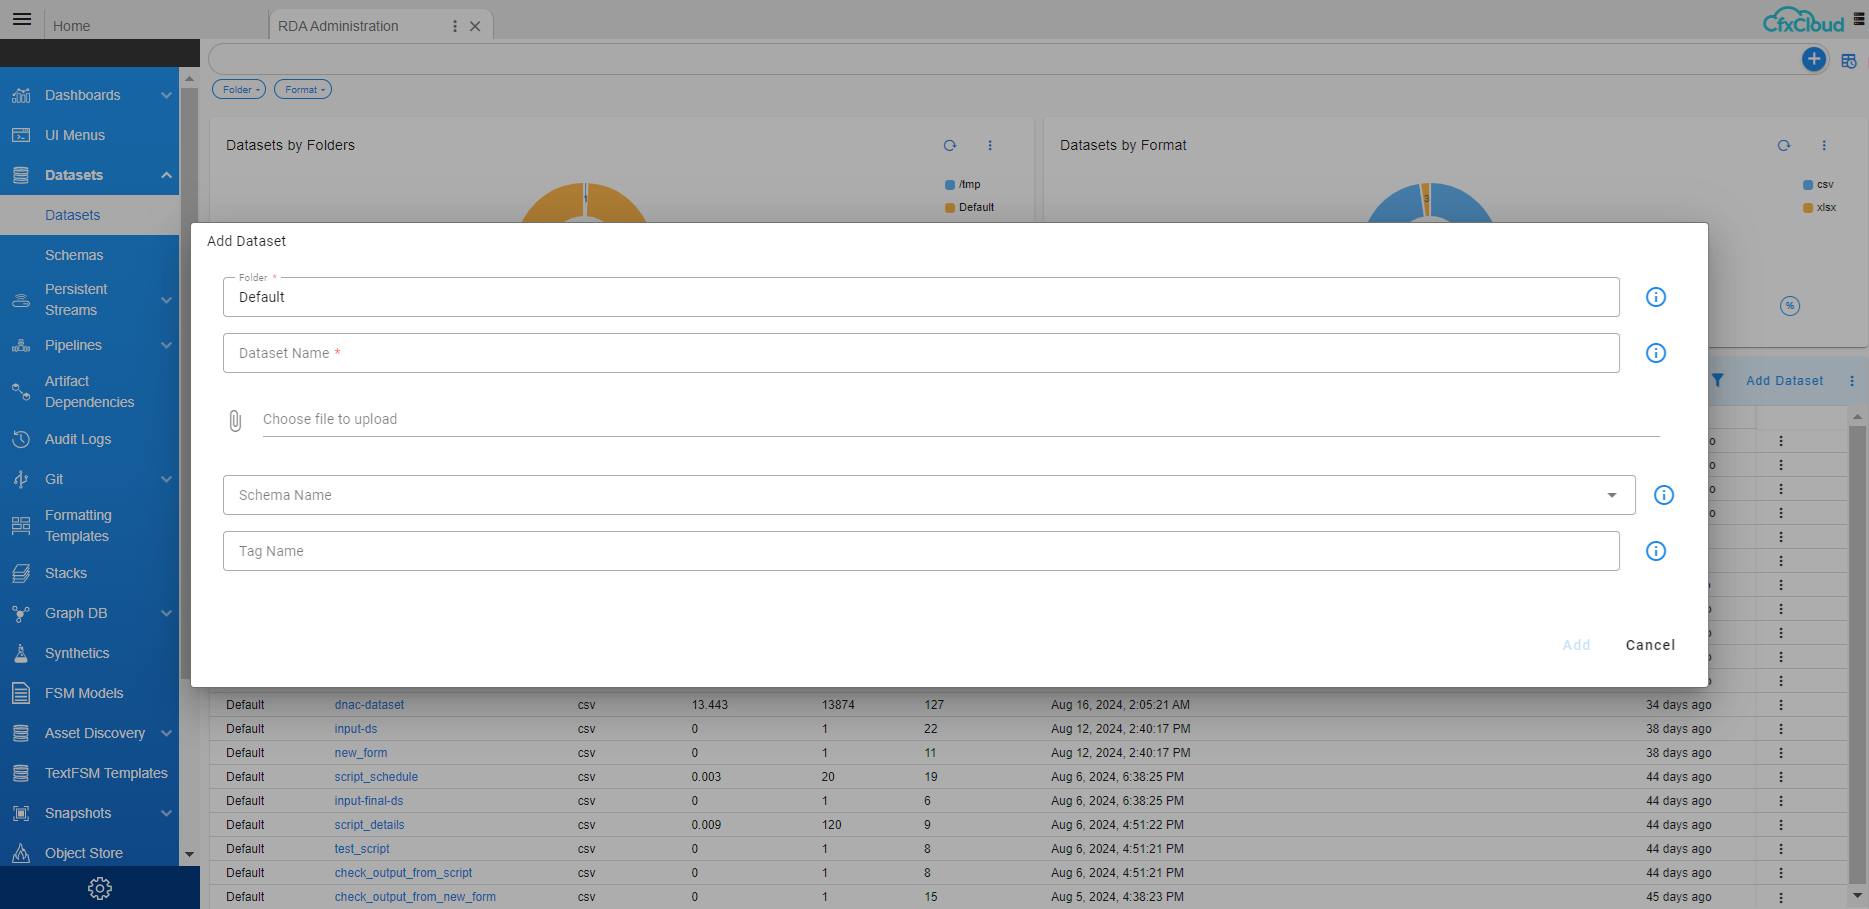
click on Add Dataset and provide name as “windows_linux_master” select the file which has windows and linux servers details --> click on Add
2. Add the Linux source credentials and check connectivity
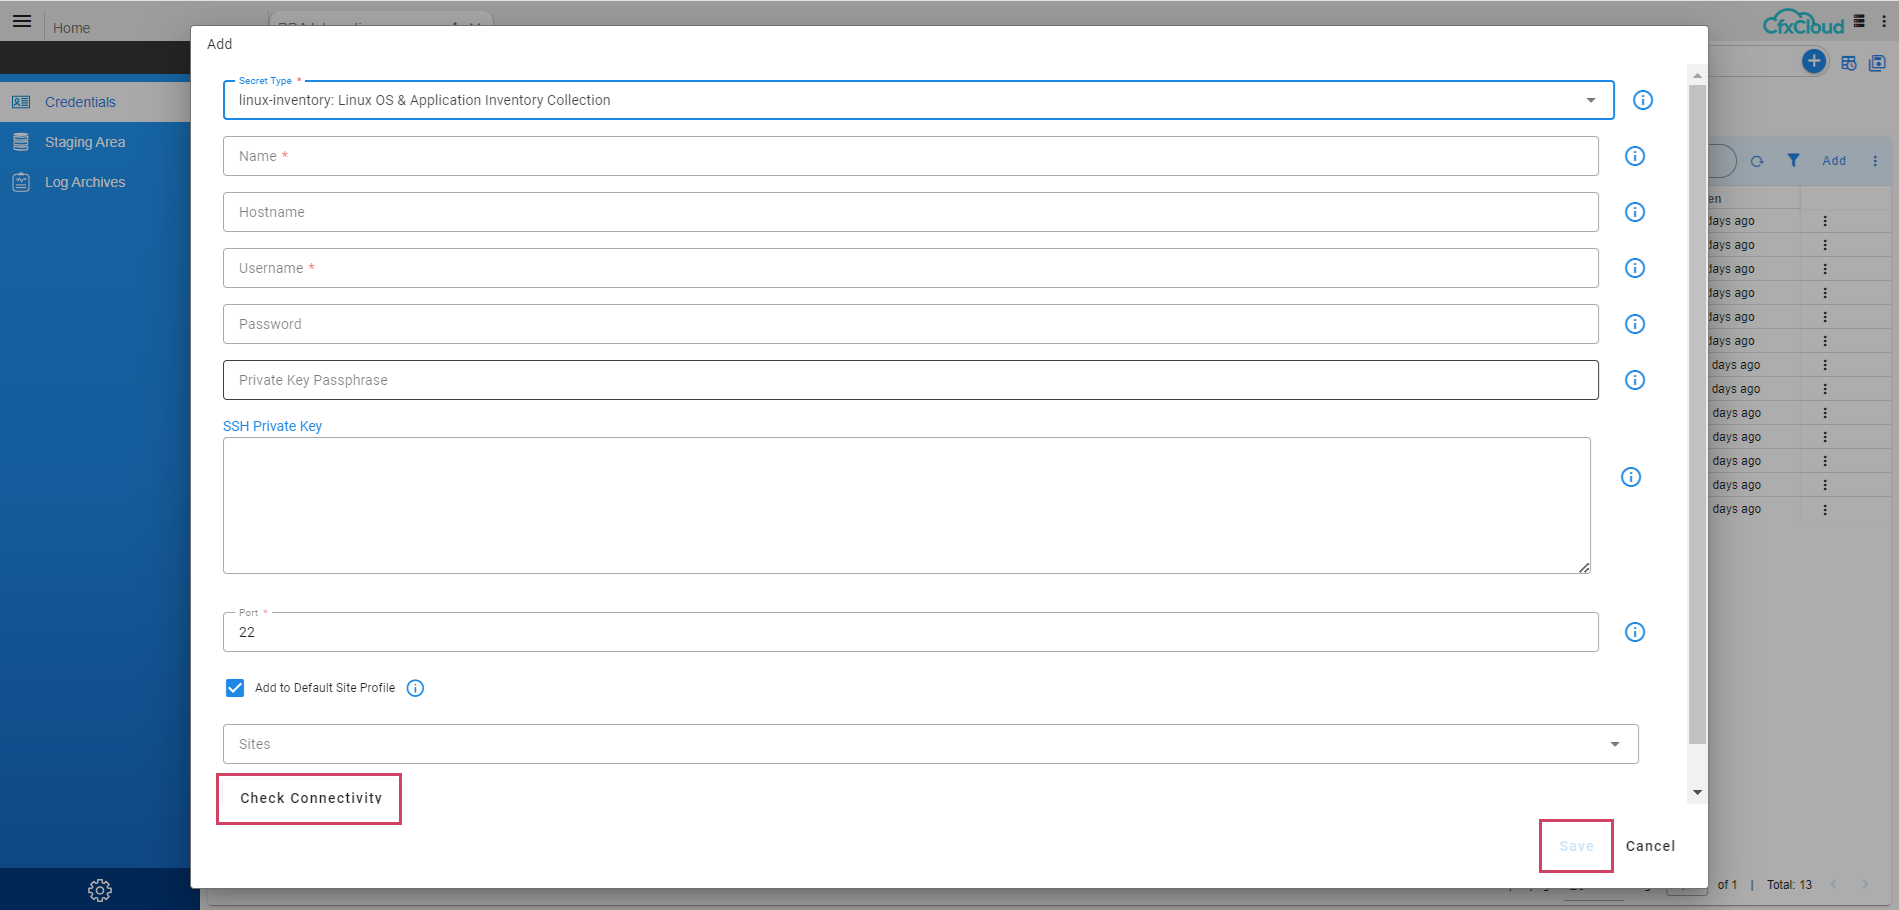
- Click on Configuration → RDA Integrations → Click on Credentials → click on Add Select credentials type as linux-inventory: Linux OS & Application Inventory Collection and provide below details
Credential Name: linux (Name should be same like mentioned here)
Hostname: IP address of linux server
Username: xxxxxxxx
Password: xxxxxxxxx
Site: worker site
Click on Check connectivity and click on Save to Save the credentials
3. Add the Windows source credentials and check connectivity
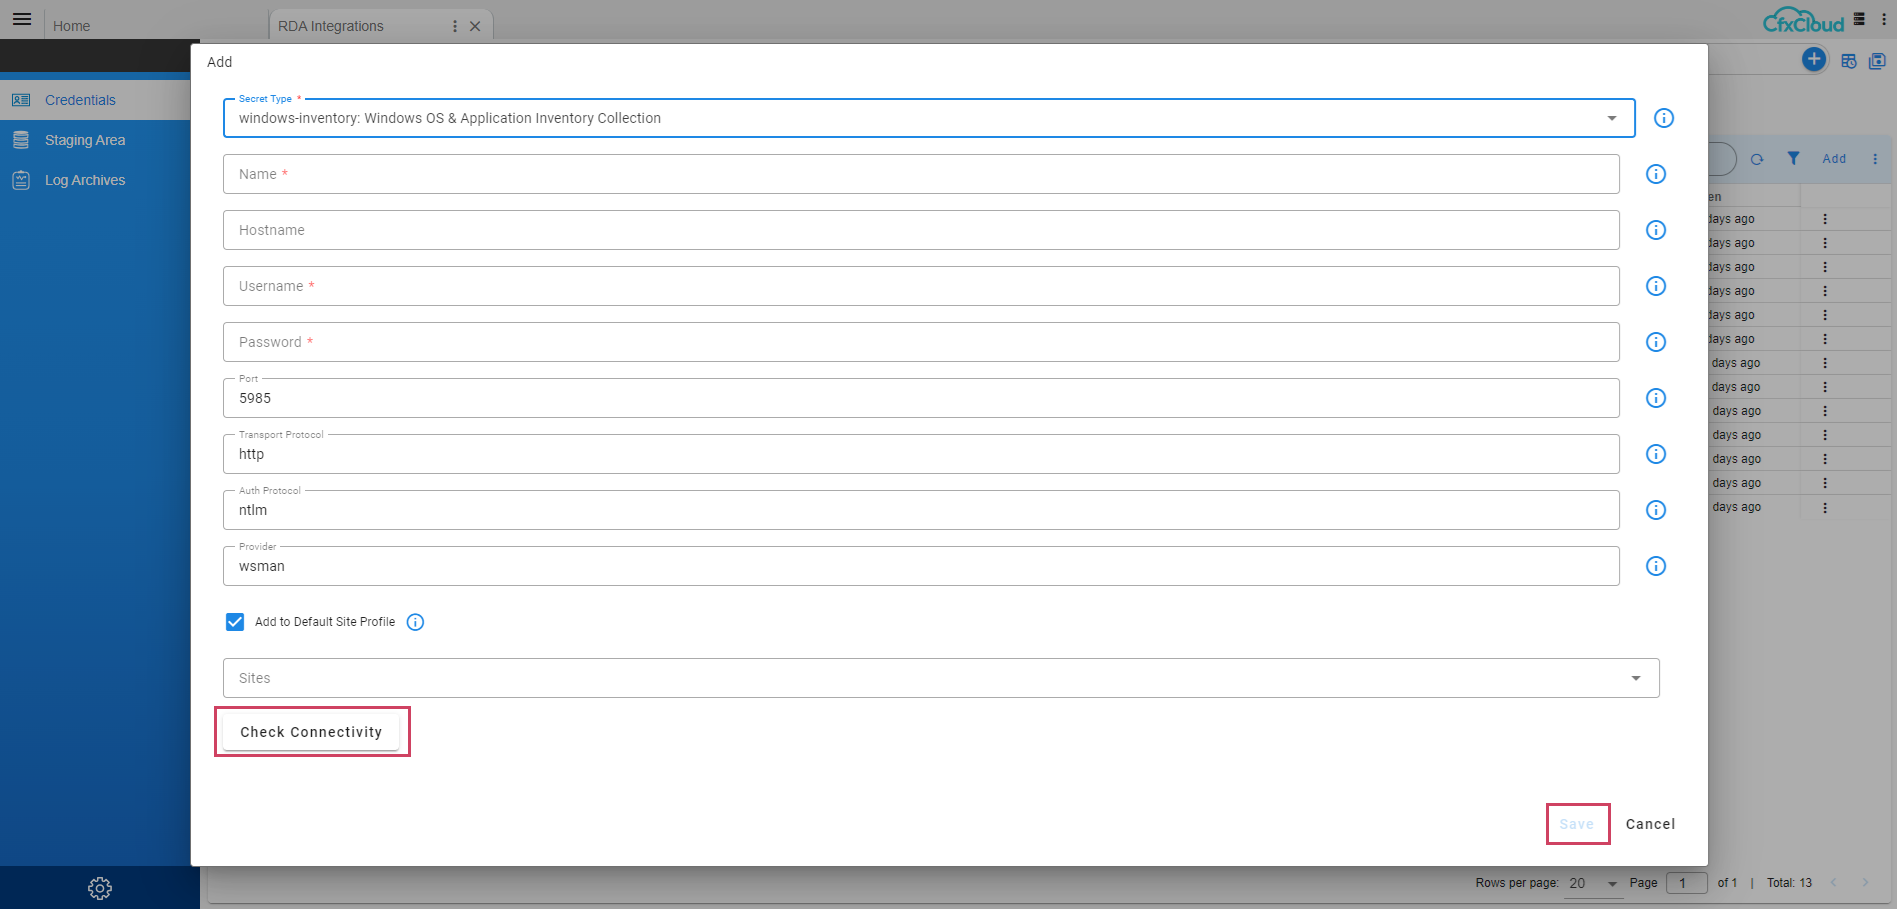
Click on Configuration → RDA Integrations → Click on Credentials → click on Add Select credentials type as windows-inventory: Windows OS & Application Inventory Collection and provide below details
Credential Name: windows-inventory (Name should be same like mentioned here)
Hostname: IP address of windows server
Username: xxxxxxxx
Password: xxxxxxxxx
Port: 5985/5986
Transport Protocol: http/https
Auth Protocol: ntlm
Provider: wsman
Site: worker site
Click on Check Connectivity and click on Save to save the credentials
4. Add the opensearch credentials and check connectivity
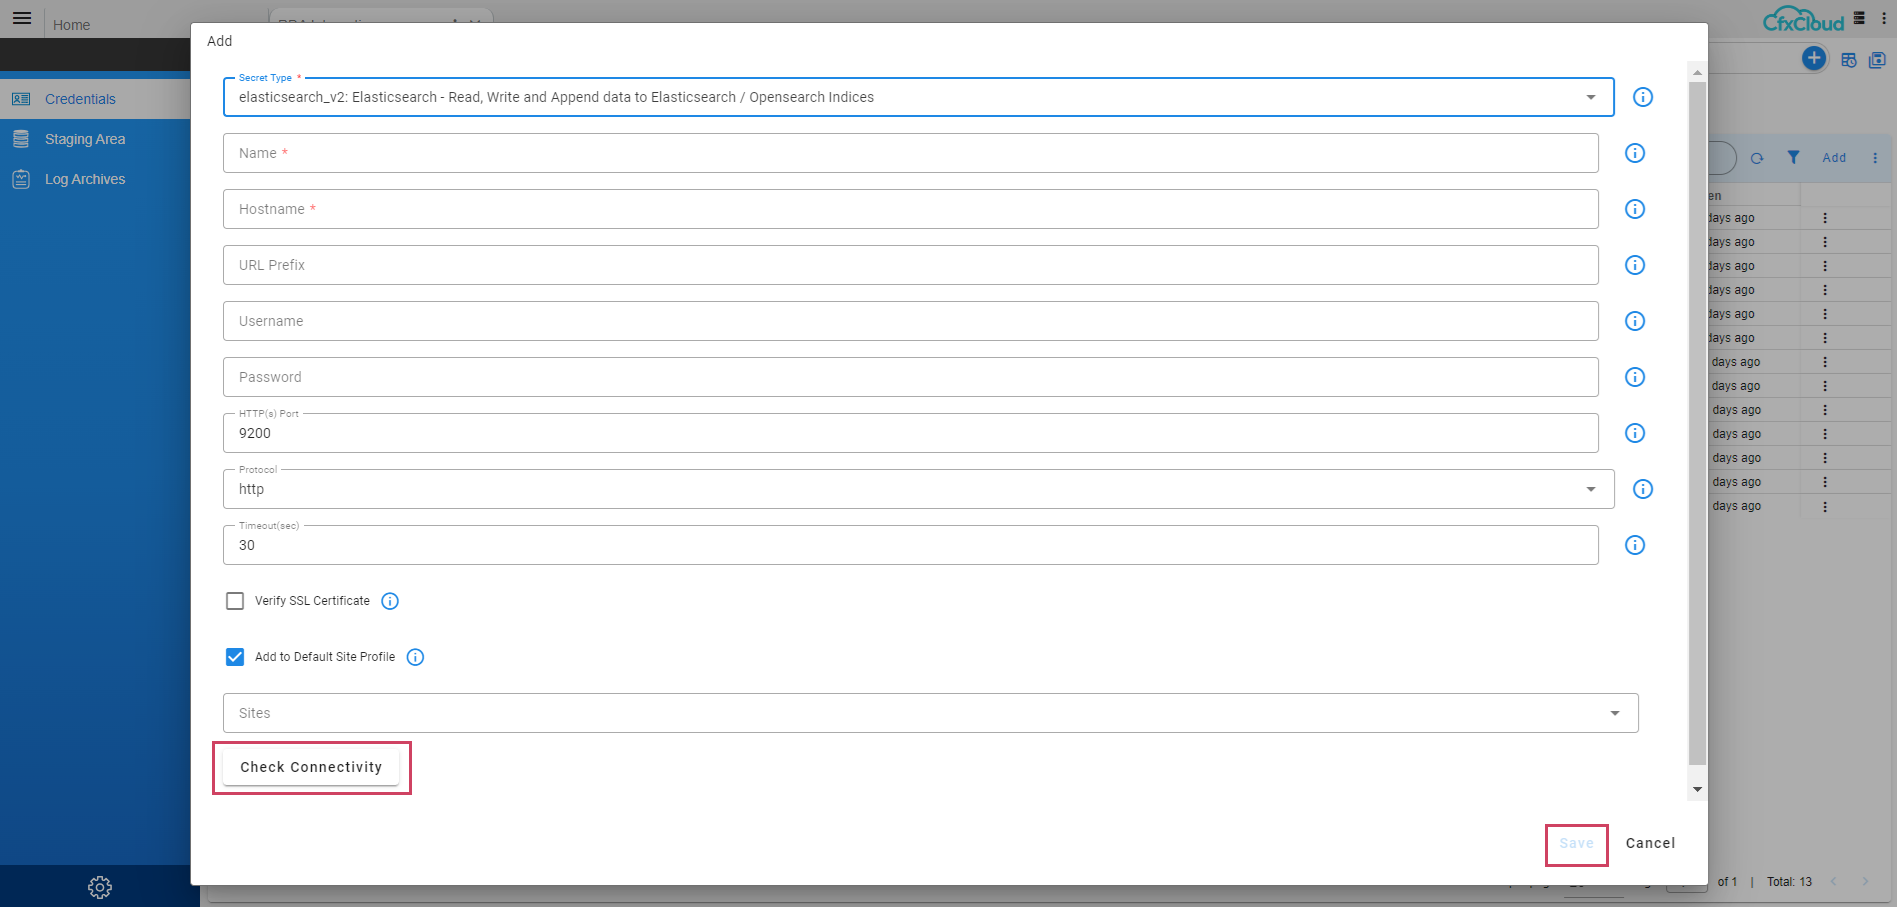
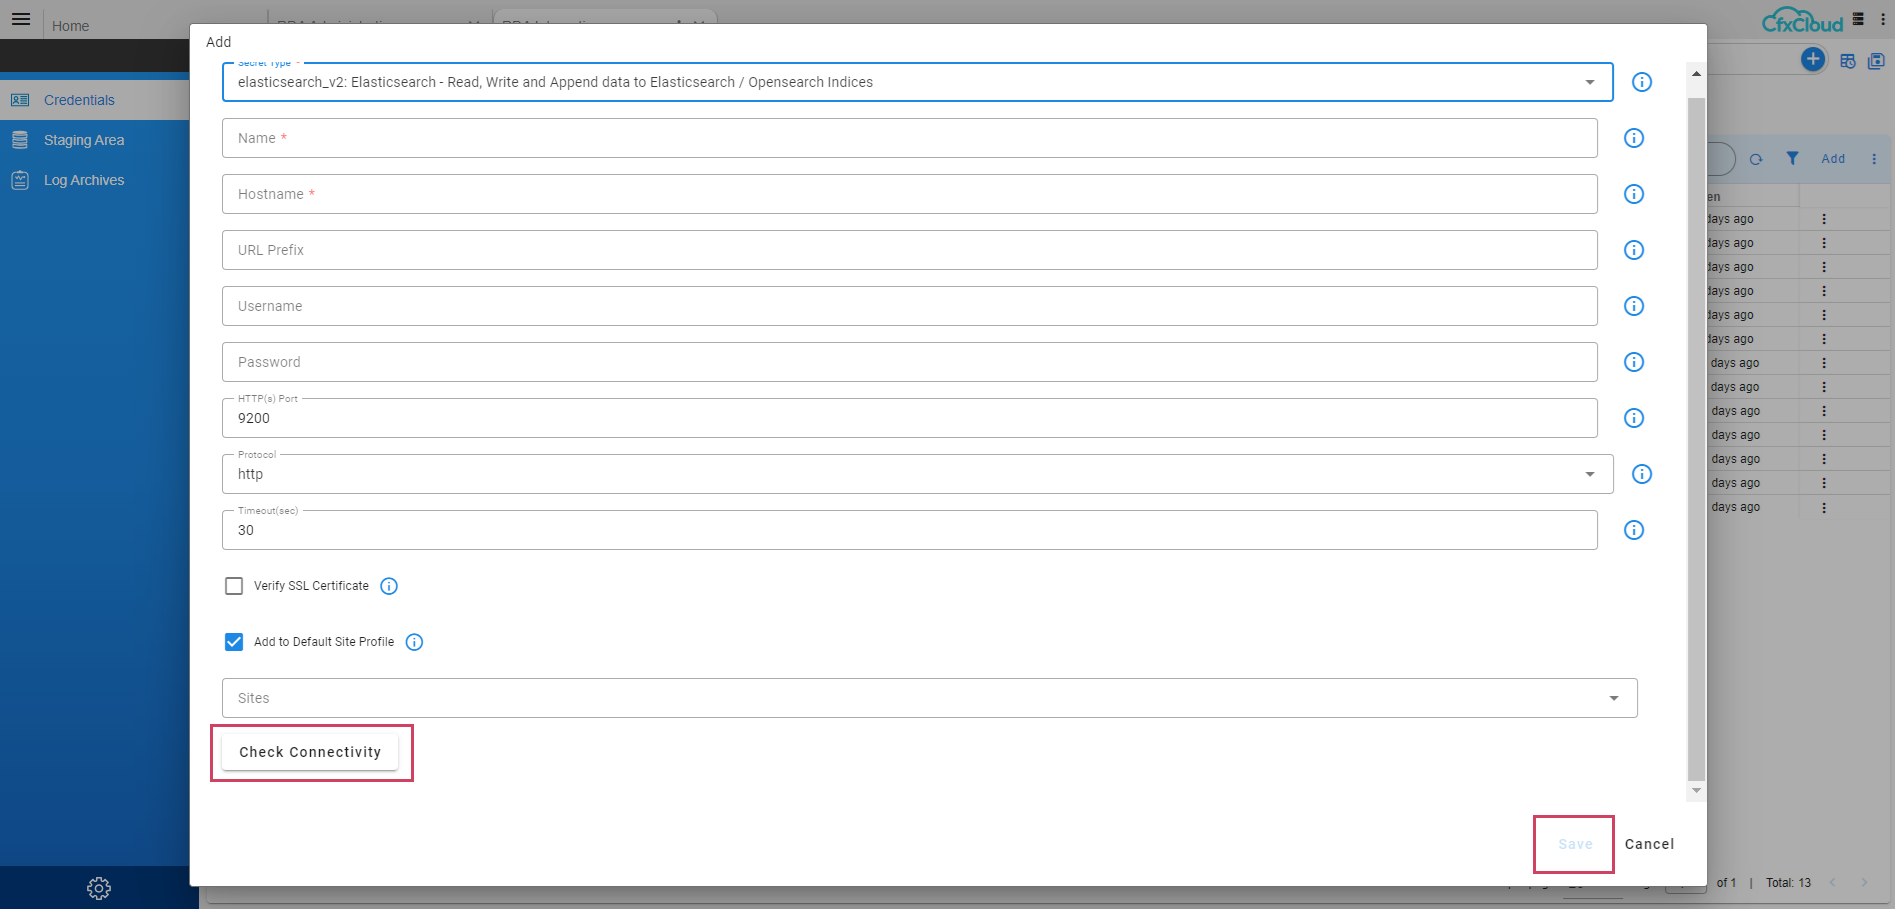
Click on Configuration → RDA Integrations → Click on Credentials → click on Add Select elasticsearch_v2 : Elastic search – Read write and provide below details
Name: opensearch
Hostname : IP Address
url_prefix : leave blank
username: xxxxxxxx
password: xxxxxxxx
http(s) port: 9200 default
protocol : https
worker site:
Click on Check Connectivity and click on Save to save the credentials
5. Add Diagnostictools Credential
Click on Configuration → RDA Integrations → Click on Credentials → click on Add Select credentials type as diagnostictools and provide below details
Name: diagnostictools
Site: worker site
Click on Save to save the credentials
6. Create Persistent Streams for linux
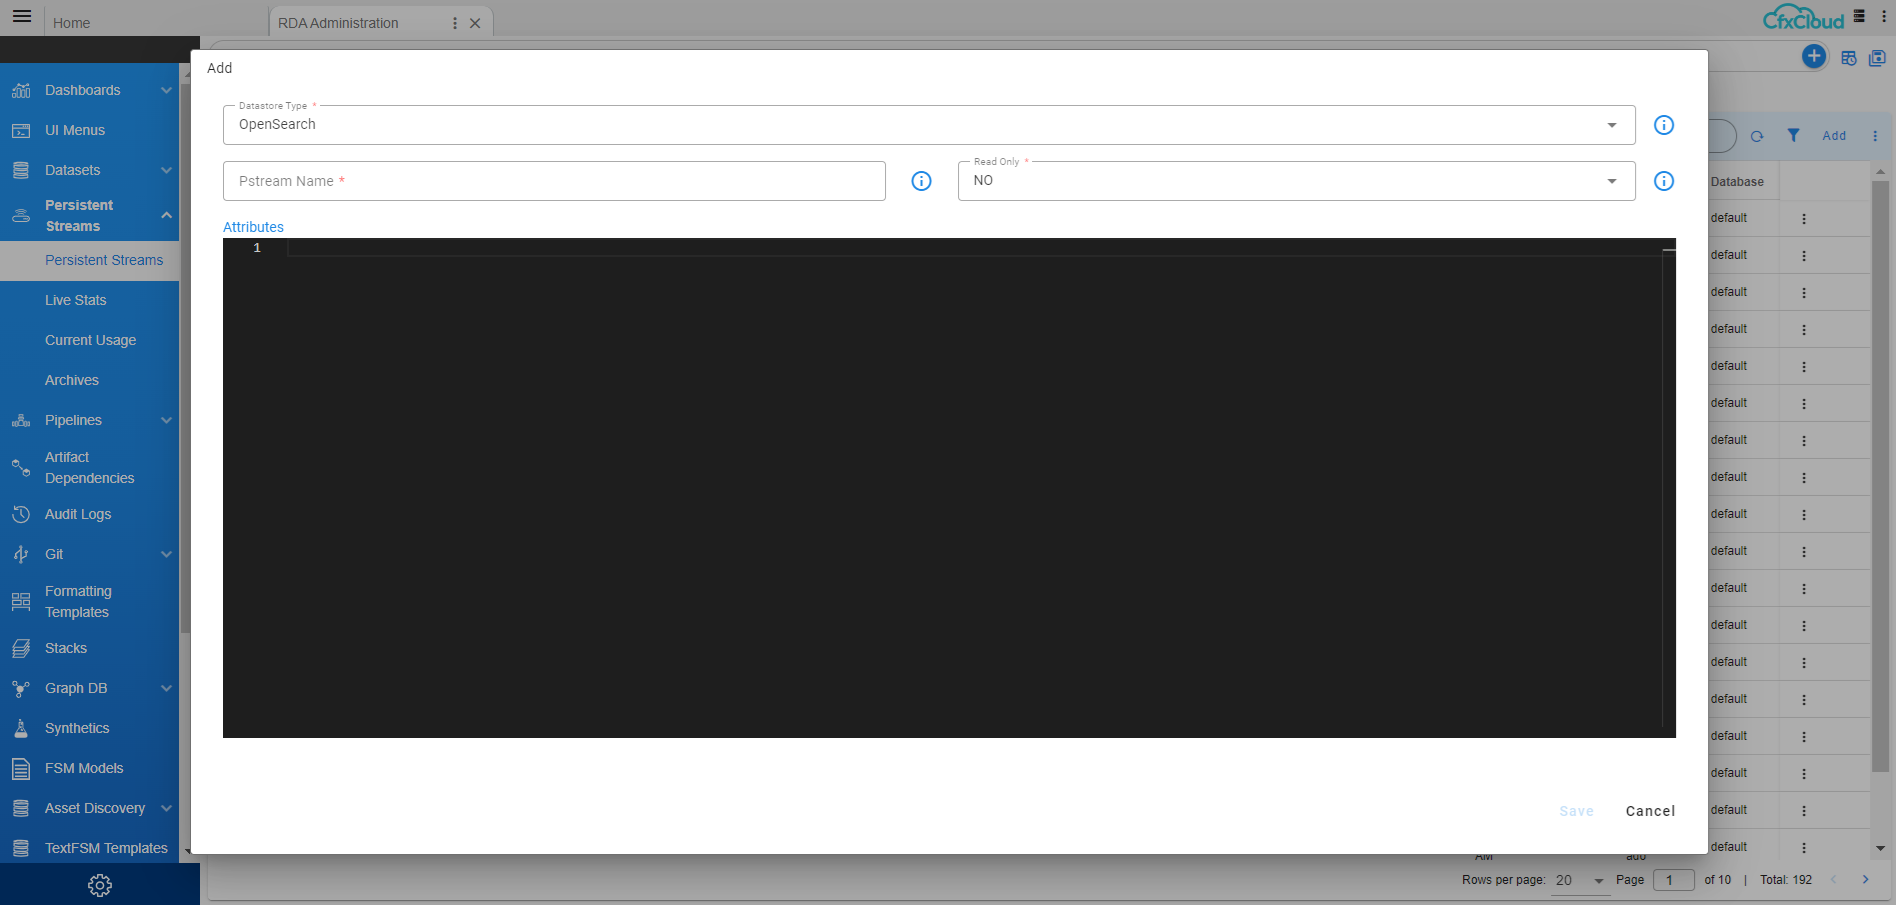
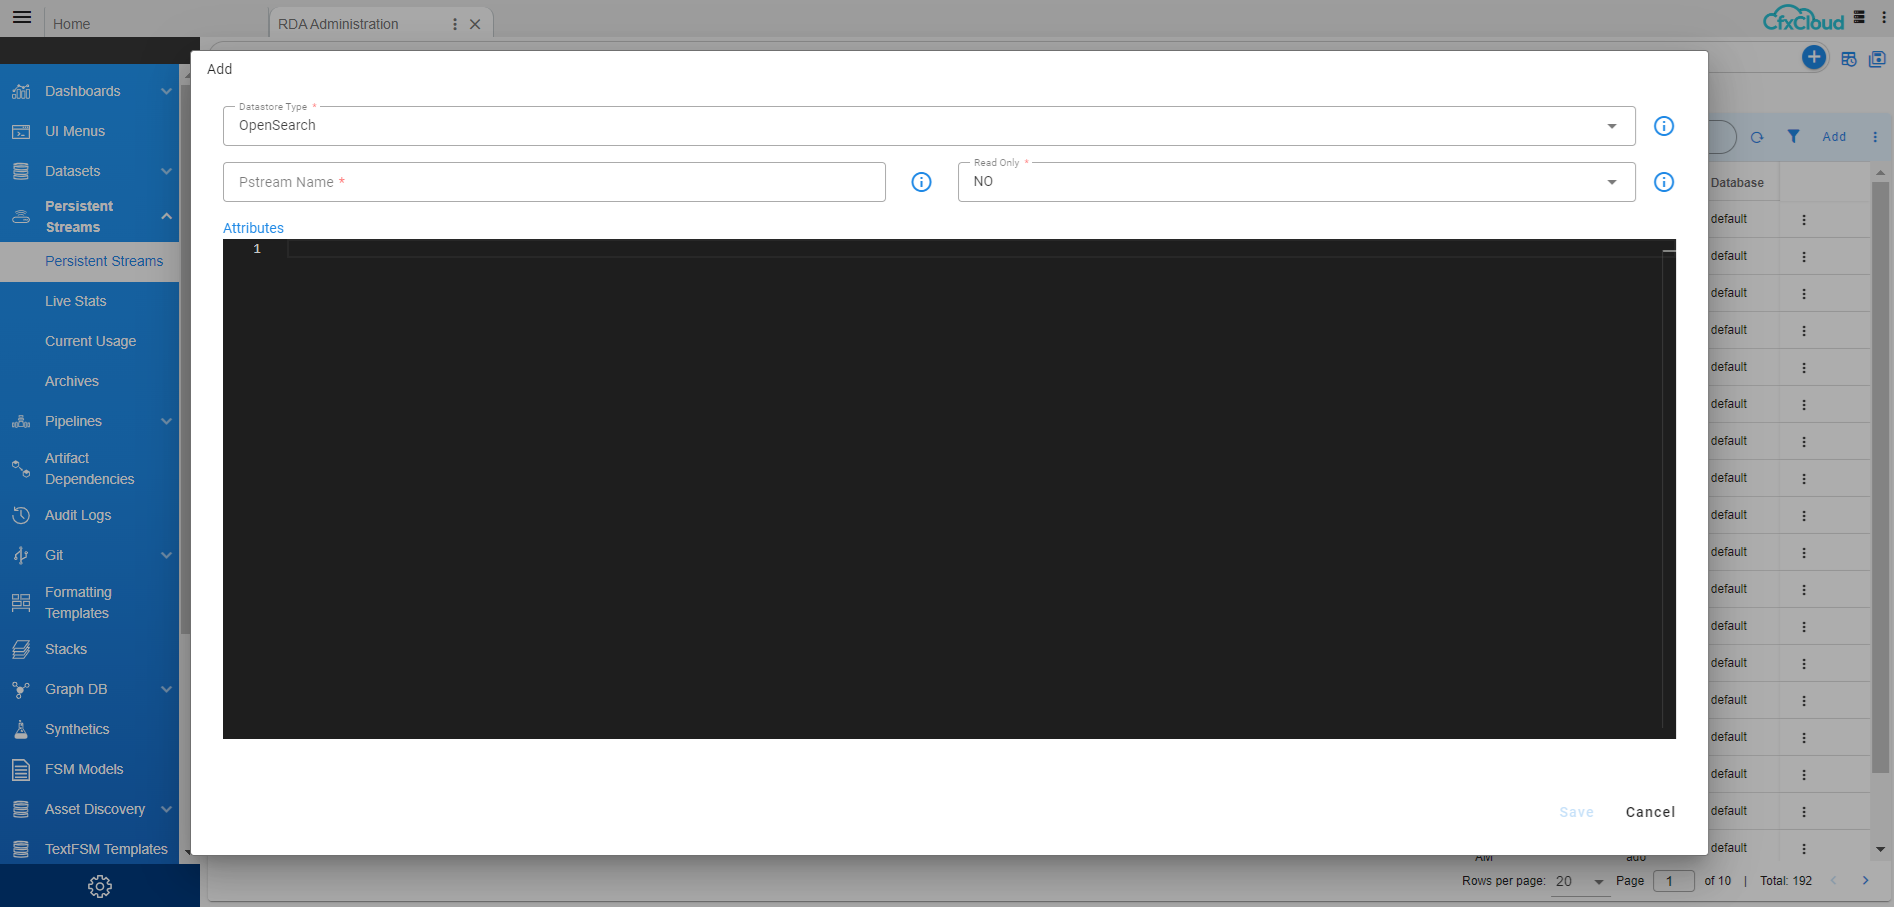
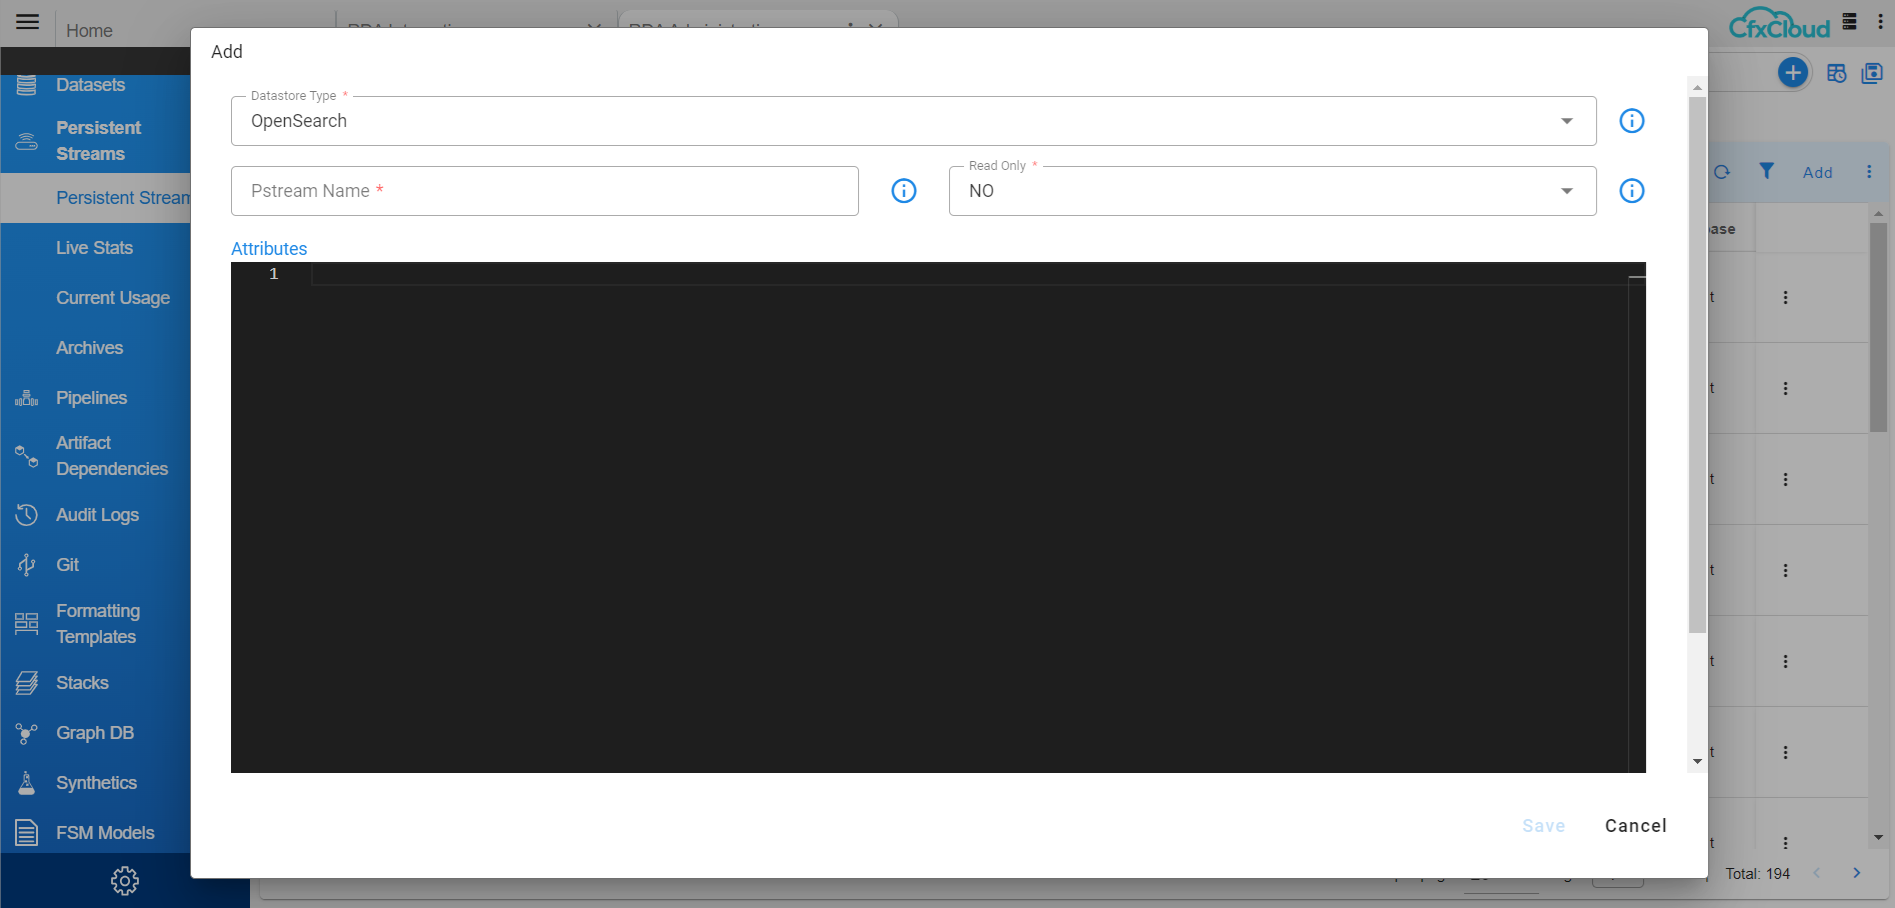
Click on Configuration → RDA Administration → Persistent Streams → Add
{
    "unique_keys": [
        "unique_id"
    ],
    "search_case_insensitive": true,
    "_settings": {
        "number_of_shards": 3,
        "number_of_replicas": 1,
        "refresh_interval": "30s"
    }
}
{
    "unique_keys": [
        "unique_id"
    ],
    "timestamp": "collection_timestamp",
    "retention_days": 7,
    "search_case_insensitive": true,
    "_settings": {
        "number_of_shards": 3,
        "number_of_replicas": 1,
        "refresh_interval": "60s"
    }
}
{
    "unique_keys": [
        "unique_id"
    ],
    "default_values": {
        "iconURL": "Not Available"
    },
    "_settings": {
        "number_of_shards": 3,
        "number_of_replicas": 1,
        "refresh_interval": "15s"
    }
}
{
    "unique_keys": [
        "unique_id"
    ],
    "search_case_insensitive": true,
    "_settings": {
        "number_of_shards": 3,
        "number_of_replicas": 1,
        "refresh_interval": "30s"
    }
}
{
    "unique_keys": [
        "unique_id"
    ],
    "search_case_insensitive": true,
    "_settings": {
        "number_of_shards": 3,
        "number_of_replicas": 1,
        "refresh_interval": "30s"
    }
}
{
    "unique_keys": [
        "unique_id"
    ],
    "search_case_insensitive": true,
    "_settings": {
        "number_of_shards": 3,
        "number_of_replicas": 1,
        "refresh_interval": "30s"
    }
}
4.6.3 Discovering Network Devices
1. Add firewall_master_list.csv file to dataset, Click on Configuration -> RDA Administration -> Datasets -> Add Dataset and provide below details
Folder : Default
Dataset name : firewall_master_list (Name should be same like mentioned here)
Choose csv file :
Click on Add
2. Add SNMP Credentials
- Login to UI with tenant admin user
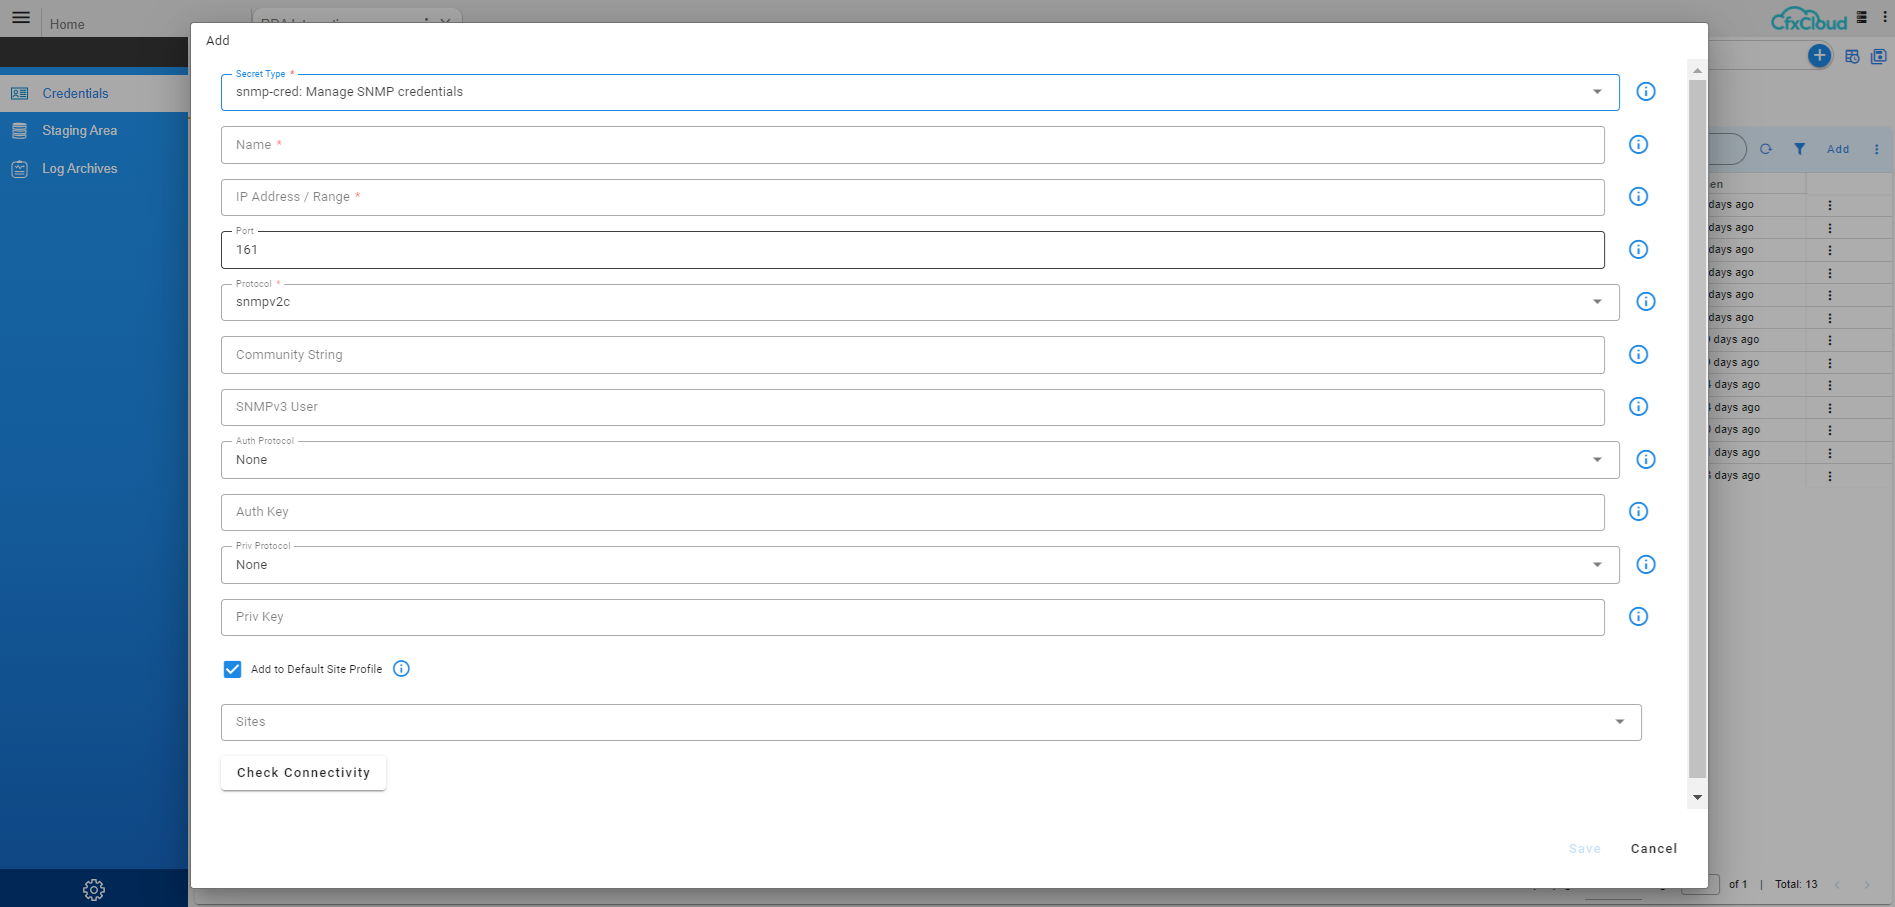
Click on Configuration → RDA Integrations → Click on Credentials → click on Add Select credentials type as device-snmp-v1v2:manage CFX Edgecollector Agent’s SNMP Credentials source and provide below details
Credential Name: - snmp-v1v2 (Name should be same like mentioned here)
Hostname: IP address of SNMP
Port: 161
Protocol : leave as default
Read Community : xxxxxx (This we will update once client provided the details)
Click on Save Check Connectivity not applicable
3. Add rda agent on the credentials window
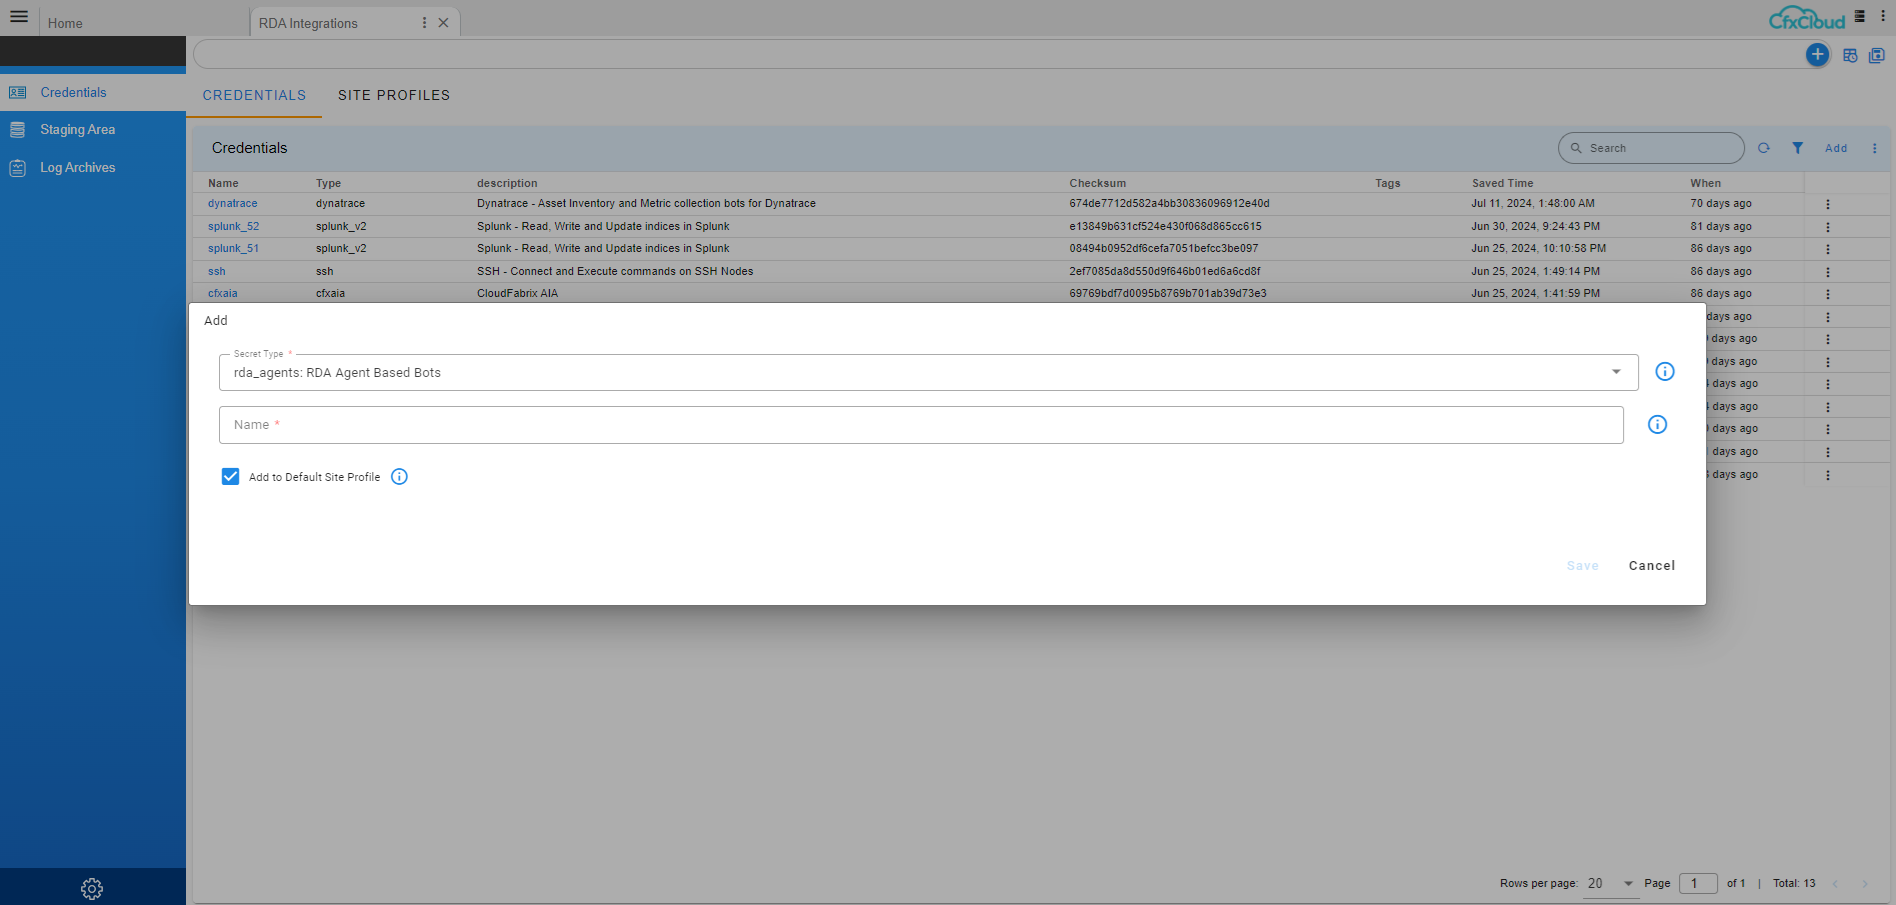
Click on Configuration → RDA Integrations → Click on Credentials → click on Add Select rda_agents Name: agent click Save
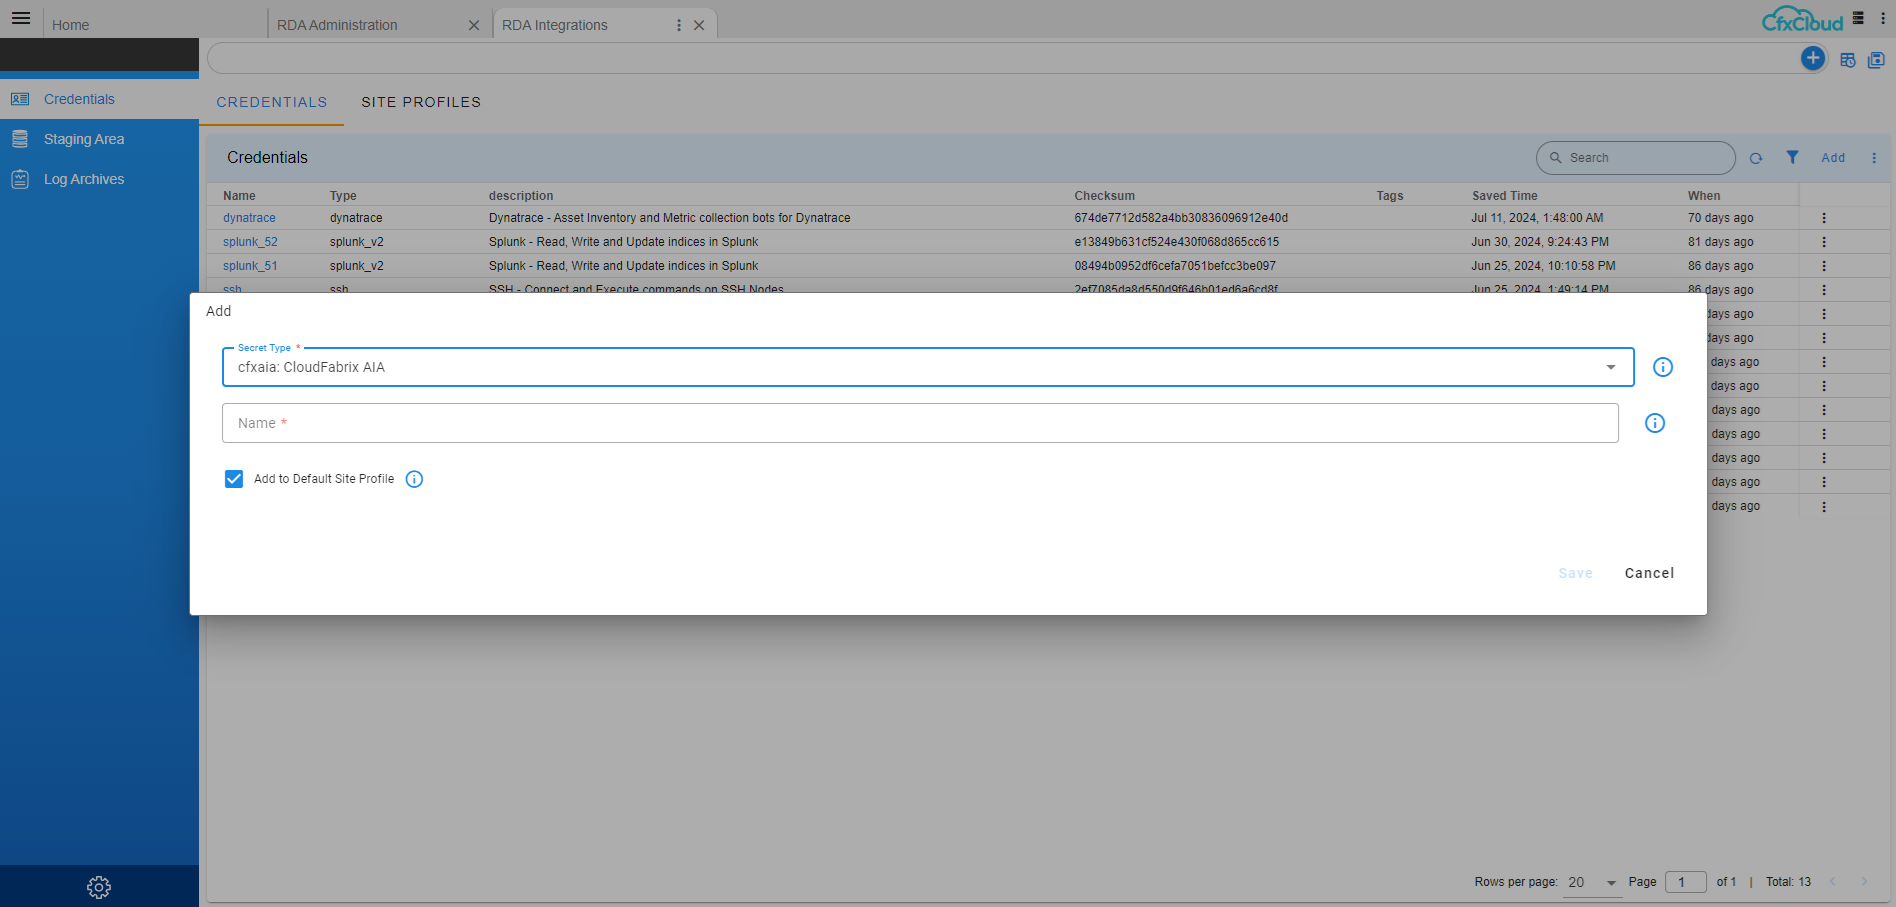
4. Click on Configuration → RDA Integrations → Click on Credentials → click on Add Select cfx-aia: CloudFabrix AIA Name: cfxaia click Save
5. Click on Configuration → RDA Integrations → Click on Credentials → click on Add Select elasticsearch_v2 : Elastic search – Read write and provide below details
Name: opensearch
Hostname : IP Address
url_prefix : leave blank
username: xxxxxxxx
password: xxxxxxxx
http(s) port: 9200 default
protocol : https
worker site:
Click Check Connectivity and Save
6. Add PStreams
Click Configuration → RDA Administration → Persistent Streams → Click on Add Datastore Type : Opensearch click Save
{
    "unique_keys": [
        "unique_id"
    ],
    "search_case_insensitive": true,
    "_settings": {
        "number_of_shards": 3,
        "number_of_replicas": 1,
        "refresh_interval": "30s"
    }
}
datastore type : opensearch
pstream name : master-dashboard-discovery
{
    "unique_keys": [
        "unique_id"
    ],
    "search_case_insensitive": true,
    "_settings": {
        "number_of_shards": 3,
        "number_of_replicas": 1,
        "refresh_interval": "30s"
    }
}
datastore type : opensearch
pstream name : master-dashboard-discovery-deleteme
{
    "unique_keys": [
        "unique_id"
    ],
    "search_case_insensitive": true,
    "_settings": {
        "number_of_shards": 3,
        "number_of_replicas": 1,
        "refresh_interval": "30s"
    }
}
Note
Already added as part of windows/linux inventory, If not added follow above steps and add below content
{
    "unique_keys": [
        "left_id",
        "right_id"
    ],
    "_settings": {
        "number_of_shards": 3,
        "number_of_replicas": 1,
        "refresh_interval": "15s"
    }
}
Note
Already added as part of windows/linux inventory, If not added follow above steps and add below content
{
    "unique_keys": [
        "unique_id"
    ],
    "default_values": {
        "iconURL": "Not Available"
    },
    "_settings": {
        "number_of_shards": 3,
        "number_of_replicas": 1,
        "refresh_interval": "15s"
    }
}
4.6.4 Discovering Other IT Asset Types
Login into the Cfx application
Login to UI with tenant admin user acme@cfx.com

- Please click on the following in order to enter into RDA Integrations Go to Home --> RDA Integrations
- Please click on Add for adding the credentials
Click on Configuration -->RDA Integrations --> Click on Credentials --> click on Add
- Please add the required pstreams
Click on Configuration → RDA Administration → Persistent Streams → Click on Add Datastore Type : Opensearch
- Please add the corresponding pipelines as draft
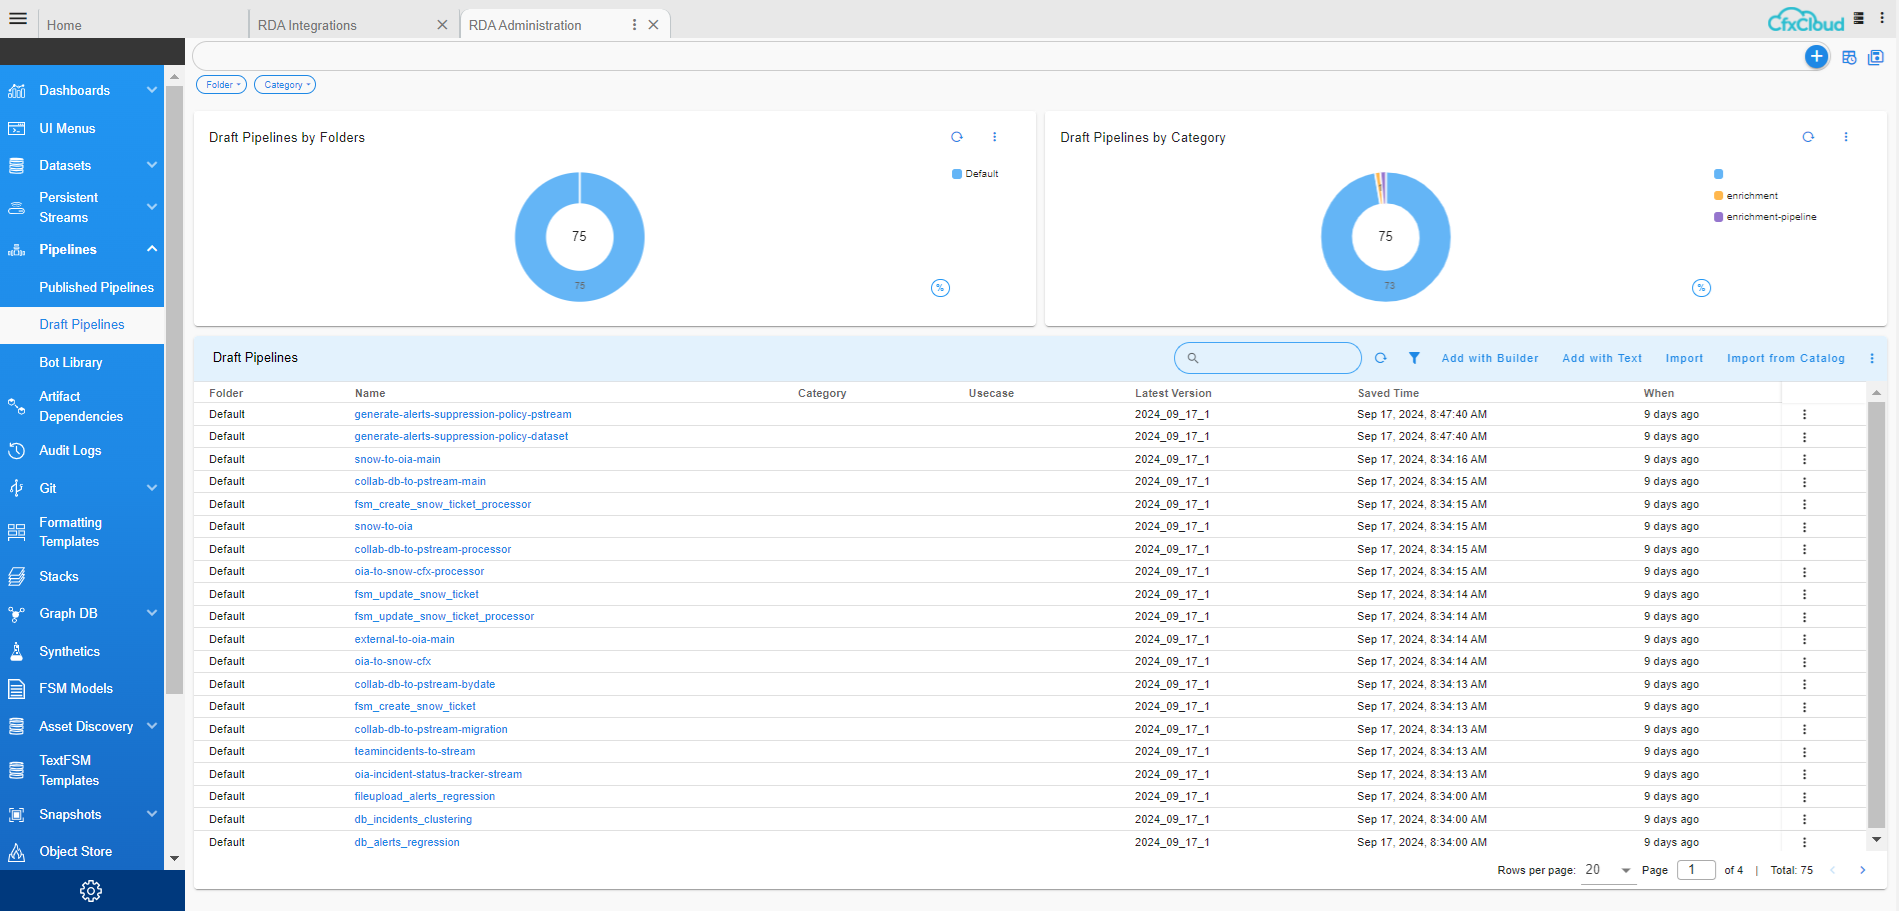
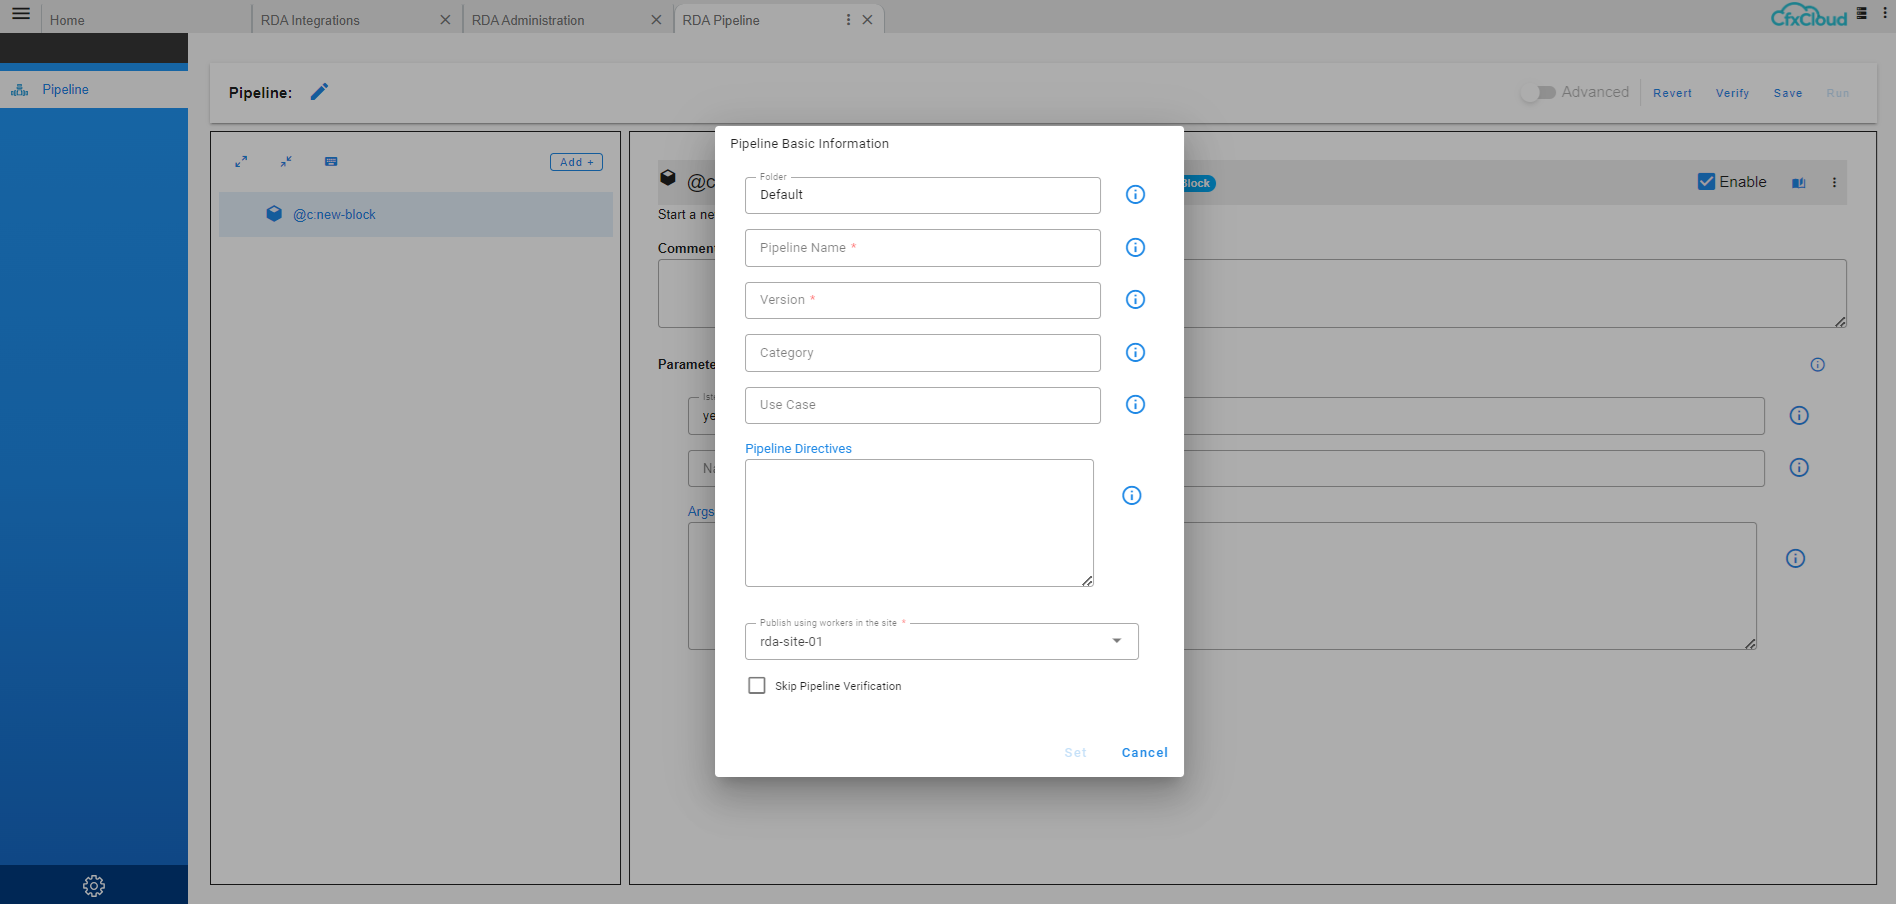
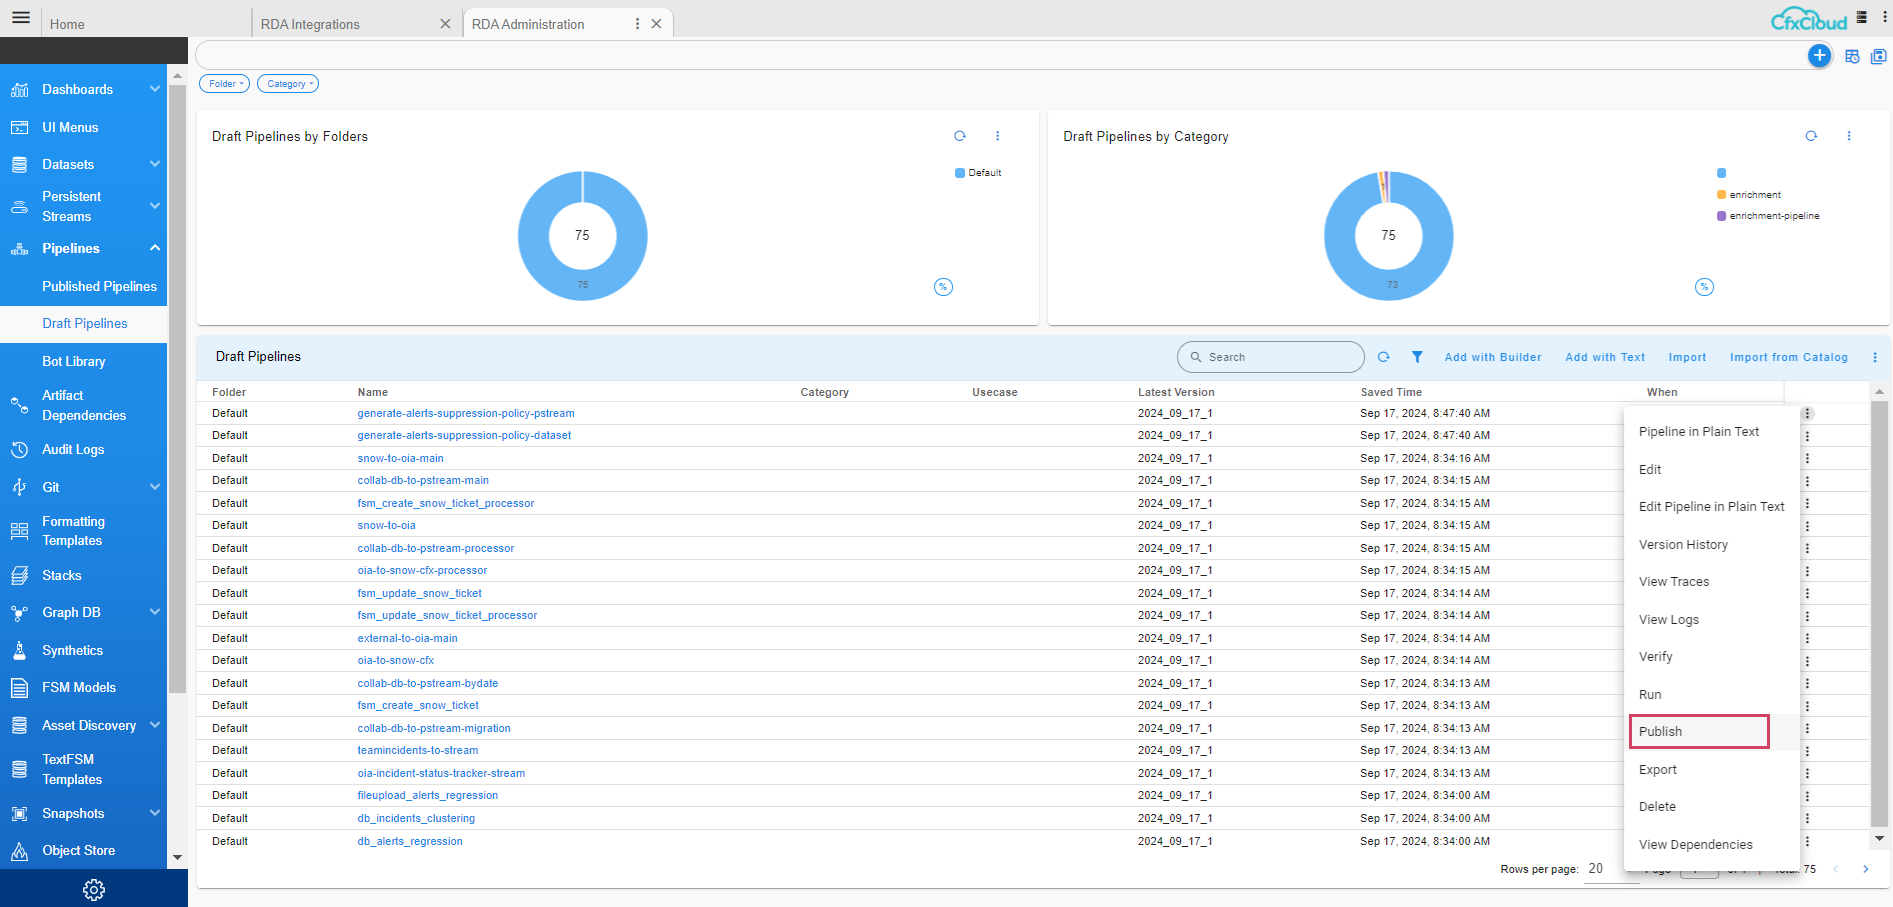
Click on RDA Administration -> Pipelines -> Draft Pipelines Click on Add with Builder
- Please select the corresponding pipeline and publish the respective pipeline
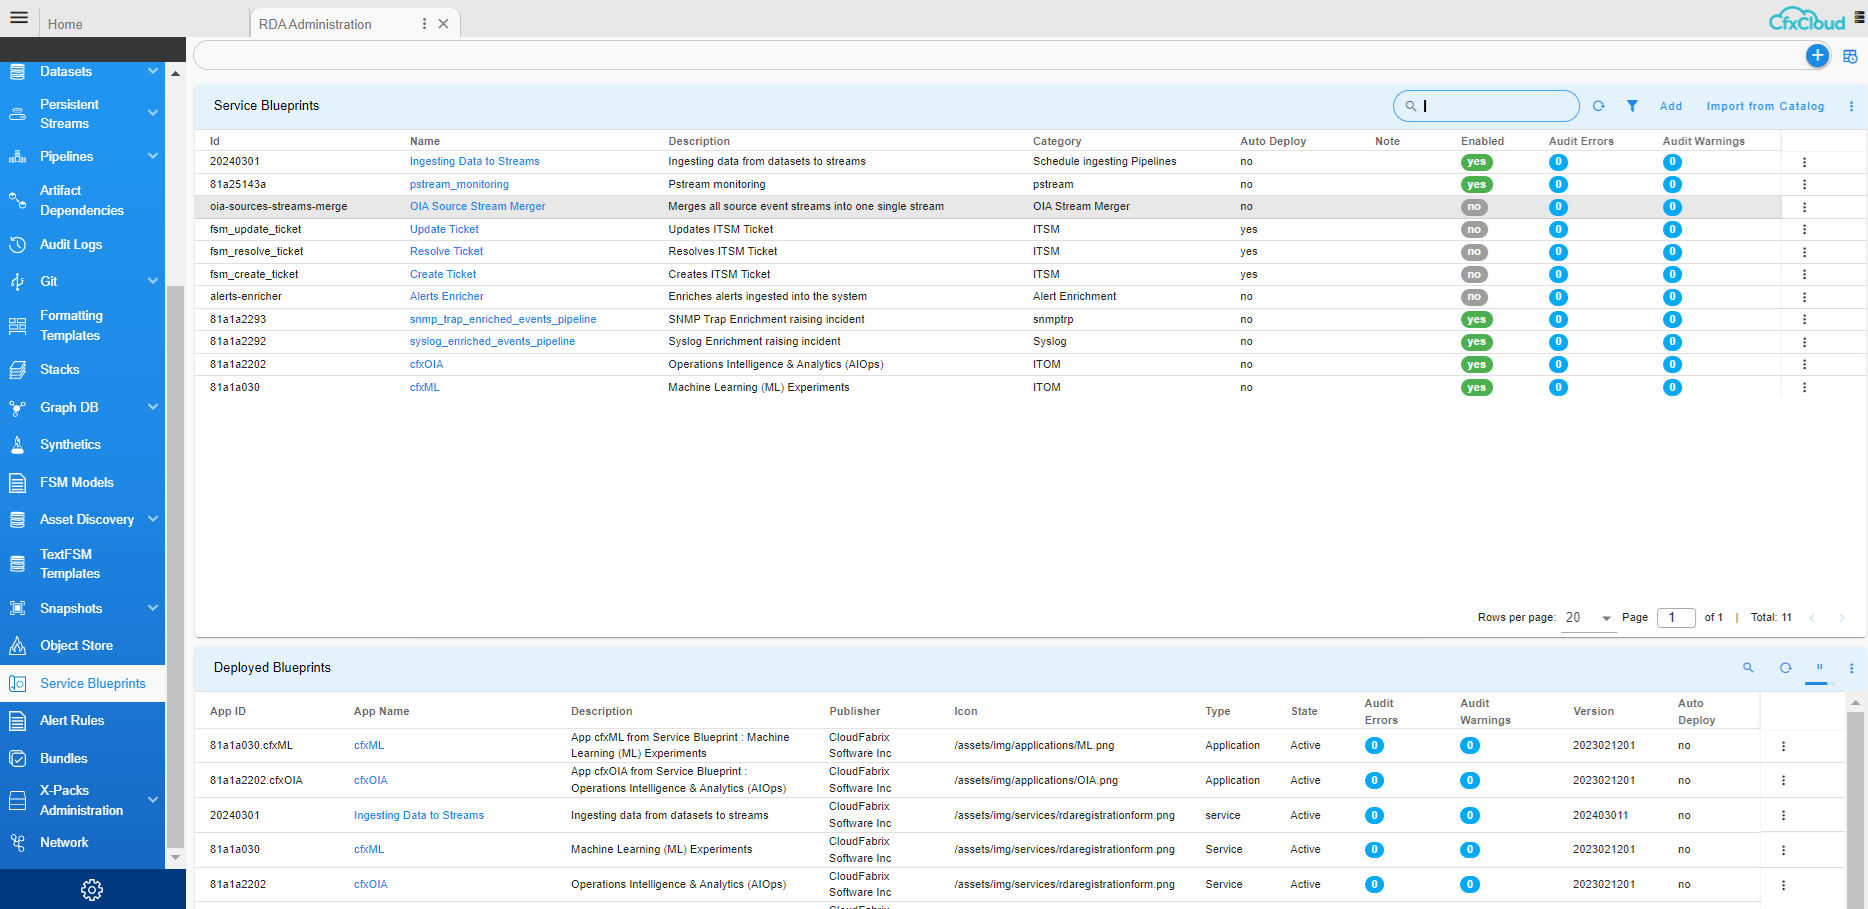
- Please Click on Add and then add the corresponding service blueprint
4.6.5 Performing Customizations
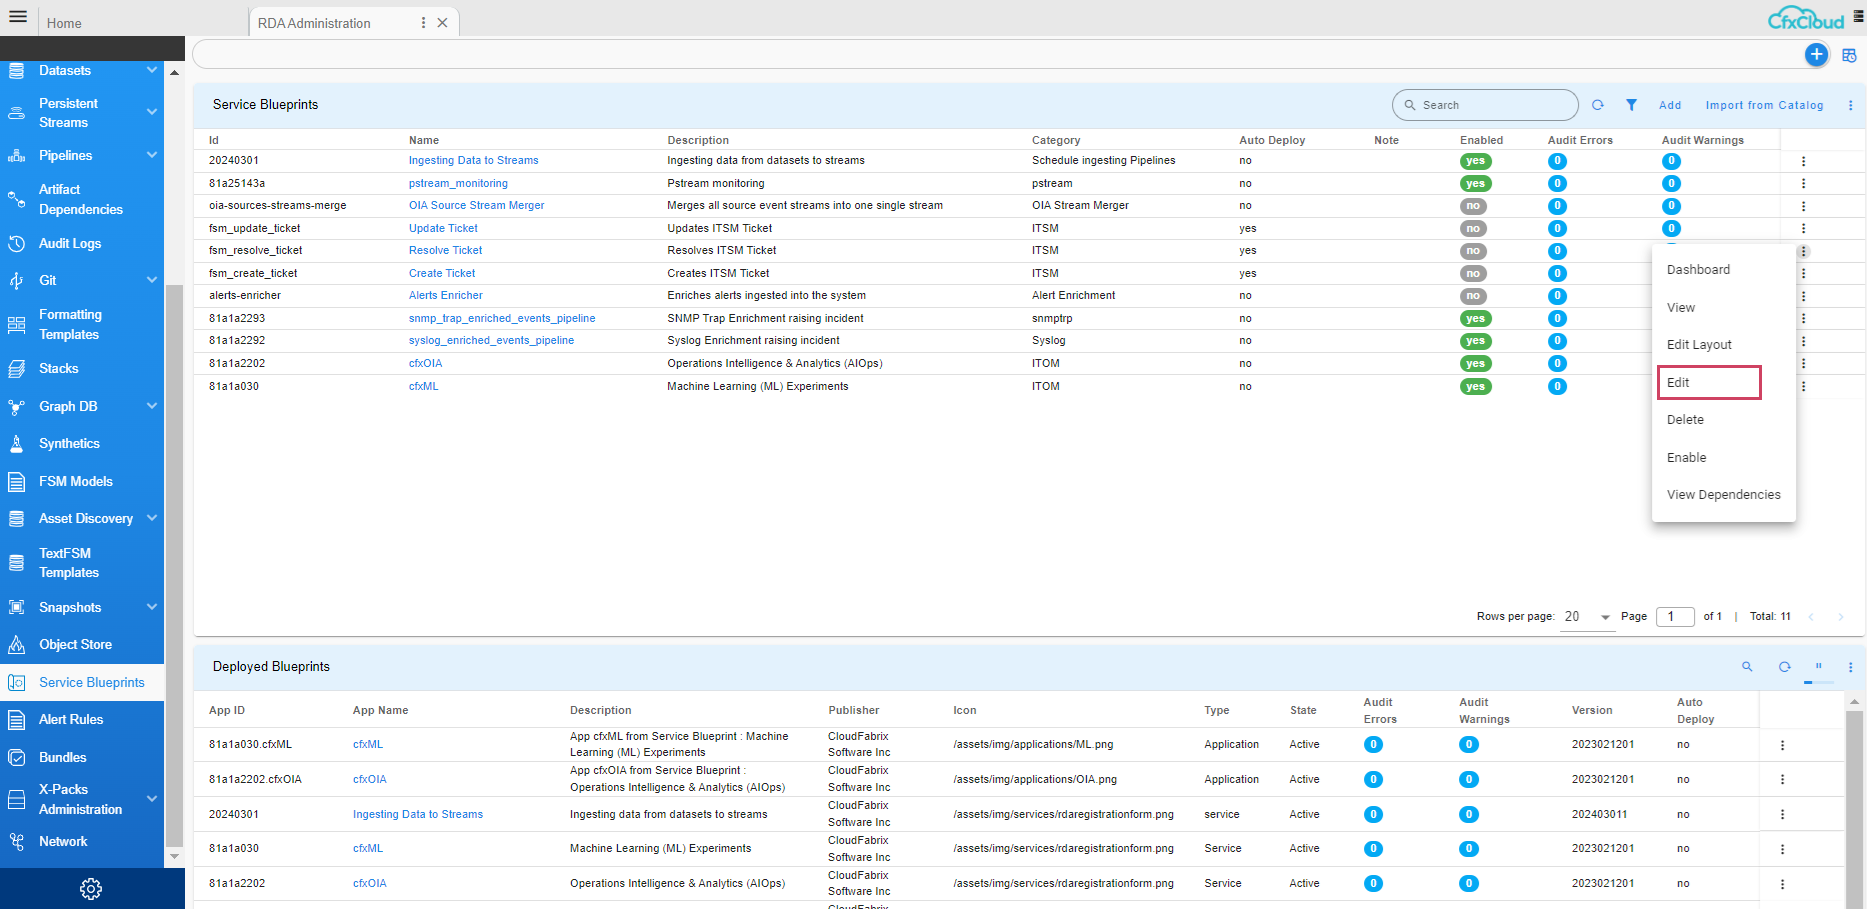
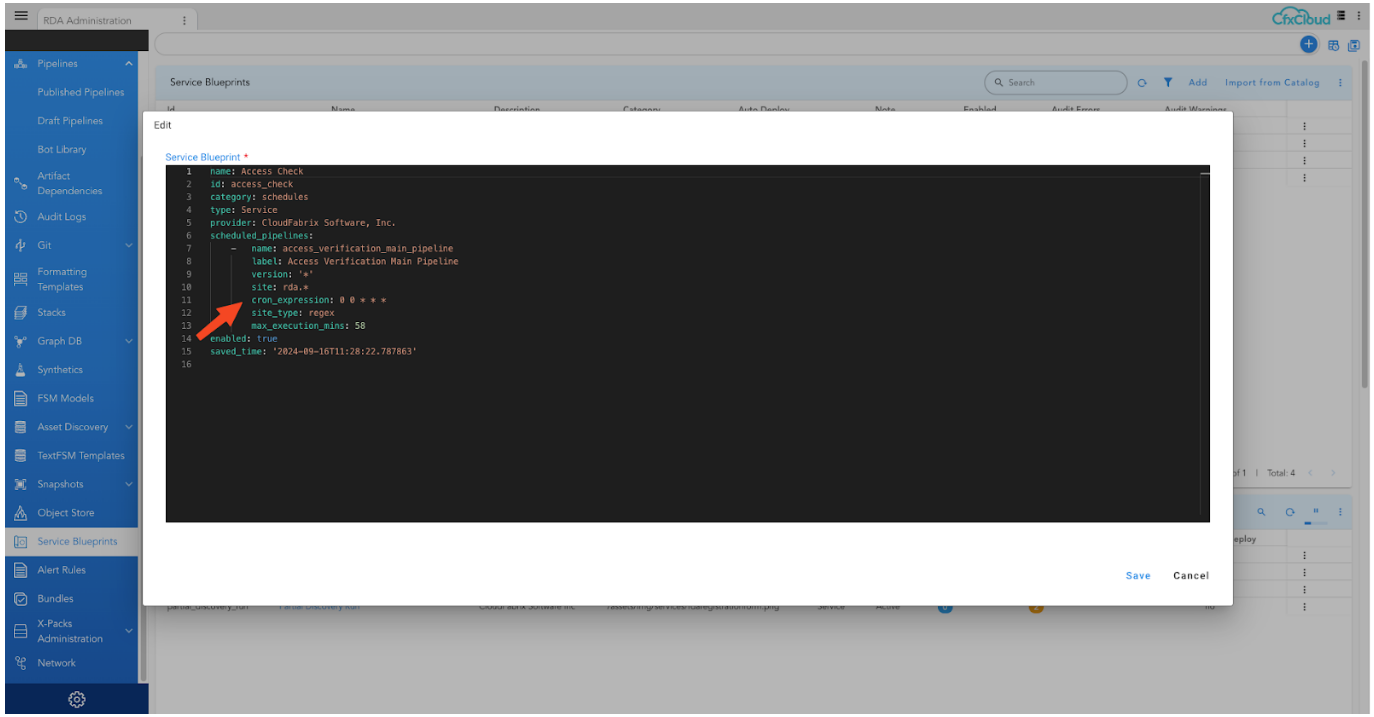
Changing the schedule on blueprint to customize the execution when the asset discovery should run
Click on RDA Administration -> Service Blueprints -> select the corresponding Blueprint thru Hamburger Icon
Change the required cron expression
