Appdynamics
1. Introduction
This section explains how to integrate and ingest data from AppDynamics into CloudFabrix. The integration allows...
-
Ingest AppDynamics Alerts, Events, Health Rule Violations.
-
Ingest AppDynamics Observability data, Asset Metadata.
-
To extend the reach of AppDynamics operational data into ITSM tools and processes.
-
To view, compare, and correlate cross-domain incident-relevant metrics & logs with Triage Dashboard.
-
Provides rich context to operational data with CloudFabrix automated full-stack resolution.

2. AppDynamics and CloudFabrix
DataSource or Extension is the term frequently used within the context of 'RDA'. It is the source system where the relevant data resides. By adding a system as an extension/data source for example AppDynamics within the RDA, then it is the source for pulling the necessary information from the system into CloudFabrix by RDA
Prerequisites
The following are prerequisites for creating AppDynamics as a Datasource/Extension in RDA. It is used for collecting Application/Server configuration, inventory, and metrics on-demand.
- AppDynamics SaaS portal with Administrator/Account Owner access
- An API Client with Monitoring & Viewer role permissions
- Service User Account with Monitoring & Viewer role permissions
- One or more Applications or Databases being monitored by AppDynamics
Enabling API access on AppDynamics SaaS controller:
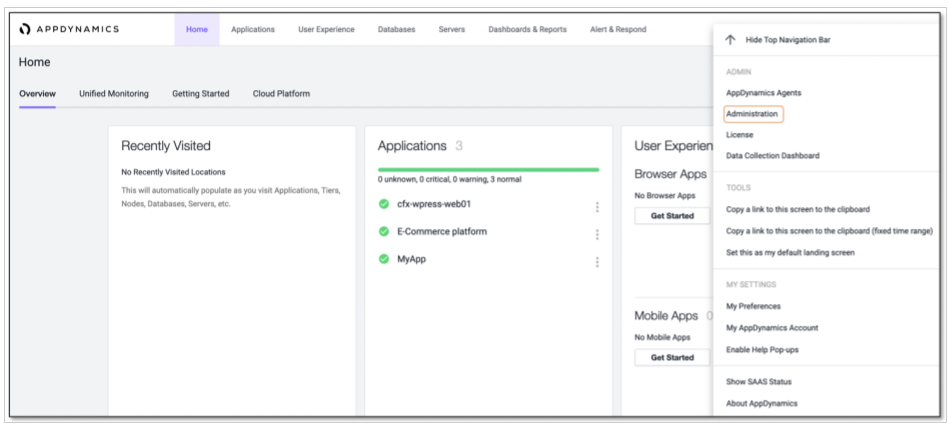
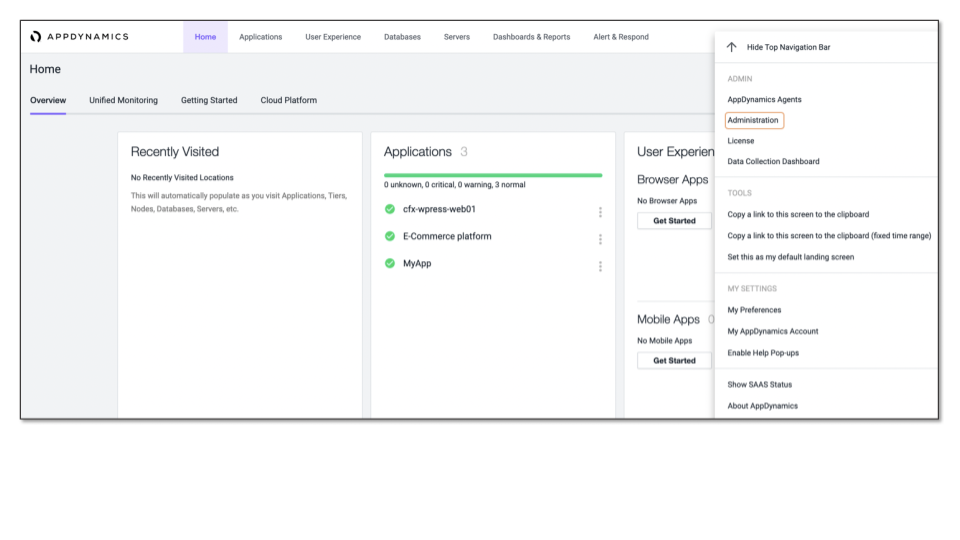
Step 1: Login to the AppDynamics SaaS portal as the administrator/account owner. Navigate to Administration under Settings:
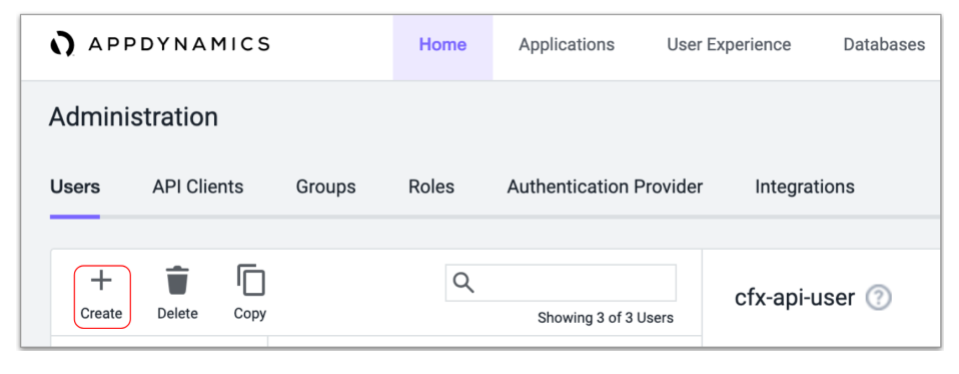
Step 2: Click on Users and click + to add new service account user
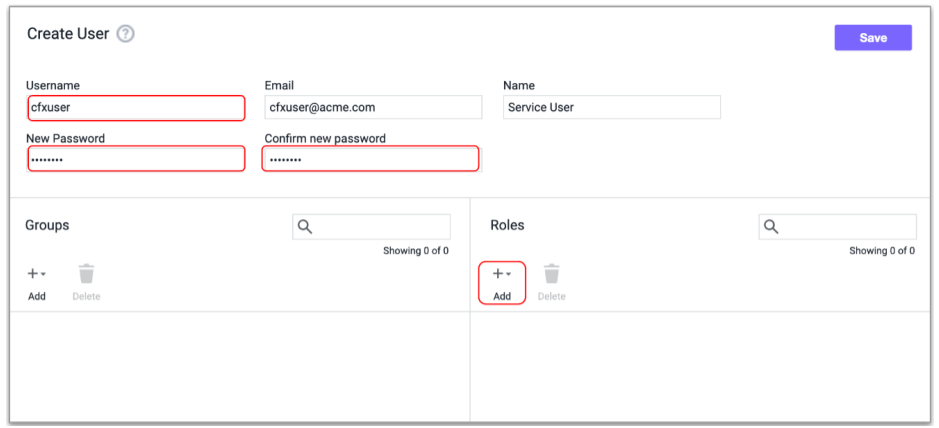
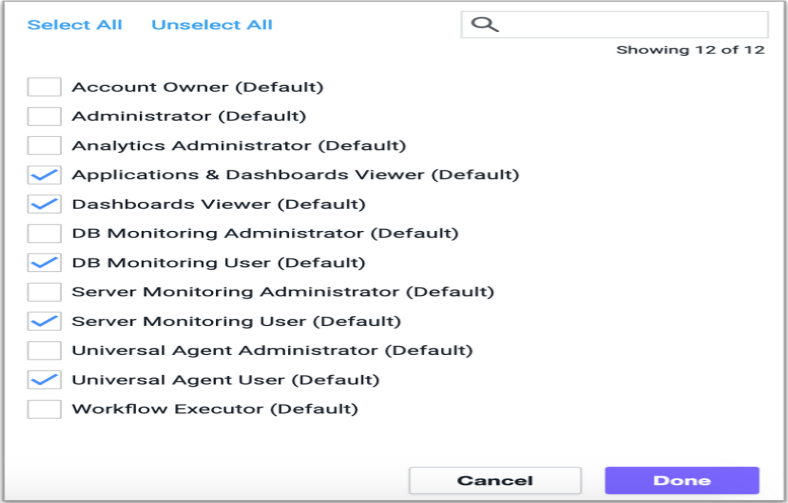
Step 3: Enter service account Username, Email, Name, Password and click on Add under Roles section to set Monitoring/Viewer permissions and Save the settings.
Step 4: Click on API Clients and click + to add a new API Client
Enter Client Name, Description, generate client secret by clicking on the Generate Secret button.
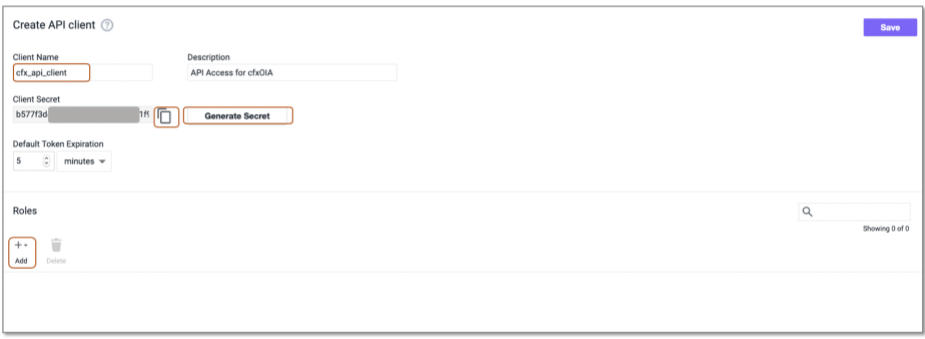
Note: Make a copy of Client Secret generated as this key will be required later.
Step 5: Navigate to the Roles tab and click on Add to add a new role and select the permissions as shown below and click Done.
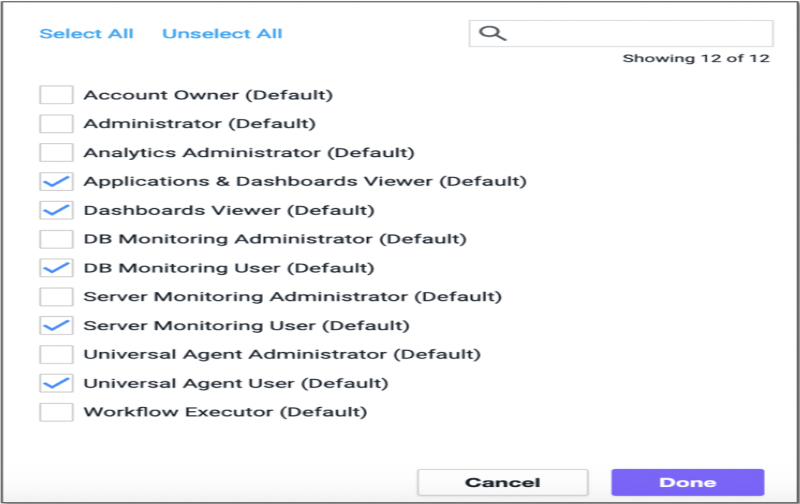
On next screen, click Save.
3. Adding AppDynamics as Datasource/Extension in RDA Studio:
AppDynamics or any other datasource/extension's configuration is configured in RDA's user interface. Login into RDA's user interface using a browser.
https://[rda-ip-address]:9998
Info
Default username and password of standalone **RDA Studio** is **rdademo** and **rdademo1234**
Under Notebook, click on CFXDX Python 3 box
AppDynamics or any other datasource/extension's configuration is configured in RDA's user interface. Login into RDA's user interface using a browser.
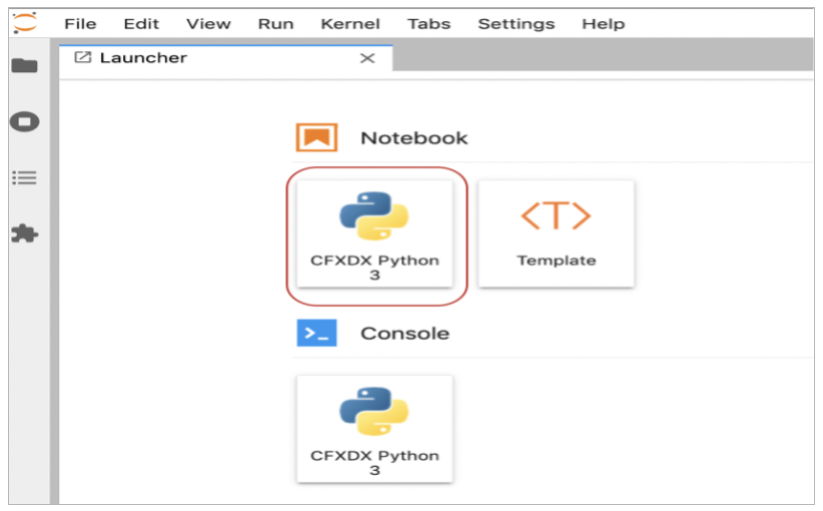
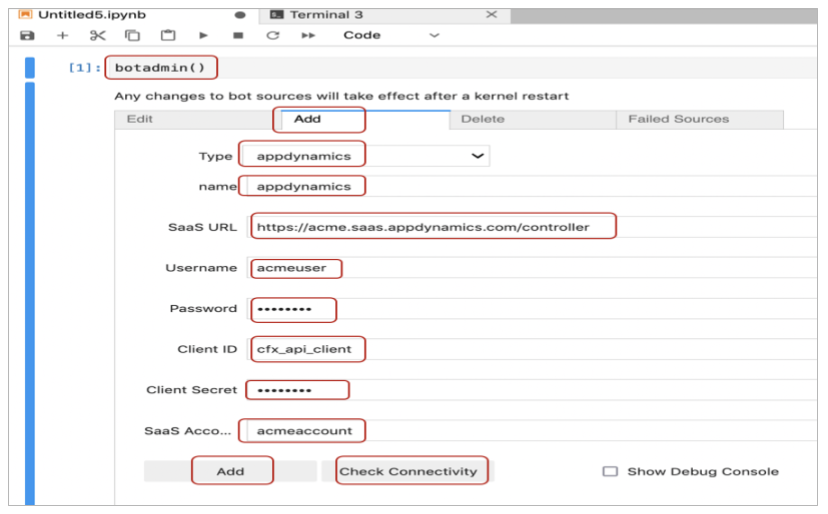
In the Notebook command box, type botadmin() and alt (or option) + Enter to open datasource administration menu.
Click on 'Add' menu and under Type drop down, select appdynamics
-
Type: Datasource/Extension type. In this context, it is appdynamics
-
Name: Datasource/Extension label which should be unique within the RDA
-
Endpoint: AppDynamics SaaS instance
URL(Ex: https://acme.saas.appdynamics.com/controller)
-
Username: AppDynamics API user account with enough privileges for the integration
-
Password: AppDynamics API user password
-
Client ID: API Client name that was created for API Access
-
Client Secret: client secret that was generated under API Client name
-
SaaS Account: AppDynamics SaaS portal account name
Click on Check Connectivity to verify the network access and credentials validity. Once it is validated, click on 'Add' button to add the AppDynamics as a datasource.
4. AppDynamics data exploration in RDA Studio:
Once AppDynamics integration details are configured in RDA as datasource, it will be ready to connect to AppDynamics SaaS instance and explore the data for the analysis.
For the details on AppDynamics inventory data collection bots, refer CloudFabrix RDA Bot Documentation