Guide to Install and Configure RDA Fabric Edge Services
Note
RDA service (container) image tags should be updated based on the release. Wherever a daily tag appears, it should be replaced with the latest release tag.
1. Install RDA Fabric Edge Services
RDA Worker:
RDA worker nodes are stateless data processing entities that can be installed closed to the source of data generation (ex: on-prem/enterprise/edge sites etc.). Worker nodes execute bots and pipelines and communicate with the RDAF platform that is responsible for scheduling and orchestrating jobs (pipelines) across various worker nodes.
Using worker nodes you can ingest and process/transform data locally without having to send all the data to centralized locations like an analytics platform or data warehouse. Two or more worker nodes in one environment can work as a group for load balancing and scale. RDAF platform can orchestrate data sharing or routing among worker nodes in distributed environments (ex: Worker nodes in edge location exchange data with workers in DC or workers in cloud).
Workers are essentially containerized service nodes and can be installed using Docker-compose or in a Kubernetes environment. Workers are typically installed on VMs that are located on-premises / cloud / edge environments.
RDA Event Gateway:
RDA Event Gateway is a type of RDA Agent that can send streaming data to the RDA Fabric platform. If user wants to send logs/events in real-time to the RDAF platform, users can install Event Gateway in their local environment and configure event sources to send data to Event Gateway.
Similar to RDA worker nodes, event gateways are also containerized services and can be installed using Docker-compose or in a Kubernetes environment. RDA event gateways are typically installed on VMs that are located on-premises / cloud / edge environments.
-
Log Sources: For instance, to send syslogs from your Linux servers to the RDA platform, you can install Event Gateway and configure rsyslog on your Linux servers to send data to Event Gateway, which in turn can send data to the RDAF platform.
-
Existing Log Shippers: Users can also use existing log shippers like Splunk Universal Forwarder, Elasticsearch beats, Fluentd, rsyslog, syslog-ng, etc. to route / send data to Event Gateway.
-
Endpoints: Event Gateway supports endpoints and each endpoint is configured to send data to a stream on RDAF platform. For example, you can configure an endpoint with a port and protocol/type (ex: TCP/syslog) and all syslog sources can send data to that endpoint.
RDA Edge Collector :
RDA Edge Collector is a type of RDA agent that can discover and collect IT asset data in an agentless manner and send the collected data to the RDA Fabric platform. Edge Collector agent is primarily used to discover the IT assets (i.e. Servers, Switches, Routers, Firewall, Load Balancers, Storage Arrays etc.) that provide inventory data over SNMP and SSH protocols.
Similar to RDA worker & event gateway, edge collectors are also containerized services and can be installed using Docker-compose or in a Kubernetes environment. RDA edge collectors are typically installed on VMs that are located on-premises / cloud / edge environments.
1.1 RDA Worker Installation
RDA Worker services are, by default, installed and managed using RDAF Deployment CLI, alongside the RDAF infrastructure, platform, and application services. These RDA Worker services can also be deployed at Edge locations that are closer to the target infrastructure environments requiring integration. In such cases, RDA Worker services can still be installed via the RDAF CLI; however, this requires SSH access to the target machines. If SSH access is restricted at the Edge location, the RDA Worker service must be installed using the Docker Compose CLI utility.
When the RDA Worker(s) are installed using the RDAF CLI, it allows administrative users to remotely manage lifecycle operations such as start, stop, and upgrade. However, when deployed using the Docker Compose CLI typically due to Edge location restrictions, the RDA Worker's lifecycle operations must be managed manually at each location, as needed.
Important
Below steps are for Non-K8s environment only
Prerequisites:
- Linux OS
- CPU - 2 (Minimum)
- Memory - 8GB (Minimum)
- Disk - 125GB (Minimum) - / (75GB), /var/lib/docker (25GB), /opt (25GB)
- Python 3.12 or above
- Docker container runtime environment (27.1.x or above)
- Docker-compose utility (1.29.x or above)
Note
For production deployments, RDA Worker resources must be appropriately sized. For guidance on resource sizing, please contact the CloudFabrix support team at support@cloudfabrix.com.
Installation Steps:
As a prerequisite, the IP address(es) of the RDA Worker host(s) must be specified during the initial RDA Fabric configuration setup using the rdaf setup command.
Step-1: Install RDA Worker service(s)
Run the below command to deploy RDA Worker services.
If the RDA Worker needs to be installed at a later stage using the RDAF CLI, the following command must be executed:
Step-2: Verify RDA Worker in RDA Fabric portal
Newly installed RDA Worker(s) will authenticate with the RDA Fabric platform and it will show up in RDA Fabric portal under Fabric Health --> Workers.
Step-3: Verify Worker using RDA Client (rdac) utility
If you have installed RDA Client (rdac) command line utility, you can also verify newly created RDA Worker using rdac pods command.
Prerequisites:
- Linux OS
- CPU - 2 (Minimum)
- Memory - 8GB (Minimum)
- Disk - 125GB (Minimum) - / (75GB), /var/lib/docker (25GB), /opt (25GB)
- Python 3.12 or above
- Docker container runtime environment (27.1.x or above)
- Docker-compose utility (1.29.x or above)
Note
For production deployments, RDA Worker resources must be appropriately sized. For guidance on resource sizing, please contact the CloudFabrix support team at support@cloudfabrix.com.
Installation Steps:
Step-1:
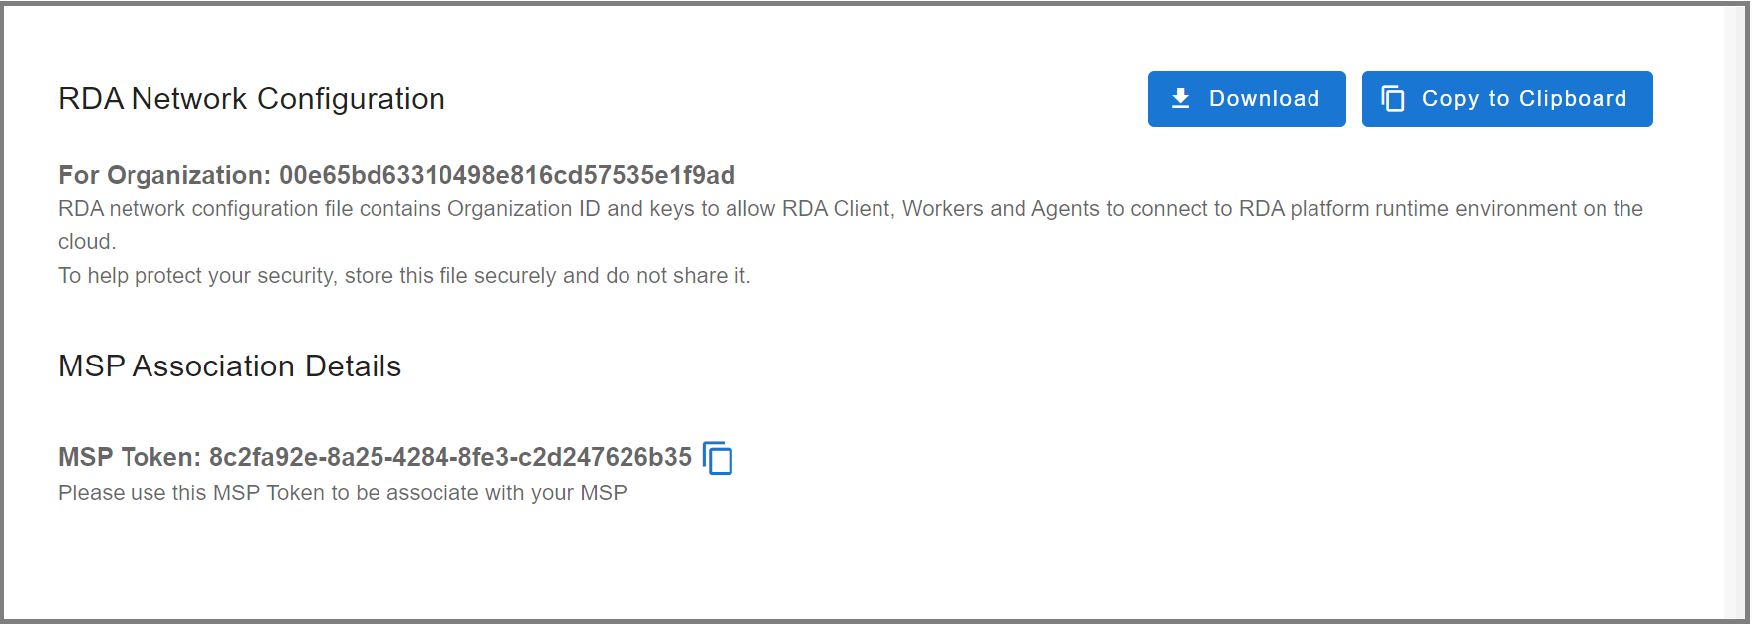
The RDA worker node registers and communicates with the RDAF platform using a configuration file that contains your tenant ID, data fabric access tokens, and object storage credentials.
Download RDA Fabric Configuration from the portal by going to Configuration --> RDA Administration --> Network and copy it to the local filesystem where the worker node is going to be installed.
- Save the file as
rda_network_config.json
- Create the below directory structure
sudo mkdir -p /opt/rdaf/config/network_config
sudo mkdir -p /opt/rdaf/logs
sudo mkdir -p /opt/rdaf/config/worker/rda_packages
sudo chown -R `id -u`:`id -g` /opt/rdaf
- Copy the downloaded RDA Fabric configuration file as shown below.
- Create common.yml file for RDA Worker to configure logger settings as shown below.
cd /opt/rdaf/config/worker

cat > common.yml << 'EOF'
version: 1
disable_existing_loggers: false
formatters:
  standard:
    format: "%(asctime)s %(levelname)s %(module)s - PID=%(process)s %(message)s"
handlers:
  console:
    class: logging.StreamHandler
    level: INFO
    formatter: standard
    stream: ext://sys.stdout
  file_handler:
    class: logging.handlers.RotatingFileHandler
    level: INFO
    formatter: standard
    filename: /logs/${pod_type}-${pod_id}.log
    maxBytes: 10485760 # 10MB
    backupCount: 5
    encoding: utf8
root:
  level: INFO
  handlers: [console, file_handler]
  propogate: yes

EOF
Note
The username/password has not been provided in this documentation. If you need access credentials, please reach out to the Support Team at (support@fabrix.ai)
Step-2: Docker Login
Run the below command to create and save the docker login session into CloudFabrix's secure docker repository.
Step-3: Create Docker Compose File
Create docker compose configuration file for RDA Worker as shown below.
Tip
Note-1: Optionally change the worker group name (also known as Site) in the docker-compose file by updating the WORKER_GROUP value. In this example, the worker group name is specified as rda_worker_group01
Note-2: Adjust mem_limit and memswap_limit as per the workload requirements. In the below configuration, these parameters are set to 16GB
Note
Tag version should be updated based on the current GA release highlighted below.
cd /opt/rdaf/config/worker

cat > rda-worker-docker-compose.yml <<EOF
version: '3.1'
services:
  rda_worker:
    image: docker2.cloudfabrix.io:443/external/ubuntu-rda-worker-all:8.2.1
    restart: always
    network_mode: host
    mem_limit: 16G
    memswap_limit: 16G
    shm_size: 1gb
    volumes:
    - /opt/rdaf/config/network_config:/network_config
    - /opt/rdaf/config/worker:/loggingConfigs
    - /opt/rdaf/logs:/logs
    - /opt/rdaf/config/worker/rda_packages:/rda_packages
    logging:
      driver: "json-file"
      options:
        max-size: "25m"
        max-file: "5"
    environment:
      RESOURCE_NAME:
      RDA_NETWORK_CONFIG: /network_config/rda_network_config.json
      LOGGER_CONFIG_FILE: /loggingConfigs/common.yml
      WORKER_GROUP: rda_worker_group01
      LABELS: name=rda_worker_01
      RDA_SELF_HEALTH_RESTART_AFTER_FAILURES: 3
      CAPACITY_FILTER: mem_percent < 95

EOF
Tip
If you are in an HTTP Proxy environment, please configure the HTTP Proxy environment variables as shown below. If there are any target endpoint(s) that don't need to go through the HTTP Proxy, please specify their IP addresses or FQDN names as comma-separated values under the no_proxy and NO_PROXY environment variables.
version: '3.1'
services:
  rda_worker:
    image: docker2.cloudfabrix.io:443/external/ubuntu-rda-worker-all:daily
    restart: always
    network_mode: host
    mem_limit: 16G
    memswap_limit: 16G
    shm_size: 1gb
    volumes:
    - /opt/rdaf/config/network_config:/network_config
    - /opt/rdaf/config/worker:/loggingConfigs
    - /opt/rdaf/logs:/logs
    - /opt/rdaf/config/worker/rda_packages:/rda_packages
    logging:
      driver: "json-file"
      options:
        max-size: "25m"
        max-file: "5"
    environment:
      RESOURCE_NAME:
      RDA_NETWORK_CONFIG: /network_config/rda_network_config.json
      LOGGER_CONFIG_FILE: /loggingConfigs/common.yml
      WORKER_GROUP: rda_worker_group01
      LABELS: name=rda_worker_01
      RDA_SELF_HEALTH_RESTART_AFTER_FAILURES: 3
      CAPACITY_FILTER: mem_percent < 95
      http_proxy: "http://user:password@192.168.122.107:3128"
      https_proxy: "http://user:password@192.168.122.107:3128"
      no_proxy: "127.0.0.1"
      HTTP_PROXY: "http://user:password@192.168.122.107:3128"
      HTTPS_PROXY: "http://user:password@192.168.122.107:3128"
      NO_PROXY: "127.0.0.1"
Tip
Note-1: RDA worker(s) communicates with RDA Fabric that is running in cloud or on-premise datacenter over ports 4222/TCP & 9443/TCP. Please make sure RDA worker(s) has outbound network access over these network ports. In addition, make sure RDA Fabric is configured to allow inbound network traffic for the same ports to accept the traffic from RDA worker(s).
Note-2: Please verify rda_network_config.json is configured with publicly accessible IP/FQDN of RDA Fabric for NATs and Minio endpoints.
Note-3: If the worker is deployed in proxy environment, please add the required environment proxy variables in /opt/rdaf/deployment-scripts/values.yaml, under the section rda_worker -> env:, instead of making changes to worker.yaml (this is needed only if there are any new changes needed for worker)
Step-4: Bring Up RDA Worker
cd /opt/rdaf/worker

docker-compose -f rda-worker-docker-compose.yml pull
docker-compose -f rda-worker-docker-compose.yml up -d
Note
If Ubuntu version is v22.04.2 LTS or above & Docker Compose version is v2.16.0 or above, Use the following Commands mentioned below
cd /opt/rdaf/worker

docker compose -f rda-worker-docker-compose.yml pull
docker compose -f rda-worker-docker-compose.yml up -d
Check worker node status using docker ps command and ensure that worker is up and running, without any restarts. If you see that the worker is restarting, make sure you copied the RDA network config file to the correct location.
Step-6: Verify RDA Worker in RDA Fabric portal
A newly installed worker will authenticate with the RDA Fabric platform and it will show up in RDA Fabric portal under Fabric Health --> Workers.
Step-7: Verify Worker using RDA Client (rdac) utility
If you have installed RDA Client (rdac) command line utility, you can also verify newly created worker using rdac pods command.
1.2 RDA Event Gateway Installation
RDA Event Gateway services can be installed and managed using the RDAF Deployment CLI, alongside RDAF infrastructure, platform, and application services. These services can also be deployed at Edge locations, closer to target infrastructure environments, enabling local collection of events such as Syslog messages and SNMP traps, which are then forwarded to the RDAF Platform. In such scenarios, the RDA Event Gateway services can still be installed using the RDAF CLI, but this requires SSH access to the target machines. If SSH access is restricted at the Edge location, installation must be performed using the Docker Compose CLI utility.
When the RDA Event Gateway(s) are installed using the RDAF CLI, it allows administrative users to remotely manage lifecycle operations such as start, stop, and upgrade. However, when deployed using the Docker Compose CLI typically due to Edge location restrictions, the RDA Event Gateway's lifecycle operations must be managed manually at each location, as needed.
Note
When RDA Event Gateway services need to be deployed in high-availability and load-distributed mode, the Docker Compose CLI utility must be used. This is because the RDAF CLI currently does not support deploying RDA Event Gateway in high-availability mode using an Nginx load balancer.
In the latest release (8.2 and above), endpoints (Syslogs, SNMP Traps, etc.) have been migrated to Telegraf-powered endpoints. Additionally, support has been added for collecting SNMP Metrics, ICMP Ping, URL SSL Certificates, and Port Monitoring. These custom-built Telegraf plugins are designed to seamlessly integrate with the Fabric RDAF platform and provide the following capabilities:
- High-throughput ingestion — Process events per second at scale.
- Inline transformation — Transform incoming event data at inline rates without additional pipeline overhead.
- Direct ingestion — Ingest data directly into Fabrix RDAF platform's timeseries database (OpenSearch), bypassing intermediary stages.
- Seamless integration — Custom-built Telegraf plugins that natively integrate with the Fabrix RDAF platform.
Backward Compatibility
Existing RDA Event Gateway deployments will continue to work as-is. Migration to Telegraf-powered endpoints is recommended, though it is optional and can be performed per endpoint independently.
1.2.1 Installation Steps
Important
Below steps are for Non-K8s environment only
Prerequisites:
- Linux OS
- CPU - 2 (Minimum)
- Memory - 8GB (Minimum)
- Disk - 125GB (Minimum) - / (75GB), /var/lib/docker (25GB), /opt (25GB)
- Python 3.12 or above
- Docker container runtime environment (27.1.x or above)
- Docker-compose utility (1.29.x or above)
Note
For production deployments, RDA Event Gateway resources must be appropriately sized. For guidance on resource sizing, please contact the CloudFabrix support team at support@cloudfabrix.com.
Installation Steps:
Step-1:
As a prerequisite, the IP address(es) of the RDA Event Gateway host(s) must be specified during the initial RDA Fabric configuration setup using the rdaf setup command.
- To Install the RDA Event Gateway, log in to the RDAF CLI VM and execute the following command.
Step-2:
- Run the below command to verify the status of the RDA Event Gateway Service.
+-------------------+-----------------+---------------+--------------+-------+
| Name              | Host            | Status        | Container Id | Tag   |
+-------------------+-----------------+---------------+--------------+-------+
| rda_event_gateway | 192.168.108.127 | Up 43 seconds | 44c4937ebf0a | 8.2.1 |
| rda_event_gateway | 192.168.108.128 | Up 16 seconds | d6779fd7f75f | 8.2.1 |
+-------------------+-----------------+---------------+--------------+-------+
Step-3: Verify RDA Event Gateway in RDA Fabric portal
A newly installed event gateway will authenticate with the RDA Fabric platform and it will show up in RDA Fabric portal under Fabric Health --> Agents --> RDA Agents & Event Gateway Endpoints
Step-4: Verify RDA Event Gateway using RDA Client (rdac) utility
If you have installed RDA Client (rdac) command line utility, you can also verify newly created event gateway using rdac agents command.
Prerequisites:
- Linux OS
- CPU - 2 (Minimum)
- Memory - 8GB (Minimum)
- Disk - 125GB (Minimum) - / (75GB), /var/lib/docker (25GB), /opt (25GB)
- Python 3.12 or above
- Docker container runtime environment (27.1.x or above)
- Docker-compose utility (1.29.x or above)
Note
For production deployments, RDA Event Gateway resources must be appropriately sized. For guidance on resource sizing, please contact the CloudFabrix support team at support@cloudfabrix.com.
Step-1:
- Create the below directory structure on RDA Event Gateway VM
sudo mkdir -p /opt/rdaf/config/network_config
sudo mkdir -p /opt/rdaf/event_gateway/config/main
sudo mkdir -p /opt/rdaf/event_gateway/config/snmptrap
sudo mkdir -p /opt/rdaf/cert
sudo mkdir -p /opt/rdaf/event_gateway/logs
sudo mkdir -p /opt/rdaf/event_gateway/log_archive
sudo mkdir -p /opt/rdaf/event_gateway/telegraf/config/templates
sudo chown -R `id -u`:`id -g` /opt/rdaf
The RDA event gateway registers and communicates with the RDA Fabric platform using a configuration file that contains your tenant ID, data fabric access tokens, and object storage credentials.
Copy the RDA Fabric Configuration from RDAF deployment CLI VM to RDA Event Gateway VM:
scp rdauser@<rdaf-cli-vm-ip>:/opt/rdaf/config/network_config/config.json /opt/rdaf/config/network_config/rda_network_config.json
Step-2: Docker Login
Run the below command to create and save the docker login session into CloudFabrix's secure docker repository.
Step-3: Create Docker Compose File
Create docker compose configuration file for RDA event gateway as shown below.
Info
Note: Optionally change the agent group name in the docker-compose file by updating the AGENT_GROUP value. In this example, the agent group name is specified as event_gateway_site01
cd /opt/rdaf/event_gateway

cat > event-gateway-docker-compose.yml <<EOF
version: '3.1'
services:
  rda_event_gateway:
    image: docker2.cloudfabrix.io/ubuntu-rda-event-gateway:8.2.1
    restart: always
    network_mode: host
    mem_limit: 6G
    memswap_limit: 6G
    volumes:
    - /opt/rdaf/config/network_config:/network_config
    - /opt/rdaf/event_gateway/config:/event_gw_config
    - /opt/rdaf/cert:/certs
    - /opt/rdaf/event_gateway/logs:/logs
    - /opt/rdaf/event_gateway/log_archive:/tmp/log_archive
    - /opt/rdaf/event_gateway/telegraf/config/:/etc/telegraf
    logging:
      driver: "json-file"
      options:
        max-size: "25m"
        max-file: "5"
    environment:
      RDA_NETWORK_CONFIG: /network_config/rda_network_config.json
      EVENT_GW_MAIN_CONFIG: /event_gw_config/main/main.yml
      EVENT_GW_SNMP_TRAP_CONFIG: /event_gw_config/snmptrap/trap_template.json
      EVENT_GW_SNMP_TRAP_ALERT_CONFIG: /event_gw_config/snmptrap/trap_to_alert_go.yaml
      AGENT_GROUP: event_gateway_site01
      EVENT_GATEWAY_CONFIG_DIR: /event_gw_config
      LOGGER_CONFIG_FILE: /event_gw_config/main/logging.yml
      RDA_SELF_HEALTH_RESTART_AFTER_FAILURES: 3
      RDA_ENABLE_TRACES: 'no'
      DISABLE_REMOTE_LOGGING_CONTROL: 'no'
    entrypoint:
    - /docker-entry-point.sh
    privileged: true
    cap_add:
    - SYS_PTRACE
EOF
Step-4: Bring Up Event Gateway
cd /opt/rdaf/event_gateway

docker-compose -f event-gateway-docker-compose.yml pull
docker-compose -f event-gateway-docker-compose.yml up -d
Step-6: Check event gateway status
Check event gateway service status using docker ps command and ensure that event gateway is up and running, without any restarts. If you see that the event gateway is restarting, make sure you copied the RDA network configuration file to the correct location.
Step-7: Verify RDA Event Gateway in RDA Fabric portal
A newly installed event gateway will authenticate with the RDA Fabric platform and it will show up in RDA Fabric portal under Configuration --> Fabric Components --> Agents --> View Details.
Step-8: Verify RDA Event Gateway using RDA Client (rdac) utility
If you have installed RDA Client (rdac) command line utility, you can also verify newly created event gateway using rdac agents command.
1.2.2 Endpoints Configuration
Supported Endpoint Types:
The Telegraf-powered RDA Event Gateway supports the following endpoint types:
| Endpoint Type | Plugin | Description |
|---|---|---|
| Syslog | rda_syslog |
Receives syslog messages over UDP or TCP and ingests into OpenSearch |
| SNMP Traps | rda_snmp_trap |
Receives SNMP trap messages and ingests into OpenSearch |
| SNMP Metrics | rda_snmp |
Polls SNMP metrics (scalars, tables, inventories) from network devices |
| ICMP Ping Monitoring | rda_ping |
Monitors network reachability via ICMP ping |
| URL SSL Certificate Monitoring | rda_cert |
Monitors SSL/TLS certificate expiry for URLs |
| Port Monitoring (TCP/UDP) | rda_net_response |
Checks TCP/UDP port availability and response time |
| TCP JSON Receiver | rda_tcp_json |
Receives JSON messages over TCP (plaintext or TLS) |
Port Requirements:
Ensure the following ports are enabled on the RDA Event Gateway VMs. Additionally, these ports must be allowed between endpoint devices and the RDA Event Gateway VMs on any intermediate firewalls.
Inbound:
| Port | Protocol | Endpoint Type |
|---|---|---|
| 514 / 5141 / Custom | UDP or TCP | Syslog receiver |
| 162 | UDP | SNMP Trap receiver |
| 5142 / 5143 / Custom | TCP | TCP JSON Syslog receiver |
Firewall commands on different Linux OS.
Ubuntu:
# Allow a specific port (TCP)
sudo ufw allow 514/tcp

# Allow a specific port (UDP)
sudo ufw allow 162/udp

# Allow a port range
sudo ufw allow 5142:5145/tcp

# Reload and check status
sudo ufw reload
sudo ufw status verbose
RHEL / Rocky Linux:
# Allow a specific port (TCP)
sudo firewall-cmd --permanent --add-port=514/tcp

# Allow a specific port (UDP)
sudo firewall-cmd --permanent --add-port=162/udp

# Allow a port range
sudo firewall-cmd --permanent --add-port=5142-5145/tcp

# Reload and check status
sudo firewall-cmd --reload
sudo firewall-cmd --list-ports
Outbound:
| Port | Protocol | Endpoint Type |
|---|---|---|
| 161 | UDP | SNMP Metrics |
| 443,22,80,8080,Custom | TCP | URL & Port Monitoring |
| 4222 | TCP | RDA Platform NATs service |
| 9443 | TCP | RDA Platform Object Store service |
| 9200 | TCP | RDA Platform Opensearch service |
| 9093 | TCP | RDA Platform Kafka service |
All Telegraf-powered endpoints follow a common pattern:
- Each endpoint is defined as a
[[inputs.<plugin_name>]]block in a.conffile. - The
input_definitionblock (in YAML) defines the collector behaviour, output stream, and data transformations. - The
output_streamblock controls where processed data is written — directly to an OpenSearch-backed Persistent Stream (pstream) on the RDAF platform. - The
data_transformationssection allows inline enrichment, Grok parsing, and Starlark scripting applied at ingestion time.
Data Transformation Types:
| Type | Description |
|---|---|
enrich |
Enriches logs / metrics by looking up fields from a RDAF dataset (dictionary) |
grok |
Extracts structured fields from raw message text using Grok patterns |
starlark |
Applies custom logic using embedded Starlark (Python-like) scripts |
Before configuring endpoints (Syslogs, SNMP Traps, SNMP Metrics, etc.), create the corresponding Persistent Stream (pstream) for each endpoint in the RDAF Platform UI.
Note
Below given pstream configuration for a reference only. Please adjust the retention settings based on the business requirement. For more information on Pstream settings, please refer Persistent Streams Guide
Persistent Streams (pstreams) are backed by OpenSearch database. By default, OpenSearch determines the field type automatically based on the first record ingested. Field types are immutable and cannot be changed after data has been ingested.
The index_mappings setting allows you to explicitly define field data types. It is highly recommended for fields that store integer, float, or date/timestamp values. Ensure these mappings are
configured before ingesting data into the pstream.
When "os_external": true is set, pstream is created on external opensearch metrics & logs database cluster.
Pstream configuration for endpoints:
Login to the RDAF Platform UI as an MSP Admin user and navigate to Main Menu --> Configuration --> RDA Administration --> Persistent Streams --> Add
Pstream name: syslog_tcp_events_stream
{
    "os_external": false,
    "timestamp": "rda_gw_timestamp",
    "ism": {
        "rollover": {
            "min_index_age": "3d",
            "min_size": "60gb"
        },
        "delete": {
            "min_index_age": "7d"
        },
        "index_settings": {
            "index.refresh_interval": "60s",
            "index.number_of_shards": "3",
            "index.number_of_replicas": "1"
        },
        "index_mappings": {
            "properties": {
                "rda_gw_timestamp": {
                    "type": "date"
                },
                "Timestamp": {
                    "type": "date"
                },
                "syslog_facility_num": {
                    "type": "long"
                },
                "syslog_priority": {
                    "type": "long"
                },
                "syslog_severity_num": {
                    "type": "long"
                },
                "rda_gw_seq": {
                    "type": "long"
                }
            }
        }
    }
}
Pstream name: syslog_udp_events_stream
{
    "os_external": false,
    "timestamp": "rda_gw_timestamp",
    "ism": {
        "rollover": {
            "min_index_age": "3d",
            "min_size": "60gb"
        },
        "delete": {
            "min_index_age": "7d"
        },
        "index_settings": {
            "index.refresh_interval": "60s",
            "index.number_of_shards": "3",
            "index.number_of_replicas": "1"
        },
        "index_mappings": {
            "properties": {
                "rda_gw_timestamp": {
                    "type": "date"
                },
                "Timestamp": {
                    "type": "date"
                },
                "syslog_facility_num": {
                    "type": "long"
                },
                "syslog_priority": {
                    "type": "long"
                },
                "syslog_severity_num": {
                    "type": "long"
                },
                "rda_gw_seq": {
                    "type": "long"
                }
            }
        }
    }
}
Pstream name: snmp_trap_events_stream
{
    "os_external": false,
    "timestamp": "rda_gw_timestamp",
    "ism": {
        "rollover": {
            "min_index_age": "3d",
            "min_size": "60gb"
        },
        "delete": {
            "min_index_age": "7d"
        },
        "index_settings": {
            "index.refresh_interval": "60s",
            "index.number_of_shards": "3",
            "index.number_of_replicas": "1"
        },
        "index_mappings": {
            "properties": {
                "rda_gw_timestamp": {
                    "type": "date"
                }
            }
        }
    }
}
Pstream name: syslog_tcp_json_events_stream
{
    "os_external": false,
    "timestamp": "rda_gw_timestamp",
    "ism": {
        "rollover": {
            "min_index_age": "3d",
            "min_size": "60gb"
        },
        "delete": {
            "min_index_age": "7d"
        },
        "index_settings": {
            "index.refresh_interval": "60s",
            "index.number_of_shards": "3",
            "index.number_of_replicas": "1"
        },
        "index_mappings": {
            "properties": {
                "rda_gw_timestamp": {
                    "type": "date"
                },
                "Timestamp": {
                    "type": "date"
                }
            }
        }
    }
}
Pstream name: rda_snmp_metrics
{
"os_external": false,
"ism": {
"rollover": {
"min_index_age": "3d",
"min_size": "60gb"
},
"delete": {
"min_index_age": "7d"
},
"index_settings": {
"index.mapping.total_fields.limit": "1500",
"index.refresh_interval": "60s",
"index.number_of_shards": "3",
"index.number_of_replicas": "1"
},
"index_mappings": {
"dynamic": "strict",
"properties": {
"cpu_total_5sec_rev": {
"type": "long"
},
"cpu_total_1min_rev": {
"type": "long"
},
"cpu_total_5min_rev": {
"type": "long"
},
"cpu_usage": {
"type": "double"
},
"memory_free": {
"type": "long"
},
"memory_used": {
"type": "long"
},
"memory_total": {
"type": "long"
},
"memory_usage": {
"type": "double"
},
"memory_units": {
"type": "long"
},
"in_octets": {
"type": "long"
},
"out_octets": {
"type": "long"
},
"in_octets_delta": {
"type": "long"
},
"in_octets_rate": {
"type": "double"
},
"in_octets_time_delta": {
"type": "double"
},
"out_octets_delta": {
"type": "long"
},
"out_octets_rate": {
"type": "double"
},
"out_octets_time_delta": {
"type": "double"
},
"in_errors": {
"type": "long"
},
"in_errors_delta": {
"type": "long"
},
"in_errors_rate": {
"type": "double"
},
"in_errors_time_delta": {
"type": "double"
},
"out_errors": {
"type": "long"
},
"out_errors_delta": {
"type": "long"
},
"out_errors_rate": {
"type": "double"
},
"out_errors_time_delta": {
"type": "double"
},
"in_discards": {
"type": "long"
},
"in_discards_delta": {
"type": "long"
},
"in_discards_rate": {
"type": "double"
},
"in_discards_time_delta": {
"type": "double"
},
"out_discards": {
"type": "long"
},
"out_discards_delta": {
"type": "long"
},
"out_discards_rate": {
"type": "double"
},
"out_discards_time_delta": {
"type": "double"
},
"high_speed": {
"type": "long"
},
"interface_speed": {
"type": "long"
},
"index": {
"type": "double"
},
"interface_index": {
"type": "long"
},
"interface_type": {
"type": "long"
},
"input_utilization": {
"type": "double"
},
"output_utilization": {
"type": "double"
},
"interface_utilization": {
"type": "double"
},
"oper_status": {
"type": "long"
},
"admin_status": {
"type": "long"
},
"last_change": {
"type": "long"
},
"crc_errors": {
"type": "long"
},
"crc_errors_delta": {
"type": "long"
},
"crc_errors_rate": {
"type": "double"
},
"crc_errors_time_delta": {
"type": "double"
},
"alignment_errors": {
"type": "long"
},
"alignment_errors_delta": {
"type": "long"
},
"alignment_errors_rate": {
"type": "double"
},
"alignment_errors_time_delta": {
"type": "double"
},
"frame_too_longs": {
"type": "long"
},
"frame_too_longs_delta": {
"type": "long"
},
"frame_too_longs_rate": {
"type": "double"
},
"frame_too_longs_time_delta": {
"type": "double"
},
"symbol_errors": {
"type": "long"
},
"symbol_errors_delta": {
"type": "long"
},
"symbol_errors_rate": {
"type": "double"
},
"symbol_errors_time_delta": {
"type": "double"
},
"ntp_status": {
"type": "long"
},
"ntp_time_precision_ms": {
"type": "double"
},
"ntp_time_precision": {
"type": "long"
},
"sensor_value": {
"type": "long"
},
"sensor_threshold": {
"type": "long"
},
"sensor_last_shutdown": {
"type": "long"
},
"sensor_status": {
"type": "long"
},
"sensor_type": {
"type": "long"
},
"ospf_neighbor_events": {
"type": "long"
},
"ospf_neighbor_events_delta": {
"type": "long"
},
"ospf_neighbor_events_rate": {
"type": "double"
},
"ospf_neighbor_events_time_delta": {
"type": "double"
},
"ospf_interface_events": {
"type": "long"
},
"ospf_interface_events_delta": {
"type": "long"
},
"ospf_interface_events_rate": {
"type": "double"
},
"ospf_interface_events_time_delta": {
"type": "double"
},
"ospf_neighbor_state": {
"type": "long"
},
"ospf_admin_status": {
"type": "long"
},
"ospf_interface_state": {
"type": "long"
},
"bgp_peer_admin_status": {
"type": "long"
},
"bgp_peer_in_messages": {
"type": "long"
},
"bgp_peer_in_messages_delta": {
"type": "long"
},
"bgp_peer_in_messages_rate": {
"type": "double"
},
"bgp_peer_in_messages_time_delta": {
"type": "double"
},
"bgp_peer_out_messages": {
"type": "long"
},
"bgp_peer_out_messages_delta": {
"type": "long"
},
"bgp_peer_out_messages_rate": {
"type": "double"
},
"bgp_peer_out_messages_time_delta": {
"type": "double"
},
"bgp_peer_in_updates": {
"type": "long"
},
"bgp_peer_in_updates_delta": {
"type": "long"
},
"bgp_peer_in_updates_rate": {
"type": "double"
},
"bgp_peer_in_updates_time_delta": {
"type": "double"
},
"bgp_peer_out_updates": {
"type": "long"
},
"bgp_peer_out_updates_delta": {
"type": "long"
},
"bgp_peer_out_updates_rate": {
"type": "double"
},
"bgp_peer_out_updates_time_delta": {
"type": "double"
},
"bgp_peer_local_port": {
"type": "long"
},
"bgp_peer_remote_port": {
"type": "long"
},
"bgp_peer_remote_as": {
"type": "long"
},
"bgp_peer_state": {
"type": "long"
},
"bgp_peer_uptime": {
"type": "long"
},
"poe_allocated_power": {
"type": "long"
},
"poe_available_power": {
"type": "long"
},
"poe_max_power": {
"type": "long"
},
"poe_port_index": {
"type": "long"
},
"poe_port_status": {
"type": "long"
},
"poe_usage_percent": {
"type": "double"
},
"poe_power_consumption": {
"type": "long"
}
}
}
}
}
Pstream name: rda_snmp_network_interfaces_inventory
Pstream name: rda_snmp_entity_physical_inventory
Pstream name: rda_icmp_ping_metrics
{
    "os_external": false,
    "ism": {
        "rollover": {
            "min_index_age": "3d",
            "min_size": "60gb"
        },
        "delete": {
            "min_index_age": "15d"
        },
        "index_settings": {
            "index.refresh_interval": "60s",
            "index.number_of_shards": "3",
            "index.number_of_replicas": "1"
        },
        "index_mappings": {
            "dynamic": "strict",
            "properties": {
                "average_response_ms": {
                    "type": "double"
                },
                "maximum_response_ms": {
                    "type": "double"
                },
                "minimum_response_ms": {
                    "type": "double"
                },
                "packets_received": {
                    "type": "long"
                },
                "packets_transmitted": {
                    "type": "long"
                },
                "percent_packet_loss": {
                    "type": "long"
                },
                "result_code": {
                    "type": "long"
                },
                "standard_deviation_ms": {
                    "type": "double"
                }
            }
        }
    }
}
Pstream name: rda_ssl_certificate_metrics
{
    "os_external": false,
    "ism": {
        "rollover": {
            "min_index_age": "3d",
            "min_size": "60gb"
        },
        "delete": {
            "min_index_age": "15d"
        },
        "index_settings": {
            "index.refresh_interval": "60s",
            "index.number_of_shards": "3",
            "index.number_of_replicas": "1"
        },
        "index_mappings": {
            "dynamic": "strict",
            "properties": {
                "startdate": {
                    "type": "date"
                },
                "enddate": {
                    "type": "date"
                },
                "expiry": {
                    "type": "long"
                },
                "expiry_days": {
                    "type": "double"
                },
                "not_after": {
                    "type": "date"
                },
                "not_before": {
                    "type": "date"
                },
                "port": {
                    "type": "long"
                },
                "verification_code": {
                    "type": "long"
                }
            }
        }
    }
}
Pstream name: rda_port_health_metrics
{
    "os_external": false,
    "ism": {
        "rollover": {
            "min_index_age": "3d",
            "min_size": "60gb"
        },
        "delete": {
            "min_index_age": "15d"
        },
        "index_settings": {
            "index.refresh_interval": "60s",
            "index.number_of_shards": "3",
            "index.number_of_replicas": "1"
        },
        "index_mappings": {
            "dynamic": "strict",
            "properties": {
                "port": {
                    "type": "long"
                },
                "response_time": {
                    "type": "double"
                },
                "result_code": {
                    "type": "long"
                }
            }
        }
    }
}
1.2.2.1 Syslog (TCP/UDP)
The rda_syslog plugin receives syslog messages over UDP or TCP (plaintext or TLS), transforms them inline using Grok patterns and enrichment rules, and writes directly to an OpenSearch pstream.
Configuration file - Syslog (TCP): rda_syslog_tcp.conf
# RDA Syslog Input Plugin
#
# Receives syslog messages over UDP or TCP (plaintext or TLS).
#
[[inputs.rda_syslog]]
  enabled = true  # true / false to enable or disable the endpoint
  # alias = "syslog_tcp"  # Plugin alias name

  input_definition = '''
collector:

  syslog_properties:
    bind_host: "0.0.0.0"
    port: 514
    protocol: "tcp"                                  # "udp" or "tcp"
    # enable_tls: false                              # TCP only; requires cert_file and key_file
    # cert_file: "/certs/cert.pem"
    # key_file: "/certs/key.pem"
    # parse_cef_format: false                        # Parse CEF messages (extracts src, dst, act, msg)
    # parse_kv_format: false                         # Parse key=value messages (needs 3+ "=" chars)
    ## OpenSearch writer tuning (only when output_stream is set)
    # worker_count: 8
    # queue_size: 200
    # flush_interval: 10                             # Seconds
    # batch_size: 4000
    # timeout: 60                                    # Seconds

  ## Writes directly to an OpenSearch pstream. Omit to use Telegraf outputs.
  output_stream:
    name: "syslog_tcp_events_stream"
    type: "pstream"

  ## Glob patterns for fields/tags to remove from output.
  # field_exclude: ["Timestamp", "Appname", "Message", "MsgID", "ProcID", "Hostname"]

  # tags:
  #   input: "syslog_tcp"

  ## Transformations applied in order. Types: grok, enrich, starlark.
  data_transformations:

    ## Grok: extract structured fields from raw text.
    ##   parse_fields   - Fields to parse
    ##   drop_original  - Remove parsed field after extraction
    ##   merge          - "override" replaces existing fields
    ##   grok_patterns  - Patterns to try (first match wins)
    - name: parse_syslog_fields
      type: grok
      parse_fields: ["raw"]
      drop_original: false
      merge: "override"
      grok_patterns:
        - '<.*>%{NUMBER}:\s%{SYSLOGTIMESTAMP:syslog_timestamp}\sUTC:\s%%{DATA:syslog_code}:\s%{GREEDYDATA}'
        - '<.*>%{SYSLOGTIMESTAMP:syslog_timestamp}\s%{DATA:syslog_hostname}\s%{DATA:process_name}\s%{GREEDYDATA}'

    - name: enrich_device_info
      type: enrich
      dataset: "network_device_chassis_dict"
      dict_key_columns: ["target_ip"]
      source_key_columns: ["rda_gw_client_ip"]
      enrich_columns: ["device_status", "hostname", "vendor", "product_id"]
      enrich_columns_as: ["device_status", "device_hostname", "device_vendor", "device_model"]
      return_empty_columns: true
      enrich_column_defaults: ["UNMANAGED", "Not Available", "Not Available", "Not Available"]

    # - name: classify_severity
    #   type: starlark
    #   script: |
    #     def apply(metric):
    #       sev = metric.fields.get("severity")
    #       if sev != None:
    #         if type(sev) == "string":
    #           sev = int(sev)
    #         if sev <= 3:
    #           metric.fields["severity_class"] = "critical"
    #         elif sev <= 5:
    #           metric.fields["severity_class"] = "warning"
    #         else:
    #           metric.fields["severity_class"] = "info"
    #       return metric
'''
Restart event gateway after adding new endpoint configuration.
Check RDA event gateway logs to make sure there are no errors with newly added endpoint configuration.
Configuration file - Syslog (UDP): rda_syslog_udp.conf
# RDA Syslog Input Plugin
#
# Receives syslog messages over UDP or TCP (plaintext or TLS).
#
[[inputs.rda_syslog]]
  enabled = true # true / false to enable or disable the endpoint
  # alias = "syslog_udp"  # Plugin alias name

  input_definition = '''
collector:

  syslog_properties:
    bind_host: "0.0.0.0"
    port: 514
    protocol: "udp"                                  # "udp" or "tcp"
    # parse_cef_format: false                        # Parse CEF messages (extracts src, dst, act, msg)
    # parse_kv_format: false                         # Parse key=value messages (needs 3+ "=" chars)
    ## OpenSearch writer tuning (only when output_stream is set)
    # worker_count: 8
    # queue_size: 200
    # flush_interval: 10                             # Seconds
    # batch_size: 4000
    # timeout: 60                                    # Seconds

  ## Writes directly to an OpenSearch pstream. Omit to use Telegraf outputs.
  output_stream:
    name: "syslog_udp_events_stream"
    type: "pstream"

  ## Glob patterns for fields/tags to remove from output.
  # field_exclude: ["Timestamp", "Appname", "Message", "MsgID", "ProcID", "Hostname"]

  # tags:
  #   input: "syslog_udp"

  ## Transformations applied in order. Types: grok, enrich, starlark.
  data_transformations:

    ## Grok: extract structured fields from raw text.
    ##   parse_fields   - Fields to parse
    ##   drop_original  - Remove parsed field after extraction
    ##   merge          - "override" replaces existing fields
    ##   grok_patterns  - Patterns to try (first match wins)
    - name: parse_syslog_fields
      type: grok
      parse_fields: ["raw"]
      drop_original: false
      merge: "override"
      grok_patterns:
        - '<.*>%{NUMBER}:\s%{SYSLOGTIMESTAMP:syslog_timestamp}\sUTC:\s%%{DATA:syslog_code}:\s%{GREEDYDATA}'
        - '<.*>%{SYSLOGTIMESTAMP:syslog_timestamp}\s%{DATA:syslog_hostname}\s%{DATA:process_name}\s%{GREEDYDATA}'

    - name: enrich_device_info
      type: enrich
      dataset: "network_device_chassis_dict"
      dict_key_columns: ["target_ip"]
      source_key_columns: ["rda_gw_client_ip"]
      enrich_columns: ["device_status", "hostname", "vendor", "product_id"]
      enrich_columns_as: ["device_status", "device_hostname", "device_vendor", "device_model"]
      return_empty_columns: true
      enrich_column_defaults: ["UNMANAGED", "Not Available", "Not Available", "Not Available"]

    # - name: classify_severity
    #   type: starlark
    #   script: |
    #     def apply(metric):
    #       sev = metric.fields.get("severity")
    #       if sev != None:
    #         if type(sev) == "string":
    #           sev = int(sev)
    #         if sev <= 3:
    #           metric.fields["severity_class"] = "critical"
    #         elif sev <= 5:
    #           metric.fields["severity_class"] = "warning"
    #         else:
    #           metric.fields["severity_class"] = "info"
    #       return metric
'''
Key configuration parameters:
| Parameter | Description |
|---|---|
bind_host |
IP address to listen on. Use 0.0.0.0 to listen on all interfaces |
port |
Port to receive syslog messages |
protocol |
Transport protocol: udp or tcp |
enable_tls |
Enable TLS for TCP connections. Requires cert_file and key_file |
parse_cef_format |
Enable CEF message parsing (extracts src, dst, act, msg) |
parse_kv_format |
Enable key=value message parsing (requires 3 or more = characters) |
worker_count |
Number of concurrent OpenSearch write workers |
batch_size |
Number of events per OpenSearch write batch |
output_stream -> name |
Target Persistent Stream name on the RDAF platform |
Restart event gateway after adding new endpoint configuration.
Check RDA event gateway logs to make sure there are no errors with newly added endpoint configuration.
1.2.2.2 SNMP Traps
The rda_snmp_trap plugin receives SNMP trap messages over UDP, maps OIDs to structured fields using a hot-reloadable template file, enriches the data, and writes directly to an OpenSearch pstream. SNMPv1, v2c, and v3 are supported with per-source IP authentication overrides.
Configuration file: rda_snmp_trap.conf
# RDA SNMP Trap Input Plugin
#
# Receives SNMP traps over UDP
#
[[inputs.rda_snmp_trap]]
  enabled = true  # true / false to enable or disable the endpoint
  # alias = "snmp_trap"  # Plugin alias name

  input_definition = '''
collector:

  snmp_trap_properties:
    bind_host: "0.0.0.0"
    port: 162
    protocol: "udp"                                  # "udp"
    ## Maps trap OIDs to structured fields. Supports template expressions:
    ##   {{vbValue[0]}}, {{vbValue[0][10:20]}}, {{snmpTrapOid}}
    ## Hot-reloaded on file changes.
    template_path: "/event_gw_config/snmptrap/trap_template.json"
    ## OpenSearch writer tuning (only when output_stream is set)
    # worker_count: 8
    # queue_size: 200
    # flush_interval: 10                             # Seconds
    # batch_size: 4000
    # timeout: 60                                    # Seconds
    ## Per-source IP auth overrides. Checked in order; first match wins.
    ## ip_spec: literal IP or regex pattern.
    # ip_specific:
    #   - ip_spec: "^192\\.168\\.1\\..*"
    #     version: "3"                               # "1", "2c", or "3"
    #     msg_flags: "authPriv"
    #     auth_protocol: "SHA"                       # MD5, SHA, SHA224, SHA256, SHA384, SHA512
    #     auth_passphrase: "authpass"
    #     priv_protocol: "AES"                       # DES, AES, AES192, AES256, AES192C, AES256C
    #     priv_passphrase: "privpass"
    #   - ip_spec: "^10\\.0\\..*"
    #     version: "2c"

  ## Writes directly to an OpenSearch pstream. Omit to use Telegraf outputs.
  output_stream:
    name: "snmp_trap_events_stream"
    type: "pstream"

  # field_exclude: ["snmpTrapOid"]                   # Glob patterns to exclude from output

  # tags:
  #   input: "snmp_trap"

  ## Transformations applied in order. Types: enrich, starlark, grok.
  data_transformations:
    - name: enrich_device_info
      type: enrich
      dataset: "network_device_chassis_dict"
      dict_key_columns: ["target_ip"]
      source_key_columns: ["rda_gw_client_ip"]
      enrich_columns: ["device_status", "hostname", "vendor", "product_id"]
      enrich_columns_as: ["device_status", "device_hostname", "device_vendor", "device_model"]
      return_empty_columns: "yes"
      enrich_column_defaults: ["UNMANAGED", "Not Available", "Not Available", "Not Available"]

    # - name: set_trap_type
    #   type: starlark
    #   script: |
    #     def apply(metric):
    #       mapping_status = metric.fields.get("mappingStatus")
    #       metric.tags["trap_type"] = "unknown" if mapping_status == "not-found" else "known"
    #       return metric

    # - name: parse_trap_message
    #   type: grok
    #   parse_fields: ["trap_message"]
    #   drop_original: false
    #   merge: "override"
    #   grok_patterns:
    #     - '%{DATA:trap_source}\s%{GREEDYDATA:trap_detail}'
'''
Key configuration parameters:
| Parameter | Description |
|---|---|
bind_host |
IP address to listen on. Use 0.0.0.0 for all interfaces |
port |
UDP port to receive SNMP traps (default: 162) |
template_path |
Path to the OID-to-field mapping template JSON file. Hot-reloaded on change |
ip_specific |
Per-source IP SNMP authentication overrides (v1, v2c, v3). Matched in order |
auth_protocol |
SNMPv3 auth protocol: MD5, SHA, SHA224, SHA256, SHA384, SHA512 |
priv_protocol |
SNMPv3 privacy protocol: DES, AES, AES192, AES256 |
output_stream -> name |
Target Persistent Stream name on the RDAF platform |
Tip
The template_path file is hot-reloaded automatically when changes are detected, eliminating the need to restart the Event Gateway service after updating trap OID mappings.
SNMP Trap configuration can be found in the below path.
Restart event gateway after adding new endpoint configuration.
Check RDA event gateway logs to make sure there are no errors with newly added endpoint configuration.
1.2.2.3 Syslog (TCP) JSON
The rda_tcp_json plugin listens for newline-delimited JSON messages over a TCP socket (plaintext or TLS). It is used to receive log events from Windows servers using either the RDA-provided Telegraf agent or the open-source version. Received messages are transformed inline and written directly to an OpenSearch pstream.
Configuration file: rda_tcp_json.conf
# RDA TCP JSON Receiver Input Plugin
#
# Listens for JSON messages over TCP (plaintext or TLS).
#
[[inputs.rda_tcp_json]]
  enabled = true # true / false to enable or disable the endpoint
  # alias = "tcp_json"  # Plugin alias name

  input_definition = '''
collector:

  tcp_json_properties:
    bind_host: "0.0.0.0"
    port: 5143
    # tls_cert: "/certs/cert.pem"             # Both tls_cert and tls_key required for TLS
    # tls_key: "/certs/key.pem"
    ## OpenSearch writer tuning (only when output_stream is set)
    # worker_count: 8
    # queue_size: 200
    # flush_interval: 10                             # Seconds
    # batch_size: 4000
    # timeout: 60                                    # Seconds

  ## Writes directly to an OpenSearch pstream. Omit to use Telegraf outputs.
  output_stream:
    name: "tcp_json_events_stream"
    type: "pstream"

  # field_exclude: ["raw_payload"]                   # Glob patterns to exclude from output

  # tags:
  #   input: "syslog_tcp_json"

  ## Transformations applied in order. Types: enrich, starlark, builtin, grok.
  data_transformations:

    # - name: enrich_device_info
    #   type: enrich
    #   dataset: "network_device_chassis_dict"
    #   dict_key_columns: ["target_ip"]
    #   source_key_columns: ["rda_gw_client_ip"]
    #   enrich_columns: ["hostname", "vendor"]
    #   enrich_columns_as: ["device_hostname", "device_vendor"]
    #   enrich_column_defaults: ["Not Available", "Not Available"]

    # - name: normalize_event
    #   type: starlark
    #   script: |
    #     def apply(metric):
    #       level = metric.fields.get("EventLevel", "")
    #       if type(level) == "string":
    #         metric.fields["event_level"] = level.lower()
    #       return metric

'''
Key configuration parameters:
| Parameter | Description |
|---|---|
bind_host |
IP address to listen on. Use 0.0.0.0 for all interfaces |
port |
TCP port to listen for JSON messages (default: 5143) |
tls_cert / tls_key |
Paths to TLS certificate and key files for encrypted connections |
worker_count |
Number of concurrent OpenSearch write workers |
batch_size |
Number of events per OpenSearch write batch |
output_stream -> name |
Target Persistent Stream name on the RDAF platform |
Restart event gateway after adding new endpoint configuration.
Check RDA event gateway logs to make sure there are no errors with newly added endpoint configuration.
Check RDA event gateway logs to make sure there are no errors with newly added endpoint configuration.
1.2.2.4 SNMP Metrics
The rda_snmp plugin actively polls SNMP metrics from network devices discovered via a RDAF Persistent Stream. It supports three collection patterns: scalar GET, full table walk (inventory), and index-based table queries for time-series metrics.
Configuration file: rda_snmp.conf
Note
For validated SNMP metrics collection configuration files for each vendor, please refer Solution Packs documentation.
# RDA SNMP Input Plugin
#
# Collects SNMP metrics from network devices.
#
# Collection types:
#   scalar_fields      - SNMP GET for single-instance OIDs (sysName, uptime)
#   table_inventories  - Full SNMP table walks for inventory data (interfaces, entities)
#   metric_collections - SNMP table queries for time-series metrics (CPU, traffic)
#
[[inputs.rda_snmp]]
  enabled = false  # true / false to enable or disable the endpoint
  # path = ["/usr/share/snmp/mibs"]                  # MIB files for OID name resolution
  # file_output_path = "/tmp/rda_snmp_output"        # Directory for file_output debug logs

  # tags = {asset_type = "network_device", vendor = "Cisco", kpi_metric = "yes" }
  # alias = "cisco_ios"

  input_definition = '''
version: "1.0"
collector:
  frequency: 300                                      # Global default collection frequency (seconds)
  # thread_pool_size: 100                            # Global concurrent SNMP workers. Default: 100

  ## Discovers target devices from a pstream.
  input_criteria:
    frequency: 600                                   # Device list refresh interval (seconds)
    pstream: "network_access_verification"           # Pstream which has target devices with verified SNMP (v1/v2/v3) credentials and vendor's SNMP sys_object_id
    query: "auth_state is 'Success' and protocol = 'SNMP' and sys_object_id contains '1.3.6.1.4.1.9.1.'"
    ip_address_field: "ip_address"                   # Pstream field with device IP
    cred_field: "used_cred"                          # Pstream field with SNMP credential

  connection_properties:
    - name: default
      retries: 2
      timeout: 10                                    # SNMP request timeout (seconds)

  ## ── scalar_fields ─────────────────────────────────────────────────
  ## SNMP GET for single-instance OIDs. Cached for use by "append" in other collections.
  scalar_fields:
    - name: system_info
      frequency: 30
      fields:
        - name: sys_name
          oid: "SNMPv2-MIB::sysName.0"
        - name: uptime
          oid: "DISMAN-EVENT-MIB::sysUpTimeInstance"
      custom_attributes:
        - name: uptime_conversion
          params:
            source_field: uptime
            output_prefix: uptime_seconds
      output_stream:
        name: "rda_snmp_metrics"
        type: "pstream"

  ## ── table_inventories ─────────────────────────────────────────────
  ## Full SNMP table walks. Always walks entire table (no index filtering).
  ## Data is cached for reference by metric_collections via "append".
  table_inventories:
    - name: interface_inventory
      mib: IF-MIB::ifXTable
      instance_oid: ifIndex
      frequency: 300
      attributes:
        ifDescr: "interface_description"
        ifAlias: "interface_alias"
        ifType: "interface_type"
        ifAdminStatus: "admin_status"
        ifOperStatus: "oper_status"
        ifName: "interface_name"
        ifIndex: "interface_index"
      custom_attributes:
        - name: interface_status_label
          params:
            admin_status_field: admin_status
            oper_status_field: oper_status
            admin_output_field: admin_status_label
            oper_output_field: oper_status_label
      transformations: ["enrich_device_info"]
      append: ["system_info.sys_name"]
      output_stream:
        name: rda_snmp_network_interfaces_inventory

  ## ── metric_collections ────────────────────────────────────────────
  ## Pattern 1 — Full Table Walk: set mib only, walks all rows
  ## Pattern 2 — Index-Based:    set mib + pstream + index_field, queries specific rows
  ## Pattern 3 — Scalar Query:   omit mib, uses SNMP GET per attribute
  metric_collections:

    ## Pattern 1: Full Table Walk
    - name: cpu
      mib: .1.3.6.1.4.1.9.9.109.1.1.1.1
      frequency: 30
      attributes:
        .1.3.6.1.4.1.9.9.109.1.1.1.1.6: "cpu_total_5sec_rev"
        .1.3.6.1.4.1.9.9.109.1.1.1.1.7: "cpu_total_1min_rev"
        .1.3.6.1.4.1.9.9.109.1.1.1.1.8: "cpu_total_5min_rev"
      custom_attributes:
        - name: cpu_usage
          params:
            source_field: cpu_total_5sec_rev
            output_field: cpu_usage
      transformations: ["enrich_device_info"]
      append: ["system_info.sys_name"]
      output_stream:
        name: rda_snmp_metrics
        type: pstream

    - name: memory
      mib: .1.3.6.1.4.1.9.9.109.1.1.1.1
      frequency: 60
      attributes:
        .1.3.6.1.4.1.9.9.48.1.1.1.2: "memory_name"
        .1.3.6.1.4.1.9.9.48.1.1.1.6: "memory_free"
        .1.3.6.1.4.1.9.9.48.1.1.1.5: "memory_used"
      transformations: ["enrich_device_info", "memory_enrichment"]
      append: ["system_info.sys_name"]
      output_stream:
        name: rda_snmp_metrics
        type: pstream

    ## Pattern 2: Index-Based Query
    - name: interface
      mib: IF-MIB::ifTable
      index_field: if_index
      frequency: 90
      attributes:
        IF-MIB::ifHCInOctets: in_octets
        IF-MIB::ifHCOutOctets: out_octets
        IF-MIB::ifDescr: interface_description
        IF-MIB::ifHighSpeed: high_speed
        IF-MIB::ifOperStatus: oper_status
        IF-MIB::ifAdminStatus: admin_status
        IF-MIB::ifIndex: interface_index
        IF-MIB::ifType: interface_type
        IF-MIB::ifInErrors: in_errors
        IF-MIB::ifOutErrors: out_errors
      custom_attributes:
        - name: interface_utilization
          params:
            speed_field: high_speed
            in_octets_field: in_octets
            out_octets_field: out_octets
      transformations: ["enrich_device_info"]
      append: ["system_info.sys_name"]
      output_stream:
        name: rda_snmp_metrics
        type: pstream

  ## Reusable transformations referenced by name above.
  data_transformations:
    - name: "enrich_device_info"
      type: enrich
      dataset: "network_device_chassis_dict"
      source_key_columns: ["target_ip"]
      dict_key_columns: ["target_ip"]
      enrich_columns: ["hostname", "product_id", "vendor"]
      enrich_columns_as: ["device_hostname", "device_model", "device_vendor"]
      return_empty_columns: "yes"
      enrich_column_defaults: ["Not Available", "Not Available", "Not Available"]

    - name: memory_enrichment
      type: starlark
      script: |
        def round(value, decimals):
            factor = 1
            for _ in range(decimals):
                factor *= 10
            return int(value * factor) / factor
        def apply(metric):
            used = metric.fields.get("memory_used")
            free = metric.fields.get("memory_free")
            if used != None and free != None:
                used = float(used)
                free = float(free)
                total = used + free
                metric.fields["memory_total"] = int(total)
                if total > 0:
                    metric.fields["memory_usage"] = round((used / total) * 100.0, 2)
            return metric
'''
Collection patterns summary:
| Pattern | When to use | Required fields |
|---|---|---|
scalar_fields |
Single-instance OIDs (sysName, uptime) | fields with OID list |
table_inventories |
Full table walk for inventory/reference data | mib, optional instance_oid |
metric_collections (Pattern 1) |
Full table walk for time-series metrics | mib only |
metric_collections (Pattern 2) |
Index-based table query | mib + index_field + pstream |
metric_collections (Pattern 3) |
Scalar GET per attribute | No mib; attributes with OIDs |
Key configuration parameters:
| Parameter | Description |
|---|---|
frequency |
Global polling interval in seconds. Can be overridden per collection |
thread_pool_size |
Maximum concurrent SNMP workers (default: 100) |
input_criteria -> pstream |
Persistent Stream from which target device IPs and credentials are discovered |
input_criteria -> query |
CFXQL filter to select devices from the pstream |
connection_properties -> timeout |
SNMP request timeout per device (seconds) |
append |
Appends cached fields from other collections (e.g., system_info.sys_name) |
Restart event gateway after adding new endpoint configuration.
Check RDA event gateway logs to make sure there are no errors with newly added endpoint configuration.
1.2.2.5 ICMP Ping Metrics
The rda_ping plugin monitors network reachability of target devices by sending ICMP ping probes. Target devices are dynamically discovered from a RDAF Persistent Stream, and results are written directly to OpenSearch.
Configuration file: rda_icmp_ping.conf
# RDA Ping Input Plugin
#
# Monitors network reachability by collecting ICMP ping metrics from target devices.
#
[[inputs.rda_ping]]
  enabled = false  # true / false to enable or disable the endpoint
  # alias = "icmp_ping"  # Plugin alias name

  input_definition = '''
collector:

  ## Get target devices from a pstream using a CFXQL filter for ICMP ping monitoring
  input_criteria:
    frequency: 300                                    # Seconds between device list refresh
    pstream: "network_access_verification"           # Pstream which has target devices with verified SNMP / SSH credentials
    query: "auth_state is 'Success' and protocol = 'SNMP'"
    # ip_address_field: "ip_address"                 # Pstream field with device IP (default: ip_address)

  ## Concurrent ping workers. Default: 100
  # thread_pool_size: 100

  ## Ping configuration (at least one required).
  ping_properties:
    - name: default
      count: 3            # Packets per target
      timeout: 5.0        # Per-packet timeout (seconds)
      interval: 1.0       # Delay between packets (seconds, min 0.2)
      size: 56            # Payload bytes
      frequency: 60       # Per-device ping interval (seconds)
      ipv4: true
      # ipv6: false

  ## Writes directly to an OpenSearch pstream. Omit to use Telegraf outputs.
  output_stream:
    name: rda_icmp_ping_metrics
    type: pstream

  # tags:
  #   region: "us-east-1"

  ## Transformations applied in order. Types: enrich, starlark, builtin, grok.
  data_transformations:
    - name: "enrich_device_info"
      type: enrich
      dataset: "network_device_chassis_dict"
      source_key_columns: ["target_ip"]
      dict_key_columns: ["target_ip"]
      enrich_columns: ["hostname", "product_id", "vendor"]
      enrich_columns_as: ["device_hostname", "device_model", "device_vendor"]
      return_empty_columns: "yes"
      enrich_column_defaults: ["Not Available", "Not Available", "Not Available"]

    # - name: classify_packet_loss
    #   type: starlark
    #   script: |
    #     def apply(metric):
    #       loss = metric.fields.get("percent_packet_loss", 0)
    #       if loss == 0:
    #         metric.fields["loss_status"] = "healthy"
    #       elif loss < 25:
    #         metric.fields["loss_status"] = "degraded"
    #       else:
    #         metric.fields["loss_status"] = "critical"
    #       return metric
'''
Key configuration parameters:
| Parameter | Description |
|---|---|
input_criteria -> pstream |
Persistent Stream from which target device IPs are discovered |
input_criteria -> query |
CFXQL filter to select devices (use "*" for all rows) |
ping_properties -> count |
Number of ICMP packets sent per target per probe cycle |
ping_properties -> timeout |
Per-packet timeout in seconds |
ping_properties -> interval |
Delay between packets in seconds (minimum: 0.2) |
ping_properties -> size |
ICMP payload size in bytes |
ping_properties -> frequency |
Probe interval per device in seconds |
thread_pool_size |
Maximum concurrent ping workers (default: 100) |
output_stream --> name |
Target Persistent Stream name on the RDAF platform |
Restart event gateway after adding new endpoint configuration.
Check RDA event gateway logs to make sure there are no errors with newly added endpoint configuration.
1.2.2.6 SSL Cert Monitoring
The rda_cert plugin monitors SSL/TLS certificate validity and expiry for URLs discovered from a RDAF Persistent Stream. It classifies certificate health and writes results directly to OpenSearch.
Configuration file: rda_cert_monitoring.conf
# RDA SSL Certificate Input Plugin
#
# Collects SSL/TLS certificate metrics for URLs discovered from a pstream.
#
[[inputs.rda_cert]]
  enabled = true
  # alias = "ssl_cert"  # Plugin alias name

  input_definition = '''
collector:

  ## Discovers target URLs from a pstream using a CFXQL filter.
  input_criteria:
    frequency: 600                                   # Seconds between URL list refresh
    pstream: "ssl_cert_stream"
    query: "*"                                       # Use "*" for all rows
    url_field: "url"                                 # Pstream field containing the URL

  ## Certificate check configuration (at least one required).
  cert_properties:
    - name: default
      timeout: 5            # Connection timeout (seconds)
      frequency: 300         # Per-URL check interval (seconds)
      # include_chain: false # Include full certificate chain

  ## Writes directly to an OpenSearch pstream. Omit to use Telegraf outputs.
  output_stream:
    name: "rda_ssl_certificate_metrics"
    type: "pstream"

  # tags:
  #   environment: "production"

  ## Transformations applied in order. Types: enrich, starlark, builtin, grok.
  data_transformations:
    - name: classify_expiry
      type: starlark
      script: |
        def apply(metric):
          expiry_days = metric.fields.get("expiry_days", None)
          if expiry_days != None:
            if expiry_days < 0:
              metric.fields["expiry_status"] = "expired"
            elif expiry_days < 30:
              metric.fields["expiry_status"] = "critical"
            elif expiry_days < 90:
              metric.fields["expiry_status"] = "warning"
            else:
              metric.fields["expiry_status"] = "healthy"
          return metric

    # - name: enrich_service_info
    #   type: enrich
    #   dataset: "service_owners_dict"
    #   source_key_columns: ["url"]
    #   dict_key_columns: ["url"]
    #   enrich_columns: ["owner", "team"]
    #   enrich_columns_as: ["service_owner", "owning_team"]
    #   enrich_column_defaults: ["Unknown", "Unknown"]
'''
Key configuration parameters:
| Parameter | Description |
|---|---|
input_criteria -> pstream |
Persistent Stream containing the list of URLs to monitor |
input_criteria -> url_field |
Pstream field that holds the URL (default: url) |
input_criteria -> frequency |
How often the URL list is refreshed from the pstream (seconds) |
cert_properties -> timeout |
TLS connection timeout in seconds |
cert_properties -> frequency |
Per-URL certificate check interval in seconds |
cert_properties -> include_chain |
When enabled, fetches and stores the full certificate chain |
output_stream -> name |
Target Persistent Stream name on the RDAF platform |
Restart event gateway after adding new endpoint configuration.
Check RDA event gateway logs to make sure there are no errors with newly added endpoint configuration.
1.2.2.7 Port (TCP) Monitoring
The rda_net_response plugin checks TCP port availability and response time for target services discovered from a RDAF Persistent Stream. Results are classified by latency and written directly to OpenSearch.
Configuration file: rda_net_response.conf
# RDA Network Response Input Plugin
#
# Collects TCP Port response metrics for target host:port addresses discovered from a pstream.
#
[[inputs.rda_net_response]]
  enabled = true
  # alias = "port_monitoring"  # Plugin alias name

  input_definition = '''
collector:

  ## Discovers target services from a pstream using a CFXQL filter.
  input_criteria:
    frequency: 60                                    # Seconds between target list refresh
    pstream: "tcp_port_list_stream"
    query: "protocol = 'tcp'"                   # Use "*" for all rows
    address_field: "source"                          # Pstream field with target address (host:port)
    # protocol_field: "protocol"                     # Pstream field with protocol (tcp)
    # send_field: "send"                             # Pstream field with payload to send
    # expect_field: "expect"                         # Pstream field with expected response substring

  ## Response check configuration (at least one required).
  net_response_properties:
    - name: default
      timeout: 5s           # Connection timeout
      read_timeout: 3s      # Read timeout after send
      frequency: 60         # Per-target check interval (seconds)

  ## Writes directly to an OpenSearch pstream. Omit to use Telegraf outputs.
  output_stream:
    name: "rda_port_health_metrics"
    type: "pstream"

  # tags:
  #   environment: "production"

  ## Transformations applied in order. Types: enrich, starlark, builtin, grok.
  data_transformations:
    - name: classify_latency
      type: starlark
      script: |
        def apply(metric):
          rt = metric.fields.get("response_time")
          if rt != None and (type(rt) == "int" or type(rt) == "float"):
            if rt < 0.05:
              metric.fields["latency_class"] = "excellent"
            elif rt < 0.2:
              metric.fields["latency_class"] = "good"
            elif rt < 1:
              metric.fields["latency_class"] = "fair"
            else:
              metric.fields["latency_class"] = "poor"
          return metric

    # - name: enrich_service_info
    #   type: enrich
    #   dataset: "service_inventory_dict"
    #   source_key_columns: ["address"]
    #   dict_key_columns: ["address"]
    #   enrich_columns: ["service_name", "owner"]
    #   enrich_columns_as: ["service_name", "service_owner"]
    #   enrich_column_defaults: ["Unknown", "Unknown"]
'''
Key configuration parameters:
| Parameter | Description |
|---|---|
input_criteria -> pstream |
Persistent Stream containing the list of target services to check |
input_criteria -> address_field |
Pstream field holding the target address in host:port format (default: source) |
input_criteria -> protocol_field |
Pstream field specifying the protocol (tcp or udp) |
input_criteria -> send_field |
Optional pstream field with payload string to send after connecting |
input_criteria -> expect_field |
Optional pstream field with expected response substring for validation |
net_response_properties -> timeout |
TCP/UDP connection timeout |
net_response_properties -> read_timeout |
Timeout to wait for a response after sending the payload |
net_response_properties -> frequency |
Per-target check interval in seconds |
output_stream -> name |
Target Persistent Stream name on the RDAF platform |
Restart event gateway after adding new endpoint configuration.
Check RDA event gateway logs to make sure there are no errors with newly added endpoint configuration.
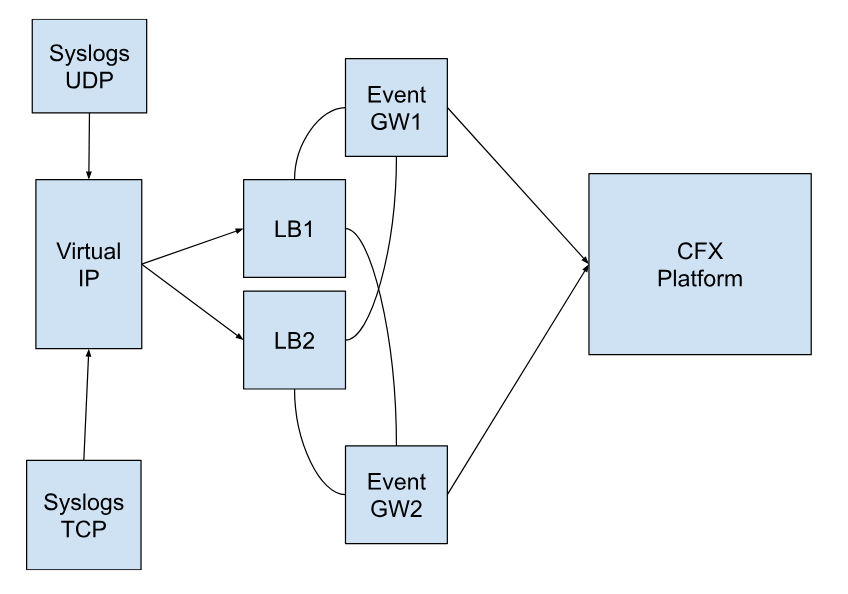
1.2.3 Installation Steps - HA
Nginx Load Balancer Deployment Steps
Configuration Diagram for Event GW → Nginx LB → CFX Platform
Prerequisites
1.) Need 2 VMs to configure the Nginx Load Balancer
2.) CFX Event Gateways
- Instructions on How to install Nginx Load Balancer for Event Gateway and Configure Keepalived for LB High Availability (active/passive)
Step-1: Login to the LB VMs and follow the steps on each LB VM
-
Create the required folder and file.
-
Create the below directory structure
-
Configure the unprivileged port range.
-
Create Nginx Configuration file as shown below.
cat > nginx.conf <<EOF

worker_rlimit_nofile 1000000;
worker_processes auto;
events {
  worker_connections 50000;
}

stream {
 upstream rda-eg-udp {
  hash $remote_addr consistent;
  zone  dns_zone 64k;
  server 192.168.1.180:514 fail_timeout=300s max_fails=1;
  server 192.168.1.63:514 fail_timeout=300s max_fails=1;
 }

 server {
  listen 514;
  proxy_pass rda-eg-udp;
  proxy_timeout 1s;
  proxy_protocol on;
  proxy_connect_timeout 1s;
  error_log /var/log/nginx/tcp_514_error.log;
 }

  server {
  listen 514 udp;
  proxy_pass rda-eg-udp;
  proxy_responses 0;
  proxy_timeout 120s;
  proxy_protocol on;
  proxy_buffer_size 10240k;
  error_log /var/log/nginx/udp_error.log;
 }
 upstream rda-eg-trap-udp {
  hash $remote_addr consistent;
  zone  dns_zone 64k;
  server 192.168.1.180:162 fail_timeout=300s max_fails=1;
  server 192.168.1.63:162 fail_timeout=300s max_fails=1;
 }

 server {
  listen 162 udp;
  proxy_pass rda-eg-trap-udp;
  proxy_responses 0;
  proxy_timeout 120s;
  proxy_protocol on;
  proxy_buffer_size 10240k;
  error_log /var/log/nginx/udp_trap_error.log;
 }

 server {
  listen 162;
  proxy_pass rda-eg-trap-udp;
  proxy_timeout 1s;
  proxy_protocol on;
  proxy_connect_timeout 1s;
  error_log /var/log/nginx/tcp_162_error.log;
 }

}

http {
 server {
  listen 9080 default_server;
  access_log off;

  location /lb-status {
      return 200 'OK';
      add_header Content-Type text/plain;
  }
  location /nginx_status {
    stub_status;
  }
 }
}

EOF
Note
The lines that are highlighted above presume two event gateways. If a user has more event gateways, add additional lines to the upstream configuration for each upstream mentioned above. At least two is the recommended number.
Note
Run the following command and note the UID value from the output. Update the UID in the user field of the nginx-docker-compose.yml file (Deploy nginx LB using the docker-compose) as shown below. For example, if the command output shows uid=1000 and gid=1000, Replace the first 1000 with the UID obtained from your system. Keep the second value unchanged.
- Deploy nginx LB using the docker-compose
cat > nginx-docker-compose.yml <<EOF
version: '3'

services:
   nginx:
     image: docker1.cloudfabrix.io/external/nginx:8.2
     network_mode: host
     user: "1000:1000"
     container_name: nginx
     volumes:
       - /opt/rdaf_nginx/conf/nginx.conf:/etc/nginx/nginx.conf
       - /opt/rdaf_nginx/logs/nginx:/var/log/nginx
     # Mounts writable temporary paths for the non-root user
     tmpfs:
       - /var/cache/nginx
       - /var/run
     restart: always
EOF
Step-2: Setup keepalived on LB VM 1
- Create
master-keepalived.conffile
global_defs {
  script_user root
  enable_script_security
}
vrrp_script chk_health {
  script "/usr/local/bin/nginx_healthcheck.sh"
  interval 2
}
vrrp_instance rdaf_vrrp_ext {
  interface ens160
  state MASTER
  virtual_router_id 11
  priority 255
  virtual_ipaddress {
    192.168.102.71/24
  }
  track_script {
    chk_health
  }
  authentication {
    auth_type PASS
    auth_pass 1a2b3c4d
  }
}
Note
Update/replace the virtual IP in the above file where highlighted as per the environment.
- Copy the file to the path below.
- Create the
nginx_healthcheck.shand copy the file in given pathNginx_healthcheck.sh
#!/bin/bash

HTTP_STATUS=$(curl -s -o /dev/null -w "%{http_code}" http://localhost:9080/lb-status)

if [[ $HTTP_STATUS -ge 200 && $HTTP_STATUS -lt 300 ]]; then
    curl -s -o /dev/null -w "%{http_code}" http://localhost:514 # dummy TCP request
    curl -s -o /dev/null -w "%{http_code}" http://localhost:162 # dummy TCP request
    exit 0  # Success
else
    curl -s -o /dev/null -w "%{http_code}" http://localhost:514 # dummy TCP request
    curl -s -o /dev/null -w "%{http_code}" http://localhost:162 # dummy TCP request
    exit 1  # Failure
fi
- copy
nginx_healthcheck.shto/usr/local/bin
- Usage of the script
- start keepalived
- To check the virtual IP in the output, run the below command.
- Configure the firewalls using the below commands.
 sudo ufw allow from 224.0.0.18
 sudo ufw allow to 224.0.0.18
 sudo ufw allow 514/udp
 sudo ufw allow 514/tcp
 sudo ufw allow 162/udp
 sudo ufw allow 162/tcp
 sudo ufw allow 9080/tcp
 sudo ufw reload
Note
If there are any changes,the necessary ports must be updated accordingly.
- Check if LB is accessible via virtual IP by running the following command
Note
The command above should return as 'OK'
Step-3: Setup keepalived on LB VM 2
- Create
backup-keepalived.conffile.
global_defs {
  script_user root
  enable_script_security
}
vrrp_script chk_health {
  script "/usr/local/bin/nginx_healthcheck.sh"
  interval 1
}
vrrp_instance rdaf_vrrp_ext {
  interface ens160
  state BACKUP
  virtual_router_id 11
  priority 100
  virtual_ipaddress {
    192.168.102.71/24
  }
  track_script {
    chk_health
  }
  authentication {
    auth_type PASS
    auth_pass 1a2b3c4d
  }
}
Note
update/replace the highlighted virtual IP in the above file. It should be the same as the previous config that was in LB1
- Copy the file to the path below
- Create the
nginx_healthcheck.shand copy the file in given pathNginx_healthcheck.sh
#!/bin/bash

HTTP_STATUS=$(curl -s -o /dev/null -w "%{http_code}" http://localhost:9080/lb-status)

if [[ $HTTP_STATUS -ge 200 && $HTTP_STATUS -lt 300 ]]; then
    curl -s -o /dev/null -w "%{http_code}" http://localhost:514 # dummy TCP request
    curl -s -o /dev/null -w "%{http_code}" http://localhost:162 # dummy TCP request
    exit 0  # Success
else
    curl -s -o /dev/null -w "%{http_code}" http://localhost:514 # dummy TCP request
    curl -s -o /dev/null -w "%{http_code}" http://localhost:162 # dummy TCP request
    exit 1  # Failure
fi
- copy
nginx_healthcheck.shto/usr/local/bin
- Usage of the script
- start keepalived
- To check the virtual IP in the output, run the below command.
Note
The Virtual IP will not show until LB2 has become active.
- Configure the firewalls using the below commands.
 sudo ufw allow from 224.0.0.18
 sudo ufw allow to 224.0.0.18
 sudo ufw allow 514/udp
 sudo ufw allow 514/tcp
 sudo ufw allow 162/udp
 sudo ufw allow 162/tcp
 sudo ufw allow 9080/tcp
 sudo ufw reload
Note
If there are any changes,the necessary ports must be updated accordingly.
- Check if LB is accessible via virtual IP by running the following command
Note
The command above should return as 'OK'
Verification Steps
Send events to virtual ip instead of event gateway IP; below is an example that you can refer to
Important
Please ensure Step 4 is performed after completing Steps 1–3.
Step 4: Enabling Log Rotation for NGINX Logs
1: Create Logrotate Configuration for NGINX
This step configures log rotation for NGINX logs located in /opt/rdaf/logs/nginx/ to prevent excessive disk usage.
- Create Logrotate Configuration for NGINX
- Paste the following content into the file
/opt/rdaf/logs/nginx/*.log {
    daily              # Rotate logs daily
    missingok          # Skip if log file is missing
    rotate 10          # Keep 10 old logs
    compress           # Compress old logs
    delaycompress      # Compress logs one day after rotation
    notifempty         # Do not rotate empty logs
    sharedscripts      # Run postrotate script once per log group

    postrotate
        if [ -f /var/run/nginx.pid ]; then
            kill -USR1 `cat /var/run/nginx.pid`
        fi
    endscript
}
Note
The kill -USR1 command signals NGINX to reopen log files after rotation, ensuring continued logging without restarting the service.
2: Test the Configuration
- Run the following command to test and force logrotate to execute
3: Enable Periodic Logrotate via Cron (Optional)
- Ensure logrotate is scheduled to run daily via cron. Check the cron job
This file should exist by default on most Linux distributions. If not, make sure the logrotate package is installed and cron is enabled.
1.2.4 SSL Configuration for endpoints
Run the below command on event gateway to generate self-signed certificate files. Fill in the answers for the below prompts.
- Country Name (2 letter code)
- State or Province Name (full name)
- Locality Name (eg, city)
- Organization Name (eg, company)
- Organizational Unit Name (eg, section)
- Common Name (eg, your name or your server's hostname)
- Email Address
Above command generates two files under the current working directory, cert.pem and key.pem
Copy above files to /opt/rdaf/event_gateway/certs directory
1.2.5 Endpoints (Legacy) Configuration
Note
In the latest release (8.2 and above), endpoints (Syslogs, SNMP Traps, etc.) have been migrated to Telegraf-powered endpoints. These custom-built Telegraf plugins are designed to seamlessly integrate with the Fabric RDAF platform and provide the following capabilities:
- High-throughput ingestion — Process events per second at scale.
- Inline transformation — Transform incoming event data at inline rates without additional pipeline overhead.
- Direct ingestion — Ingest data directly into Fabrix RDAF platform's timeseries database (OpenSearch), bypassing intermediary stages.
- Seamless integration — Custom-built Telegraf plugins that natively integrate with the Fabrix RDAF platform.
Please refer section: 1.2.2 to configure telegraf-powered endpoints.
Legacy event gateway endpoint configuration is still supported for backward compatibility.
RDA event gateway (legacy) support below end point types.
- Syslog over TCP: Recieve syslog events over TCP protocol
- Syslog over UDP: Recieve syslog events over UDP protocol
- HTTP: Receive log events over HTTP protocol
- TCP: Receive log events over TCP protocol
- SNMP Traps: Receive SNMP traps over UDP protocol
Event gateway with the default configuration for each of the above end points as shown below. The endpoint configuration file is located @ /opt/rdaf/event_gateway/config/endpoint.yml
endpoints:

# Endpoint - Syslog Log events over TCP protocol
# attrs: <Custom attributes to be added for each log event, provide one or more attributes in key: value format>
# stream: <Write the log events to a Stream within RDA Fabric>
- name: syslog_tcp_events
  enabled: false
  type: syslog_tcp_go
  port: 5140
  ssl: false
  ssl_cert_dir: /certs
  attrs:
    site_code: event_gateway_site01 # Site Name / Code where Event gateway is deployed
    archive_name: syslog_events_archive # Log archive name
  stream: "NULL"
  direct_to_stream: syslog_tcp_event_stream

# Endpoint - Syslog Log events over UDP protocol
# attrs: <Custom attributes to be added for each log event, provide one or more attributes in key: value format>
# stream: <Write the log events to a Stream within RDA Fabric>
- name: syslog_udp_events
  enabled: false
  type: syslog_udp_go
  port: 5141
  attrs:
    site_code: event_gateway_site01 # Site Name / Code where Event gateway is deployed
    archive_name: syslog_events_archive # Log archive name
  stream: "NULL"
  direct_to_stream: syslog_udp_event_stream

# Endpoint - Events over HTTP protocol
# attrs: <Custom attributes to be added for each log event, provide one or more attributes in key: value format>
# stream: <Write the log events to a Stream within RDA Fabric>
- name: http_events
  enabled: false
  type: http
  ssl: false
  ssl_cert_dir: /certs
  content_type: auto
  port: 5142
  attrs:
    site_code: event_gateway_site01 # Site Name / Code where Event gateway is deployed
    archive_name: http_events_archive # Log archive name
  stream: "NULL"
  direct_to_stream: http_event_stream

# Endpoint - Events in JSON format over TCP protocol
# attrs: <Custom attributes to be added for each log event, provide one or more attributes in key: value format>
# stream: <Write the log events to a Stream within RDA Fabric>
- name: tcp_json_events
  enabled: false
  type: tcp_json
  ssl: false
  ssl_cert_dir: /certs
  port: 5143
  attrs:
    site_code: event_gateway_site01 # Site Name / Code where Event gateway is deployed
    archive_name: tcp_json_events_archive # Log archive name
  stream: "NULL"
  direct_to_stream: tcp_json_event_stream

# Endpoint - Events from Filebeat agent
# type: filebeat - It is applicable for both Filebeat and Winlogbeat log shipping agents
# attrs: <Custom attributes to be added for each log event, provide one or more attributes in key: value format>
# stream: <Write the log events to a Stream within RDA Fabric>
- name: filebeat_events # URL is implicit, http://ip:port/filebeat_events
  type: filebeat
  enabled: false
  ssl: false
  ssl_cert_dir: /certs
  xpack_features: min
  port: 5144
  attrs:
    site_code: event_gateway_site01 # Site Name / Code where Event gateway is deployed
    archive_name: filebeat_log_events_archive # Log archive name
  stream: "NULL"
  direct_to_stream: filebeat_event_stream

# Endpoint - Windows log events from Winlogbeat agent
# type: filebeat - It is applicable for both Filebeat and Winlogbeat log shipping agents
# attrs: <Custom attributes to be added for each log event, provide one or more attributes in key: value format>
# stream: <Write the log events to a Stream within RDA Fabric>
- name: winlogbeat_events # URL is implicit, http://ip:port/winlogbeat_events
  type: filebeat
  enabled: false
  ssl: false
  ssl_cert_dir: /certs
  xpack_features: min
  port: 5145
  attrs:
    site_code: event_gateway_site01 # Site Name / Code where Event gateway is deployed
    archive_name: winlogbeat_log_events_archive # Log archive name
  stream: "NULL"
  direct_to_stream: winlogbeat_event_stream

# Endpoint - SNMP Traps over UDP protocol using go language
# attrs: <Custom attributes to be added for each trap event, provide one or more attributes in key: value format>
# stream: <Write the log events to a Stream within RDA Fabric>
- name: snmp_trap_events
  enabled: false
  type: snmp_trap_go
  port: 5146
  community: cfxrda
  attrs:
    site_code: event_gateway_site01 # Site Name / Code where Event gateway is deployed
    archive_name: snmp_trap_events_archive # Log archive name
  stream: "NULL"
  direct_to_stream: snmp_trap_event_stream
Note
As highlighted above to enable events make the particular enabled section as true
- Adding custom attributes to Event Gateway in endpoint.yml
site_code: event_gateway_site01 # Site Name / Code where Event gateway is deployed
archive_name: syslog_events_archive # Log archive name
event_gateway_name: EG01 # make it unique for each EG deployed in HA setup
- Add netstat checks to ensure that the endpoint's enabled ports are visible at the VM level.
Note
Repeat the above test for all other enabled ports (e.g., 162, 5140, etc.)
1.2.5.1 Kafka Topic-Based Endpoint Configurations
Kafka is now supported from 1.4.0, endpoints need to be updated and changed, and go-based setup is required for all settings.
- Login to event gateway installed VM and edit the
endpoint.yamlfile as shown below
- name: snmp_trap_events
  enabled: true
  type: snmp_trap_go
  port: 5146
  community: cfxrda
  attrs:
  site_code: event_gateway_site01 # Site Name / Code where Event gateway is deployed
  archive_name: snmp_trap_events_archive # Log archive name
  ##stream: "NULL"
  ##direct_to_stream: snmp_trap_event_stream
  kafka:
  - stream_name: trap_topic_kafka
    context: external
    retention.ms: "3600000"
- name: syslog_udp_events
  enabled: true
  type: syslog_udp_go
  port: 5141
  attrs:
  site_code: event_gateway_site01 # Site Name / Code where Event gateway is deployed
  archive_name: syslog_events_archive # Log archive name
  ##stream: "NULL"
  ##direct_to_stream: syslog_udp_go_event_stream
  kafka:
  - stream_name: syslog_topic_kafka
    context: external
    retention.ms: "3600000"
Creating Persistent Streams
- Login to the UI and Navigate as Follows
Navigation Path: Home -> RDA ADministration -> Persistent Streams -> Add -> Provide Pstream Name and Attributes as shown below and Click on Save
Attributes
Attributes
1.2.5.2 Enabling Kafka Endpoint in Event Gateway Go
Starting from version 3.7.2, the syslog_udp_go, syslog_tcp_go, and snmp_trap_go endpoints include the option to send messages via Kafka.
Pre-Requisites:
-
Kafka endpoints must be reachable from the event gateway
-
Make sure
/opt/rdaf/config/network_configis there on the event gateway. If the directory does not exist, the directory should be created. -
In case of edge deployments, copy the RDA network config from the RDA Administration -> Network and place in
/opt/rdaf/config/network_config/config.json -
To enable the Kafka endpoint, include the following configuration under the specified endpoint settings:
- name: syslog_udp_events
  enabled: true
  type: syslog_udp_go
  port: 5141
  attrs:
    site_code: event_gateway_site01
    archive_name: syslog_events_archive
  stream: "NULL"
  direct_to_stream: ""
  kafka:
    - stream_name: syslog_udp_event_stream
      context: datanetwork
      retention.ms: "3600000"
Parameter Name |
Description |
|---|---|
stream_name |
Specifies the Kafka topic where the messages will be pushed. |
context |
(Optional) The context to be attached to the topic. Expected values are datanetwork or external. |
retention.ms |
(Optional) The duration (in milliseconds) for which the data will be retained in the Kafka queue if not consumed. |
If the context is not provided, the default is set to external.
If retention.ms is not specified, the default is 86400000 milliseconds (1 day), as set at the broker level.
Note
To publish to both NATS and Kafka, configure the direct_to_stream option with the desired stream name and include the Kafka configuration.
- name: syslog_udp_events
  enabled: true
  type: syslog_udp_go
  port: 5141
  attrs:
    site_code: event_gateway_site01
    archive_name: syslog_events_archive
  stream: "NULL"
  direct_to_stream: "syslog_udp_event_stream"
  kafka:
    - stream_name: syslog_udp_event_kafka
      context: datanetwork
      retention.ms: "3600000"
Note
If an existing pstream is configured to listen on NATS (default), user must update the pstream configuration to listen on Kafka and restart all RDA collector services.
- To convert a pstream to listen on Kafka, make the following configuration changes:
{
 "messaging_platform_settings": {
   "platform": "kafka",
   "kafka-params": {
     "topics": [
       "syslog_udp_event_stream"
     ],
     "auto.offset.reset": "latest",
     "consumer_poll_timeout": 1.0
   }
 }
}
Detailed documentation of these changes can be accessed here
1.2.6 Log Archival
Below document provides instructions on how to setup and configure Log Archiving feature in RDA Fabric platform.
1.2.5.1 About
Log Archival is a feature in the RDA Fabric platform that allows for the storage of all real-time ingested log messages or events for extended periods, ranging from 6 months to 1 year or more. These logs are stored in a compressed format at a rate of 80% to 90%.
The supported target is any S3 API compatible object storage.
As the first step, you need to configure a log archival repository that points to an S3 object storage endpoint. Each log archival repository may contain one or more named archives, which store the logs in a compressed format with minute-level granularity.
In addition, you need to configure the Event Gateway to save logs to one of the configured log archival repositories. Archived log data can be recalled or replayed at any time using RDA bots or the rdac command-line utility.
1.2.5.2 Add Log Archival Repository
Log archival repository can be configured through RDAF platform's UI portal or through rdac command-line utility.
Adding a Log Archival repository to utilize RDA Fabric platform's S3 storage using the rdac CLI.
Login as rdauser user into one of the RDA Fabric platform VMs using an SSH client (ex: putty) on which rdac CLI was installed.
Run the following rdac command to add a Log Archival repository and to utilize RDA Fabric platform's S3 object storage service.
--repo: Specify Log Archival repository name
--retention: Specify in number of days after which older Log Archival data to be deleted/purged
--prefix: Specify a prefix which can be used to identify archived logs (ex: production or stage etc)
Tip
Please note that when you add a Log Archival repository using the rdac CLI command to utilize RDA Fabric platform's S3 object storage service, it will automatically appear in the RDA Fabric's UI under Configuration → RDA Integrations → Log Archives
Adding a Log Archival repository using external S3 object storage in the RDA Fabric Portal through UI.
- Login into RDAF platform's UI portal
- Click on Configuration → RDA Integrations → Log Archives → Add Repository
Tip
Before configuring the log archival repository in the RDA Fabric platform, create an S3 bucket with read, write, and delete permissions on the target S3 object storage. This step is only necessary when external S3 object storage is being used.
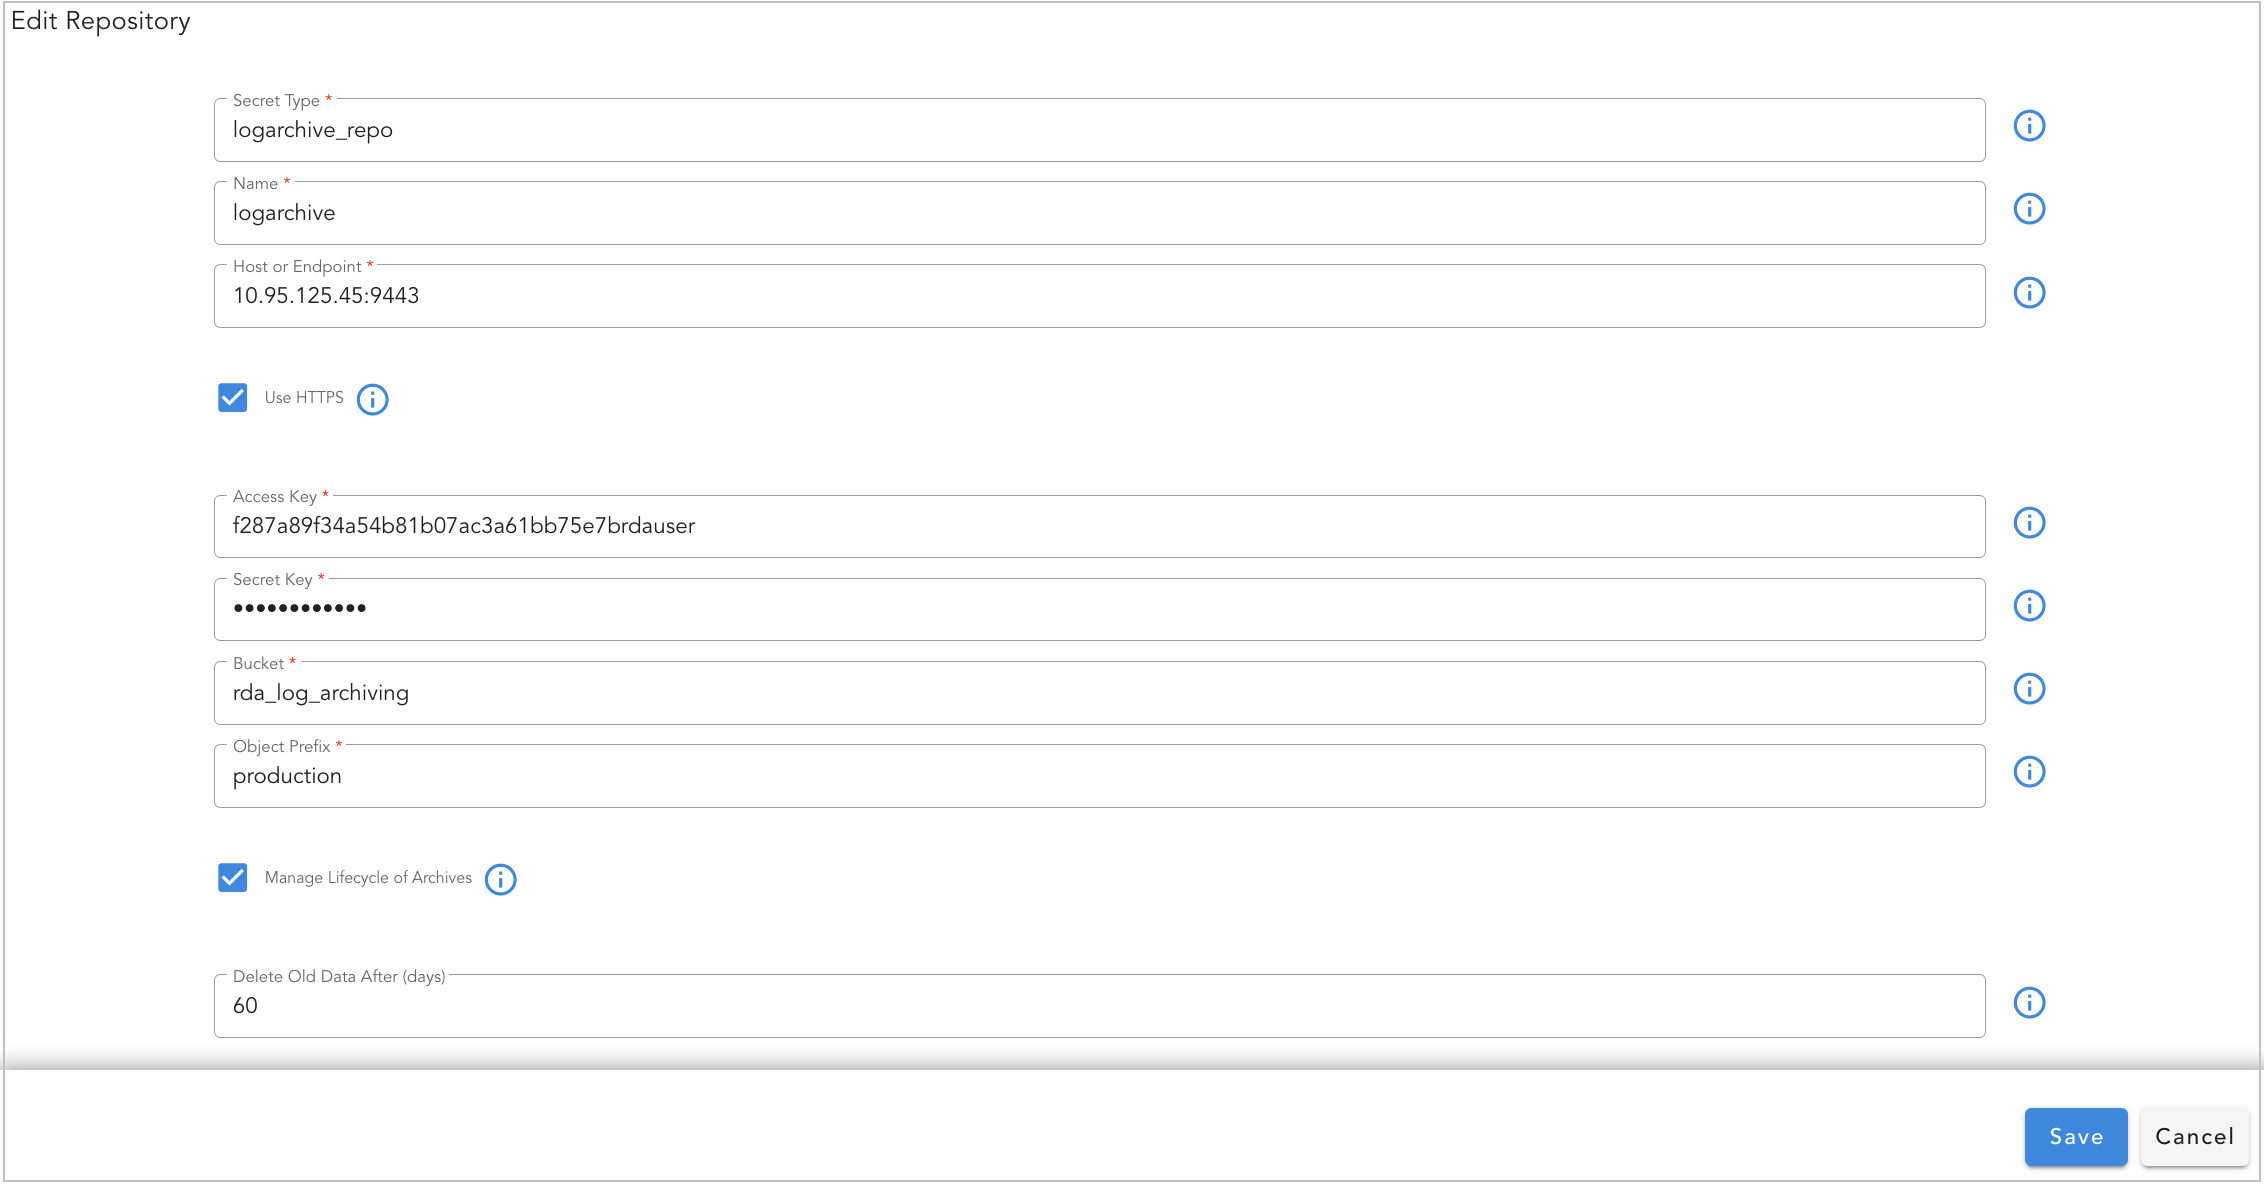
Field Name |
Mandatory | Description |
|---|---|---|
Name |
yes | Enter Log Archival repository name |
Host or Endpoint |
yes | S3 API compatible storage DNS Name or IP Address |
Use HTTPS |
no | Select this option to enable S3 APIs to be encrypted over HTTP protocol |
Access Key |
yes | Enter Access Key to access the configured S3 bucket for Log Archival repository |
Secret Key |
yes | Enter Secret Key to access the configured S3 bucket for Log Archival repository |
Bucket |
yes | Specify the S3 bucket name that is configured for Log Archival repository |
Object Prefix |
no | Specify a prefix which can be used to identify archived logs (ex: production or stage etc) |
Manage Lifecycle of Archives |
no | Select this option if the older Log Archival data to be deleted/purged after certain amount of time |
Delete Old Data After (days) |
no | Specify in number of days after which older Log Archival data to be deleted/purged |
1.2.5.3 Configure Log Archival Repository in Event Gateway
After configuring the Log Archival repository on RDA Fabric platform, Event Gateway need to be configured to utilize the configured repository to start archiving the ingested logs.
Log in as the rdauser user (or another configured user) to the machine where the RDA Event Gateway is installed using an SSH client (e.g., PuTTY).
- Update Event Gateway
serviceconfiguration:
Edit the Event Gateway's main configuration file /opt/rdaf/event_gateway/config/main/main.yml and enable Log Archival repository configuration as shown below.
# This is the main configuration for Event Gateway.
# Changes to this file only take affect after Event Gateway container restart

# Name of the site at which Even Gateway is deployed
# If not specified, uses ENV variable RDA_SITE_NAME. This option will override ENV variable value
site_name: event_gateway_site01

# Number of processes for publishing messages to RDA Stream. This will override ENV variable NUM_PROCESSES
num_procs: 1

...
...

# Log archival settings
archival:
    enabled: true
    # local directory where log files (JSONs and then .gz files) will be saved
    local_dir: /tmp/log_archive/

    # Name of the archival. Must be only letters and digits and optionally _-
    name: "acme_log_archive"

    # Local .gz files are deleted immediately after copying to destination (minio or s3)
    # If not able to push to minio, how long to keep in local directory
    local_retain_max_hours: 2

    # Archival destination. If not specified, archival will be disabled
    destination_repository: "logarchive_repo"
enabled: true to enable or false to disable Log Archival configuration
local_dir: default is set to /tmp/log_archive/. This path is used to temporarily store Log Archival data locally when the configured S3 object storage is inaccessible.
name: Specify Log Archival name
local_retain_max_hours: Specify number of hours to retain the Log Archival data locally when the configured S3 object storage is inaccessible. Local .gz files are deleted immediately after copying them to the repository on S3 object storage. Default value is 2 (hours)
destination_repository: Specify the Log Archival repository name that is configured in section 2.1
- Update Event Gateway
endpointconfiguration:
Log Archival is optional and it can be configured for each endpoint.
Edit Event Gateway's endpoint configuration file /opt/rdaf/event_gateway/config/endpoint.yml and configure the Log Archival for each endpoint.
Tip
The archive_name parameter is optional. When NOT configured for an endpoint, the Log Archive name that is configured in the Event Gateway's main.yml configuration file will be used.
endpoints:

# Endpoint - Syslog Log events over TCP protocol
# attrs: <Custom attributes to be added for each log event, provide one or more attributes in key: value format>
# stream: <Write the log events to a Stream within RDA Fabric>
- name: syslog_tcp_events
  enabled: true
  type: syslog_tcp
  port: 5140
  ssl: false
  ssl_cert_dir: /certs
  attrs:
    site_code: event_gateway_site01 # Site Name / Code where Event gateway is deployed
    archive_name: syslog_tcp_log_archive # Log archive name
  stream: "NULL"
  direct_to_stream: syslog_tcp_event_stream

# Endpoint - Syslog Log events over UDP protocol
# attrs: <Custom attributes to be added for each log event, provide one or more attributes in key: value format>
# stream: <Write the log events to a Stream within RDA Fabric>
- name: syslog_udp_events
  enabled: true
  type: syslog_udp
  port: 5141
  attrs:
    site_code: event_gateway_site01 # Site Name / Code where Event gateway is deployed
    archive_name: syslog_udp_log_archive # Log archive name
  stream: "NULL"
  direct_to_stream: syslog_udp_event_stream
archive_name: Specify the log archive name (optional).
Please restart the Event Gateway container after making the above changes.
Tip
Please check rda-event-gateway service logs to verify there are no configuration errors.
1.2.5.4 Log Archive Management using rdac CLI
rdac CLI supports Log Archival feature configuration and management using the below commands.
- Following are the available sub commands
Sub Commands |
Description |
|---|---|
| replay | Replay the data from given archive for a specified time interval with specified label |
| repos | List of all log archive repositories |
| add-platform | Add current platform Minio as logarchive repository |
| names | List archive names in a given repository |
| data-size | Show size of data available for given archive for a specified time interval |
| data-read | Read the data from given archive for a specified time interval |
| download | Download the data from given archive for a specified time interval |
| merge-files | Merge multiple locally downloaded Log Archive (.gz) filles into a single CSV/Parquet file |
Log Archive Replay: replay
It replays the archived log data from a given log archive name for a specified time interval.
Options:
--repo: Specify the Log Archival repository name
--name: Specify the Log Archival name for an endpoint
--from: Specify the start date and time from which log messages should be replayed. ISO datetime format is supported. (ex: 2023-10-29T20:45:24 or Oct 29 2023, 10am etc)
--to: Specify the end date and time up to which log messages should be replayed. ISO datetime format is supported. (ex: 2023-10-29T20:45:24 or Oct 29 2023, 10am etc)
--max_rows: Specify the maximum number of log messages to retrieve. When not specified, all log messages within the specified time duration will be replayed. (Optional)
--speed: Specify the log replay speed. 1 means close to the original speed. < 1 means slower than original. > 1 means faster than original. Please note that these speeds are approximate and cannot be guaranteed. 0 means no introduced latency, it will attempt to replay as fast as possible. (Optional) default value is set to 1
--batch_size: Specify the number of log messages to retrieve in each iteration. (Optional) default value is set to 100
--stream: Specify the stream name for ingesting the replayed log messages.
--label: Specify a custom label or name (e.g., 'production logs replay') to tag the replayed log messages. This label is useful for reporting and identifying different replay actions. (Optional)
--site: Specify the RDA Worker site name where the log replay job should be submitted.
Please refer to the below rdac logarchive replay command as an example.
rdac logarchive replay --repo logarchive \
    --name syslog_tcp_log_archive \
    --from 'Oct 29 2023, 10am' --to 'Oct 20 2023, 11.30pm' \
    --max_rows 2 \
    --stream syslog_tcp_event_stream_replay \
    --site rda-site-01
@dm:logarchive-replay
    repo = 'logarchive' &
    archive = 'syslog_tcp_log_archive' &
    from = '2023-10-29 10:00:00' &
    minutes = -12240 &
    to = '2023-10-20 22:00:00' &
    label = 'Replay from CLI' &
    max_rows = 2 &
    speed = 0 &
    batch_size = 100

--> @rn:write-stream name = 'syslog_tcp_event_stream_replay'

{
  "status": "started",
  "reason": "",
  "now": "2023-10-29T21:07:00.412547",
  "pipeline-name": "log_replay: Replay from CLI",
  "status-subject": "tenants.032a23f3e54444f4b4e3ae69e7a3f5fb.worker.group.f4a56ba6388c.direct.45b07876",
  "jobid": "8fd1d6109881409090fde448215002b3",
  "attributes": {},
  "pipeline-checksums": {
    "log_replay: Replay from CLI": "9651d110"
  }
}
Completed:
[
  {
    "archive_name": "syslog_tcp_log_archive",
    "raw": "<14>1 2023-10-29T20:45:24.299351Z - - - - - \ufeff2023-10-29T20:45:24.299093+00:00 k8rdapfm01 kernel: [430992.418760] [UFW BLOCK] IN=tunl0 OUT=cali9e5fd88ad03 MAC= SRC=192.168.126.117 DST=192.168.110.222 LEN=112 TOS=0x00 PREC=0x00 TTL=62 ID=58098 DF PROTO=UDP SPT=50442 DPT=53 LEN=92 MARK=0x10000 ",
    "rda_gw_client_ip": "192.168.125.45",
    "rda_gw_ep_name": "syslog_tcp_events",
    "rda_gw_ep_type": "syslog_tcp",
    "rda_gw_timestamp": "2023-10-29T20:45:24.584935+00:00",
    "rda_stream": "NULL",
    "site_code": "event_gateway_site01",
    "syslog_facility": "user",
    "syslog_facility_num": 1,
    "syslog_severity": "INFORMATIONAL",
    "syslog_severity_num": 6
  },
  {
    "archive_name": "syslog_tcp_log_archive",
    "raw": "<14>1 2023-10-29T20:45:24.547496Z - - - - - \ufeff2023-10-29T20:45:24.547242+00:00 k8rdapfm01 systemd[1]: run-docker-runtime\\x2drunc-moby-e84a74691b038cbc0729e2f689b2dd2bc5f12636555c68aad763d5c6e977b54f-runc.dLNMgh.mount: Succeeded.",
    "rda_gw_client_ip": "192.168.125.45",
    "rda_gw_ep_name": "syslog_tcp_events",
    "rda_gw_ep_type": "syslog_tcp",
    "rda_gw_timestamp": "2023-10-29T20:45:24.595768+00:00",
    "rda_stream": "NULL",
    "site_code": "event_gateway_site01",
    "syslog_facility": "user",
    "syslog_facility_num": 1,
    "syslog_severity": "INFORMATIONAL",
    "syslog_severity_num": 6
  }
]
Add Log Archive Repositories: add-platform
It adds RDA platform's S3 object storage service (Minio) as a logarchive repository
Options:
--repo: Specify Log Archival repository name
--retention: Specify in number of days after which older Log Archival data to be deleted/purged
--prefix: Specify a prefix which can be used to identify archived logs (ex: production or stage etc)
Please refer to the below rdac logarchive add-platform command as an example.
List Log Archive Repositories: repo
It lists all configured log archive repositories
Please refer to the below rdac logarchive repos command as an example.
[
  {
    "name": "demo_logarchive",
    "endpoint": "192.168.125.11:9443",
    "bucket": "tenants.a7bdea6599b44623b230f69526e9d543",
    "object_prefix": "demo_logs/"
  },
  {
    "name": "logsrepo",
    "endpoint": "s3.isv.scality.com",
    "bucket": "cfx-125-11",
    "object_prefix": "/"
  },
  {
    "name": "platform_repo",
    "endpoint": "192.168.125.11:9443",
    "bucket": "tenants.a7bdea6599b44623b230f69526e9d543",
    "object_prefix": "demo"
  }
]
List Log Archives with a Repository: names
It lists log archive names in a given log archival repository.
Options:
--repo: Specify Log Archival repository name
Please refer to the below rdac logarchive names command as an example.
[
  {
    "arhive_name": "sythentic-syslogs",
    "num_days": 275,
    "first_day": "2022/12/06",
    "last_day": "2023/10/04"
  }
]
List Log Archives Data Size: data-size
It shows the size of data (in bytes) available for given log archive for a specified time interval
Options:
--repo: Specify Log Archival repository name
--name: Specify the Log Archival name for an endpoint
--from: Specify the start date and time from which log messages should be replayed. ISO datetime format is supported. (ex: 2023-10-29T20:45:24 or Oct 29 2023, 10am etc)
--minutes: Specify the time in minutes relative to the date and time specified in the --from option.
Please refer to the below rdac logarchive data-size command as an example.
rdac logarchive data-size --repo logarchive \
    --name syslog_events_archive \
    --from 'Oct 10 2023, 10am' --minutes 30
+---------------------+-------------------+------------------------+
| Timestamp           |   Number of Files | Compressed Data Size   |
|---------------------+-------------------+------------------------|
| 2023-10-10T10:00:00 |                 1 | 22,441                 |
| 2023-10-10T10:01:00 |                 1 | 21,588                 |
| 2023-10-10T10:02:00 |                 1 | 19,009                 |
| 2023-10-10T10:03:00 |                 1 | 24,985                 |
...
...
| 2023-10-10T10:27:00 |                 1 | 18,662                 |
| 2023-10-10T10:28:00 |                 1 | 19,322                 |
| 2023-10-10T10:29:00 |                 1 | 21,968                 |
| 2023-10-10T10:30:00 |                 1 | 20,764                 |
| TOTAL               |                31 | 650,720                |
+---------------------+-------------------+------------------------+
Read Data from Log Archive: data-read
It reads the data from a given log archive for a specified time interval and prints the output on the console.
Options:
--repo: Specify Log Archival repository name
--name: Specify the Log Archival name for an endpoint
--from: Specify the start date and time from which log messages should be replayed. ISO datetime format is supported. (ex: 2023-10-29T20:45:24 or Oct 29 2023, 10am etc)
--minutes: Specify the time in minutes relative to the date and time specified in the --from option.
Please refer to the below rdac logarchive data-read command as an example.
rdac logarchive data-read --repo logarchive \
    --name syslog_events_archive \
    --from 'Oct 10 2023, 10am' \
    --minutes 30 \
    --max_rows 2
[
{
  "rda_gw_ep_type": "syslog_udp",
  "rda_gw_seq": 3666473,
  "raw": "<163>2023-10-10T10:00:00.318Z R810-dev-2.engr.cloudfabrix.com Hostd: error hostd[36F40B70] [Originator@6876 sub=Default opID=0778c9cb] Unable to convert Vigor value 'centos8-64' of type 'char const*' to VIM type 'Vim::Vm::GuestOsDescriptor::GuestOsIdentifier'\n",
  "rda_gw_client_ip": "192.168.158.210",
  "rda_gw_ep_name": "syslog_udp_events",
  "rda_gw_timestamp": "2023-10-10T10:00:00.349091+00:00",
  "rda_stream": "syslog_udp_event_stream",
  "syslog_facility": "local4",
  "syslog_facility_num": 20,
  "syslog_severity": "ERROR",
  "syslog_severity_num": 3,
  "site_code": "event_gateway_site01",
  "archive_name": "syslog_events_archive"
},
{
  "rda_gw_ep_type": "syslog_udp",
  "rda_gw_seq": 3666474,
  "raw": "<163>2023-10-10T10:00:00.319Z R810-dev-2.engr.cloudfabrix.com Hostd: error hostd[36840B70] [Originator@6876 sub=Default opID=0778c9ca] Unable to convert Vigor value 'centos8-64' of type 'char const*' to VIM type 'Vim::Vm::GuestOsDescriptor::GuestOsIdentifier'\n",
  "rda_gw_client_ip": "192.168.158.210",
  "rda_gw_ep_name": "syslog_udp_events",
  "rda_gw_timestamp": "2023-10-10T10:00:00.349602+00:00",
  "rda_stream": "syslog_udp_event_stream",
  "syslog_facility": "local4",
  "syslog_facility_num": 20,
  "syslog_severity": "ERROR",
  "syslog_severity_num": 3,
  "site_code": "event_gateway_site01",
  "archive_name": "syslog_events_archive"
},
]
Download Log Data from Log Archive: download
It downloads the compressed log data (.gz) files from given log archive for a specified time interval.
Options:
--repo: Specify Log Archival repository name
--name: Specify the Log Archival name for an endpoint
--from: Specify the start date and time from which log messages should be replayed. ISO datetime format is supported. (ex: 2023-10-29T20:45:24 or Oct 29 2023, 10am etc)
--minutes: Specify the time in minutes relative to the date and time specified in the --from option.
Please refer to the below rdac logarchive download command as an example.
rdac logarchive download --repo logarchive --name syslog_events_archive \
    --from 'Oct 10 2023, 10am' \
    --minutes 1440 \
    --out ./log_archive_download
Downloaded object /syslog_events_archive/2023/10/10/10/00/2d2b42a9.gz
Downloaded object /syslog_events_archive/2023/10/10/10/01/2d2b42a9.gz
Downloaded object /syslog_events_archive/2023/10/10/10/02/2d2b42a9.gz
Downloaded object /syslog_events_archive/2023/10/10/10/03/2d2b42a9.gz
...
Downloaded object /syslog_events_archive/2023/10/10/10/14/2d2b42a9.gz
Downloaded object /syslog_events_archive/2023/10/10/10/15/2d2b42a9.gz
Merge Log Data files: merge-files
It merges multiple locally downloaded Log Archive (.gz) filles into a single CSV/Parquet file.
Please refer to the below rdac logarchive merge-files command as an example.
rdac logarchive merge-files --folder ./log_archive_download/syslog_events_archive/2023/10/25/10/10/ \
    --tofile ./log_archive_download/log_archive_merge.csv
Total rows in final dataframe: 1
{
  "mem_total_gb": 47.034,
  "mem_available_gb": 26.113,
  "mem_percent": 44.5,
  "mem_used_gb": 19.703,
  "mem_free_gb": 1.327
}
Saving CSV file: /logarchive
1.2.5.5 Log Archive Replay
Archived log messages can be replayed on-demand as per user's requirement either using rdac logarchive CLI or through RDA Fabric platform's UI portal.
Tip
For log messages replay using rdac logarchive CLI, please refer Log Archival Management using rdac CLI section.
The steps below outline how to replay log messages from the RDA Fabric platform's UI portal.
1. Login into UI portal and go to Main Menu --> Configuration --> RDA Integrations --> Log Archives --> Click on Log Archive Repository --> Select one of the Log Archive name and click on Replay
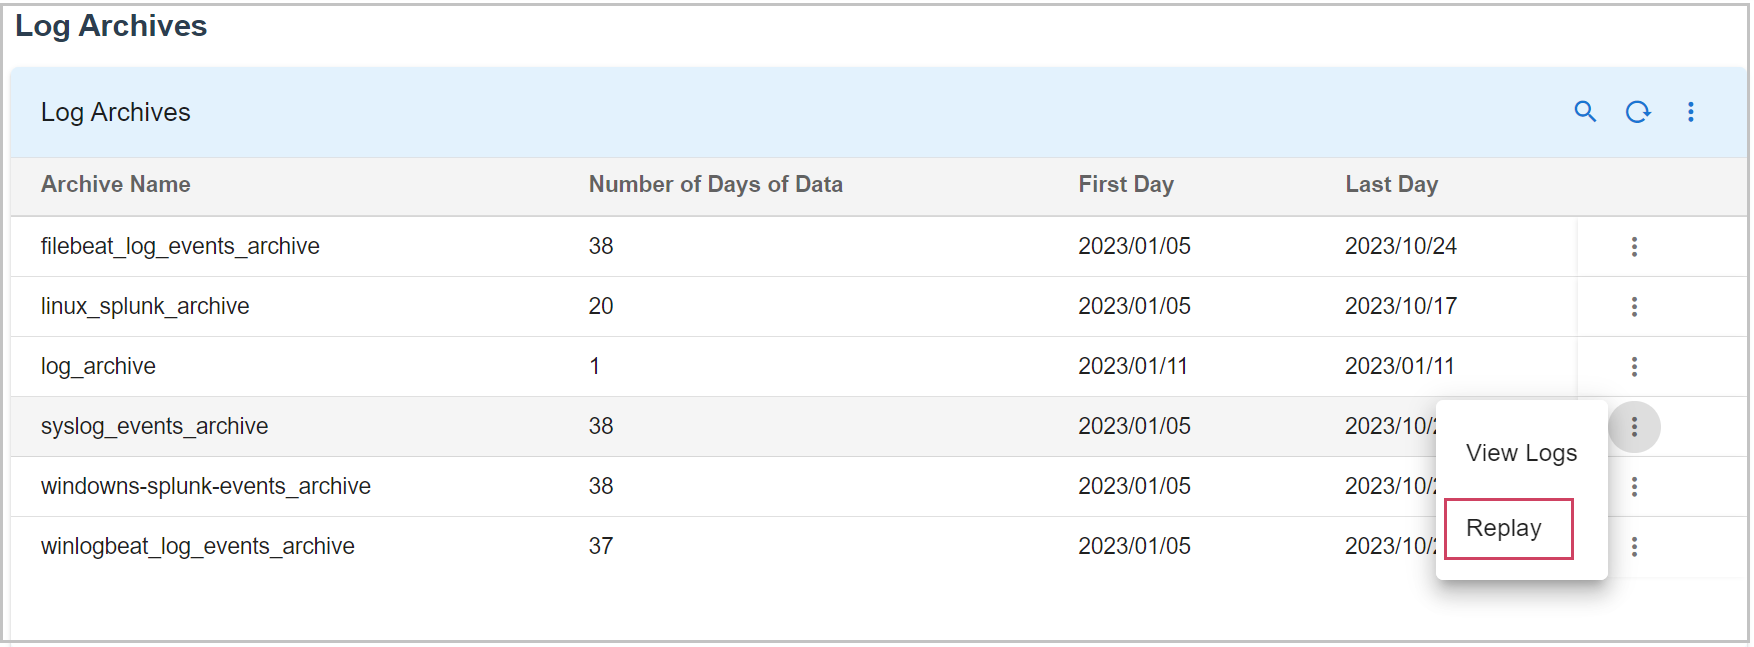
2. After Clicking on Replay you need to give the UTC Timeslot of your required logs to replay as shown below in the Screenshot
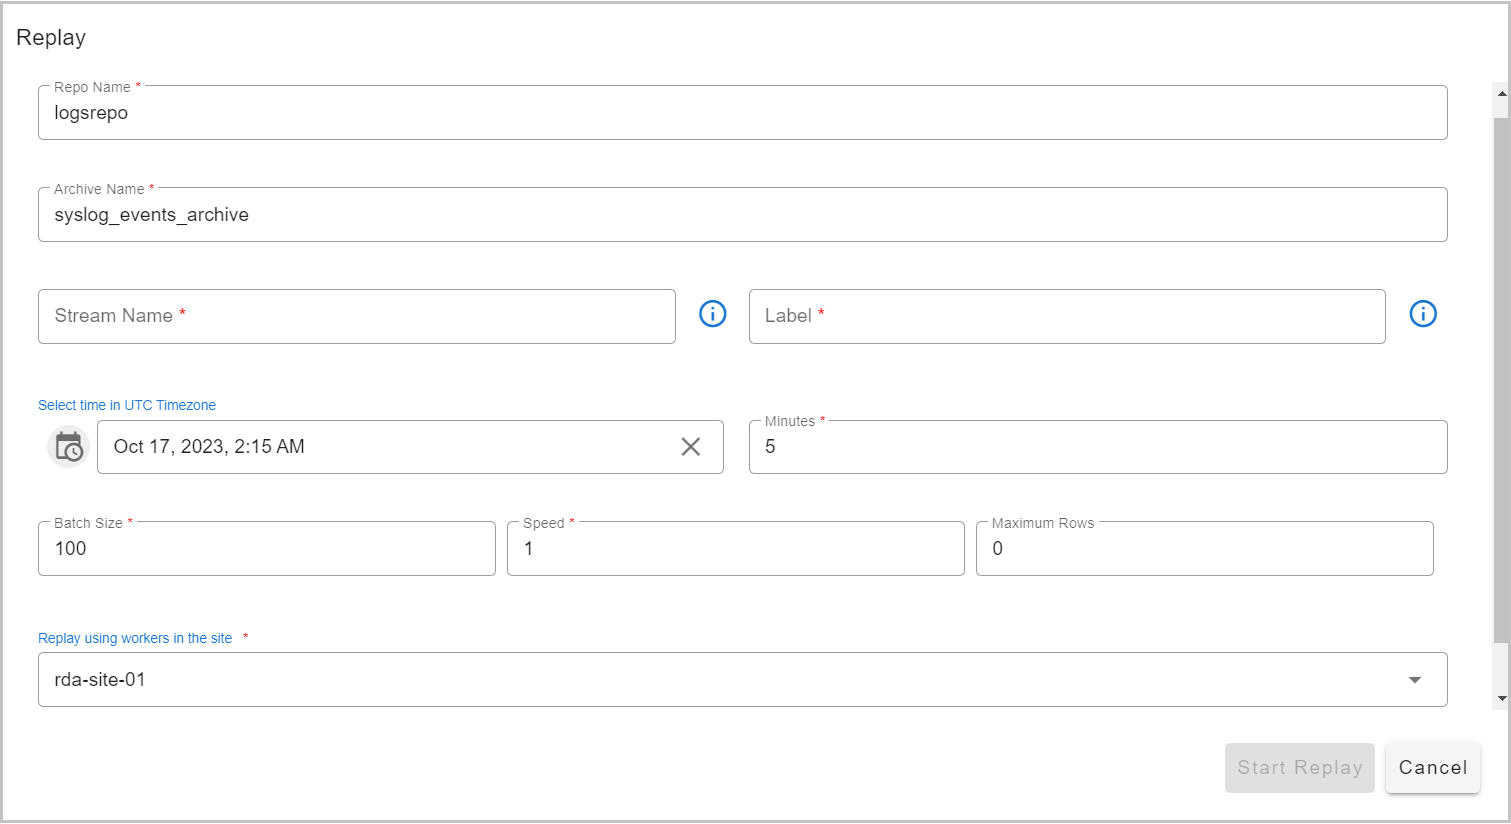
Note
Specify the stream name for ingesting the replayed log messages. Specify Label name (e.g., 'production logs replay') to tag the replayed log messages. This label is useful for reporting and identifying different replay actions.
1.2.5.6 Log Archive Bots
RDA Fabric platform also provides logarchive bots which can be used in RDA pipelines. Below screenshot shows the available logarchive bots.
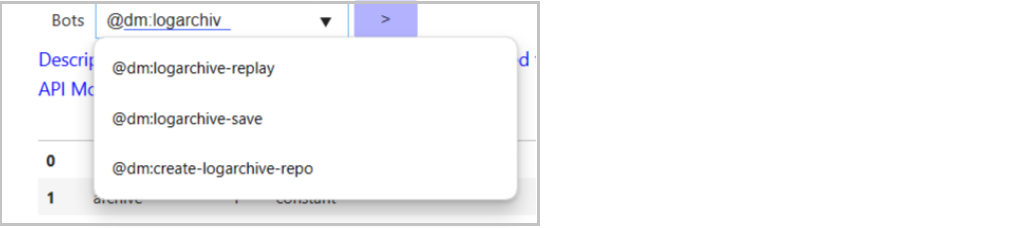
- The following pipeline provides an example on how to use
logarchive-replaybot within a RDA pipeline.
@dm:logarchive-replay repo = "logarchive_repo" and
                archive = 'syslog_tcp_log_archive' and
                from = "2023-10-26 17:24:14" and
                minutes = 30 and
                batch_size = 100

--> @rn:write-stream name = 'logarchive_replay_stream'
[
  {
    "archive_name": "syslog_tcp_log_archive",
    "raw": "<14>1 2023-10-29T20:45:24.299351Z - - - - - \ufeff2023-10-29T20:45:24.299093+00:00 k8rdapfm01 kernel: [430992.418760] [UFW BLOCK] IN=tunl0 OUT=cali9e5fd88ad03 MAC= SRC=192.168.126.117 DST=192.168.110.222 LEN=112 TOS=0x00 PREC=0x00 TTL=62 ID=58098 DF PROTO=UDP SPT=50442 DPT=53 LEN=92 MARK=0x10000 ",
    "rda_gw_client_ip": "192.168.125.45",
    "rda_gw_ep_name": "syslog_tcp_events",
    "rda_gw_ep_type": "syslog_tcp",
    "rda_gw_timestamp": "2023-10-29T20:45:24.584935+00:00",
    "rda_stream": "NULL",
    "site_code": "event_gateway_site01",
    "syslog_facility": "user",
    "syslog_facility_num": 1,
    "syslog_severity": "INFORMATIONAL",
    "syslog_severity_num": 6
  },
  {
    "archive_name": "syslog_tcp_log_archive",
    "raw": "<14>1 2023-10-29T20:45:24.547496Z - - - - - \ufeff2023-10-29T20:45:24.547242+00:00 k8rdapfm01 systemd[1]: run-docker-runtime\\x2drunc-moby-e84a74691b038cbc0729e2f689b2dd2bc5f12636555c68aad763d5c6e977b54f-runc.dLNMgh.mount: Succeeded.",
    "rda_gw_client_ip": "192.168.125.45",
    "rda_gw_ep_name": "syslog_tcp_events",
    "rda_gw_ep_type": "syslog_tcp",
    "rda_gw_timestamp": "2023-10-29T20:45:24.595768+00:00",
    "rda_stream": "NULL",
    "site_code": "event_gateway_site01",
    "syslog_facility": "user",
    "syslog_facility_num": 1,
    "syslog_severity": "INFORMATIONAL",
    "syslog_severity_num": 6
  }
]
1.2.7 Adding Addtional Attributes
1. How to add additional attribute to EG in the endpoint.yml file
Attributes
-
site_code:
event_gateway_site01# Site Name / Code where Event gateway is deployed -
archive_name:
syslog_events_archive# Log archive name -
event_gateway_name: EG01 # make it unique for each EG deployed in HA setup
2. Add netstat checks to make sure endpoint enabled ports are visible at the VM level
3. Once the RDA backend is up and running, validate that messages are coming from all event gateways by looking at event_gateway_name value in the data stream
1.2.8 Migration: Native Event Gateway to Telegraf
This section walks you through the steps to migrate from the Native Event Gateway to Telegraf-based event collection. Follow each step carefully to ensure a smooth transition without data loss.
Note
- Stream column names and event structure may change after migrating from the Native Event Gateway to Telegraf.
- Existing alert rules, parsers, dashboards, and stream mappings must be reviewed and updated based on the new event data format to avoid any disruption in monitoring or alerting.
Step-1: Stop Event Gateway Container
Before making any configuration changes, stop the running Event Gateway container to prevent data inconsistencies during the migration.
Step-2: Disable Native Event Gateway Endpoints
Once the container is stopped, disable all native Event Gateway endpoints to ensure no traffic is processed through the old pipeline. Edit the endpoint configuration file:
Update all enabled endpoints from enabled: true to enabled: false.
Step-3: Update Telegraf Main Configuration
Update the Telegraf main configuration file with the correct host IP, project ID, and hostname values for your environment.
[global_tags]
host_ip = "192.168.105.92"        # Update with your host IP
projectid = "25cfec6b-d5b3-4d85-9b7c-f7dc137035d5"   # Update with your project ID

[agent]
interval = "60s"
round_interval = true
metric_batch_size = 1000
metric_buffer_limit = 10000
collection_jitter = "0s"
flush_interval = "60s"
flush_jitter = "0s"
precision = "0s"
logtarget = "file"
logfile = "/logs/telegraf.log"
logfile_rotation_max_size = "10MB"
logfile_rotation_max_archives = 10
debug = false
quiet = false
hostname = "services-90.qa.engr.cloudfabrix.com"   # Update with your hostname
omit_hostname = false

[[inputs.cpu]]
interval = "120s"
percpu = false
totalcpu = true
collect_cpu_time = true
report_active = true
core_tags = false
tags = {category = "host_os_metrics"}

[[processors.strings]]
  [[processors.strings.lowercase]]
    tag_key = "*"
    field_key = "*"
    measurement = "*"

[[outputs.discard]]
[outputs.discard.tagpass]
category = ["host_os_metrics"]
Step-4: Add and Update Required Telegraf Config Files
Verify that all required Telegraf input configuration files are present in the conf.d directory.
Ensure the following configuration files exist:
If any file is missing, create or restore it before proceeding. Update the required configuration values within each file to match your environment.
Note
Enable the required plugins by changing the enabled value from false to true in the respective .conf files.
rda_syslog_udp_events.conf — sample
[[inputs.rda_syslog]]
enabled = false
tags = { input = "syslog_udp" }

input_definition = '''
collector:
  syslog_properties:
    bind_host: "0.0.0.0"
    port: 5141
    protocol: "udp"
    worker_count: 8
    queue_size: 200
    flush_interval: 10
    batch_size: 8000
    timeout: 60
  field_exclude: [ "Timestamp", "Appname", "Message", "MsgID", "ProcID", "Hostname" ]
  output_stream:
    name: "syslog_udp_events_stream"
    type: "pstream"

  data_transformations:
    - name: syslog_grok
      type: grok
      parse_fields: ["raw"]
      drop_original: false
      merge: "override"
      grok_patterns:
        - '.*%%{DATA:syslog_code}:.*Interface %{DATA:interface_name},.changed\sstate\sto\s%{GREEDYDATA:state}'
        - '.*%%{DATA:syslog_code}:.*Interface %{DATA:interface_name},.*'
        - '<.*>%{NUMBER}:\s%{SYSLOGTIMESTAMP:syslog_timestamp}\sUTC:\s%%{DATA:syslog_code}:\s%{GREEDYDATA}'
        - '<.*>%{SYSLOGTIMESTAMP:syslog_timestamp}\s%{DATA:syslog_hostname}\s%{DATA:process_name}\s%{GREEDYDATA}'
    - name: network_inventory_enrich
      type: enrich
      dataset: "network_device_chassis_dict"
      dict_key_columns: ["target_ip"]
      source_key_columns: ["rda_gw_client_ip"]
      enrich_columns: ["device_status", "hostname", "vendor", "product_id"]
      enrich_columns_as: ["device_status", "device_hostname", "device_vendor", "device_model"]
      return_empty_columns: true
      enrich_column_defaults: ["UNMANAGED", "Not Available", "Not Available", "Not Available"]
'''
rda_snmp_trap_events.conf — sample (SNMPv2)
[[inputs.rda_snmp_trap]]
enabled = false
tags = { input = "snmp_trap" }

input_definition = '''
collector:
  snmp_trap_properties:
    bind_host: "0.0.0.0"
    port: 162
    template_path: "/event_gw_config/snmptrap/trap_template.json"
    worker_count: 8
    queue_size: 200
    flush_interval: 1
    batch_size: 8000
    timeout: 60

  output_stream:
    name: "snmp_trap_events_stream"
    type: "pstream"

  data_transformations:
    - name: network_inventory_enrich
      type: enrich
      dataset: "network_device_chassis_dict"
      dict_key_columns: ["target_ip"]
      source_key_columns: ["rda_gw_client_ip"]
      enrich_columns: ["device_status", "hostname", "vendor", "product_id"]
      enrich_columns_as: ["device_status", "device_hostname", "device_vendor", "device_model"]
      return_empty_columns: true
      enrich_column_defaults: ["UNMANAGED", "Not Available", "Not Available", "Not Available"]
'''
rda_snmp_trap_eventsv3.conf — sample (SNMPv3)
# SNMP Trap Events (SNMPv3)
[[inputs.rda_snmp_trap]]
  enabled = false

  input_definition = '''
collector:
  snmp_trap_properties:
    bind_host: "0.0.0.0"
    port: 162
    template_path: "/event_gw_config/snmptrap/trap_template.json"
    community: "cfxrda"
    ip_specific:
      - ip_spec: ".*"
        version: "3"
        msg_flags: "authPriv"
        auth_protocol: "SHA"
        auth_passphrase: "AuthPass123"
        priv_protocol: "DES"
        priv_passphrase: "PrivPass123"

  output_stream:
    name: "snmp_trap_event_stream"
    type: "pstream"

  tags:
    site_code: "event_gateway_site01"
    archive_name: "snmp_trap_events_archive"
    customerId: "dcc8bd538e7348f78dc9d70d83b33abf"
    projectId: "bac3e686-ee54-11f0-bc9f-ced489f103b8"
    customerTag: "CFX"
'''
Step-5: Start Event Gateway Container
Once all configurations are in place, start the Event Gateway container to apply the changes and resume event collection through Telegraf.
Step-6: Verify Telegraf Logs
Monitor the Telegraf logs to confirm it is running correctly and ingesting events without errors.
Look for any error or warning messages and ensure events are being collected as expected.
1.2.9 RDA Event Gateway Upgrade Steps
Tip
For latest version of RDA Event Gateway agent, please refer release notes.
Step-1: Login to the RDA Event Gateway agent installed VM
Step-2: Navigate to the directory location where RDA Event Gateway agent was installed.
Step-3: Edit the docker-compose file for the RDA Event Gateway.
User's need to edit the RDA Event Gateway agent tag and update it based on the requirements.
Step-4: Save and Exit
Step-5: Run the following commands to upgrade the RDA Event Gateway agent. (Note: Use the appropriate docker-compose filename if it differs from the one mentioned below.)
docker-compose -f event-gateway-docker-compose.yml down

docker-compose -f event-gateway-docker-compose.yml pull

docker-compose -f event-gateway-docker-compose.yml up -d
Step-6: Use the docker ps -a command as shown below to ensure that the RDA Event Gateway agent is up and running.
b6861c4f79b5 docker2.cloudfabrix.io:443/external/ubuntu-rda-event-gateway:8.2.1 "/bin/bash -c 'cd /o…" 1 minutes ago Up 1 minutes deployment-scripts-rda_event_gateway-1
Tip
In version 8.2.1 or above, the RDA Event Gateway agent introduces enhanced Syslog TCP/UDP endpoints, developed in Go (lang), to boost event processing rates significantly and optimize system resource utilization.
-
New Syslog TCP Endpoint Type: syslog_tcp_go
-
New Syslog UDP Endpoint Type: syslog_udp_go
To use syslog_tcp_go, syslog_udp_go, or both, please follow the steps below.
Note
Before updating, take a backup of endpoint.yml. If there are two Event Gateways, make a backup from each one.
Edit endpoint.yaml using the below mentioned command
-
Change type:syslog_udp to type:syslog_udp_go
-
Change type:syslog_tcp to type:syslog_tcp_go
- name: syslog_tcp_events
  enabled: true
  type: syslog_tcp_go
  port: 5140
  ssl: false
  ssl_cert_dir: /certs
  attrs:
    site_code: event_gateway_site01 # Site Name / Code where Event gateway is deployed
    archive_name: syslog_events_archive # Log archive name
  stream: "NULL"
  direct_to_stream: syslog_tcp_event_stream

# Endpoint - Syslog Log events over UDP protocol
# attrs: <Custom attributes to be added for each log event, provide one or more attributes in key: value format>
# stream: <Write the log events to a Stream within RDA Fabric>
- name: syslog_udp_events
  enabled: true
  type: syslog_udp_go
  port: 5141
  attrs:
    site_code: event_gateway_site01 # Site Name / Code where Event gateway is deployed
    archive_name: syslog_events_archive # Log archive name
  stream: "NULL"
  direct_to_stream: syslog_udp_event_stream
- Restart the RDA Event Gateway Agent
Run the command below to get the RDA Event Gateway agent container ID.
Run the command below to restart the RDA Event Gateway agent container.
Please wait for 30 seconds and use the command below to check RDA Event Gateway agent logs for any errors
1.3 RDA Edge Collector Installation
Note
Edge Collector or Edge Collector Agent wherever mentioned below in the Document refers to same component.
Prerequisites:
- Linux OS
- Memory - 8GB
- Disk - 50GB
- Python 3.7.4 or above
-
Docker Version (18.09.2 or above)
-
Docker Compose (1.27.x and above)
Installation Steps:
Step-1:
The RDA Edge Collector agent registers and communicates with the RDAF platform using a configuration file that contains your tenant ID, data fabric access tokens, and object storage credentials.
Download RDA Fabric Configuration from the portal by going to Configuration --> RDA Administration --> Network and copy it to the local filesystem where the edge collector agent is going to be installed.
- Save the file as
rda_network_config.json
- Create the below directory structure
sudo mkdir -p /opt/rdaf/network_config
sudo mkdir -p /opt/rdaf/edgecollector/cred
sudo chown -R `id -u`:`id -g` /opt/rdaf
- Copy the downloaded RDA Fabric configuration file as shown below.
Step-2: Docker Login
Run the below command to create and save the docker login session into CloudFabrix's secure docker repository.
Step-3: Create Docker Compose File
Create docker compose configuration file for RDA Edge Collector as shown below.
Tip
Note-1: Optionally change the edge collector's group name (also known as Site) in the docker-compose file by updating the agent-group-name value. In this example, the edge collector's group name is specified as ec-group-01
Note-2: Adjust mem_limit and memswap_limit as per the workload requirements. In the below configuration, these parameters are set to 6GB
cd /opt/rdaf/edgecollector

cat > rda-edgecollector-docker-compose.yml <<EOF
version: '3.1'
services:
 rda_edgecollector_agent:
  image: 'cfxregistry.cloudfabrix.io/cfxcollector:daily'
  container_name: rda_edgecollector_agent
  restart: always
  network_mode: host
  mem_limit: 6G
  memswap_limit: 6G
  volumes:
   - /opt/rdaf/network_config:/network_config
   - /opt/rdaf/edgecollector:/cfxedgecollector
   - /opt/rdaf/edgecollector/cred:/cred
  environment:
   RDA_NETWORK_CONFIG: /network_config/rda_network_config.json
   PYTHONPATH: /opt/cfx-rda-edgeagent
  logging:
   driver: "json-file"
   options:
    max-size: "25m"
    max-file: "5"
  ulimits:
   nproc:
    soft: 64000
    hard: 128000
   nofile:
    soft: 64000
    hard: 128000
  entrypoint:
   - /bin/bash
   - '-c'
   - >-
    cd /opt/cfx-rda-edgeagent/src/; python -c 'import edgecollector_rda_agent ;
    edgecollector_rda_agent.run()' --creddir /cred/ --agent-group-name ec-group-01

EOF
cd /opt/rdaf/edgecollector

docker-compose -f rda-edgecollector-docker-compose.yml pull
docker-compose -f rda-edgecollector-docker-compose.yml up -d
Step-5: Check Edge Collector Status
Check Edge Collector agent status using docker ps command and ensure that it is up and running, without any restarts. If you see that if it is restarting, make sure you copied the RDA network config file to the correct location.
Step-6: Verify RDA Edge Collector in RDA Fabric portal
A newly installed Edge Collector will authenticate with the RDA Fabric platform and it will show up in RDA Fabric portal under Fabric Health --> Agents .
Step-7: Verify Edge Collector using RDA Client (rdac) utility
If you have installed RDA Client (rdac) command line utility, you can also verify newly created Edge Collector using rdac agents command.
1.3.1 RDA Edge Collector Upgrade Steps
Step-1: Login to the EC agent installed VM
Step-2: Navigate to the location where EC agent was previously installed. see the example below.
Step-3: Edit the docker-compose file for the EC agent using a local editor (e.g. vi).
Edit and update EC agent tag – Tag x → Tag 3.7.2Step-4: Save and Exit
Step-5: Please run the following commands
docker-compose -f < docker-compose file name> down

docker-compose -f < docker-compose file  name> pull

docker-compose -f < docker-compose file name>  up -d
Step-6: Use the docker ps -a command as shown below to ensure that the RDA docker instances are up and running.