AI Administration Overview
The AI Administration module provides a unified operational view of all AI assets, configurations, tools, and usage inside Fabrix.ai. It is the central control plane where administrators, platform engineers, and AI Ops teams can manage:
- AI models
- Guardrail models
- MCP tools
- Prompt templates
- Personas
- Usage patterns
- Project lifecycle (Dev -> Test -> Production)
This page helps organizations maintain governance, observability, and scalability for all AI-driven workflows running on Fabrix.ai.
The AI Administration dashboard provides a comprehensive view of your AI infrastructure and operations. The interface is divided into several key sections:
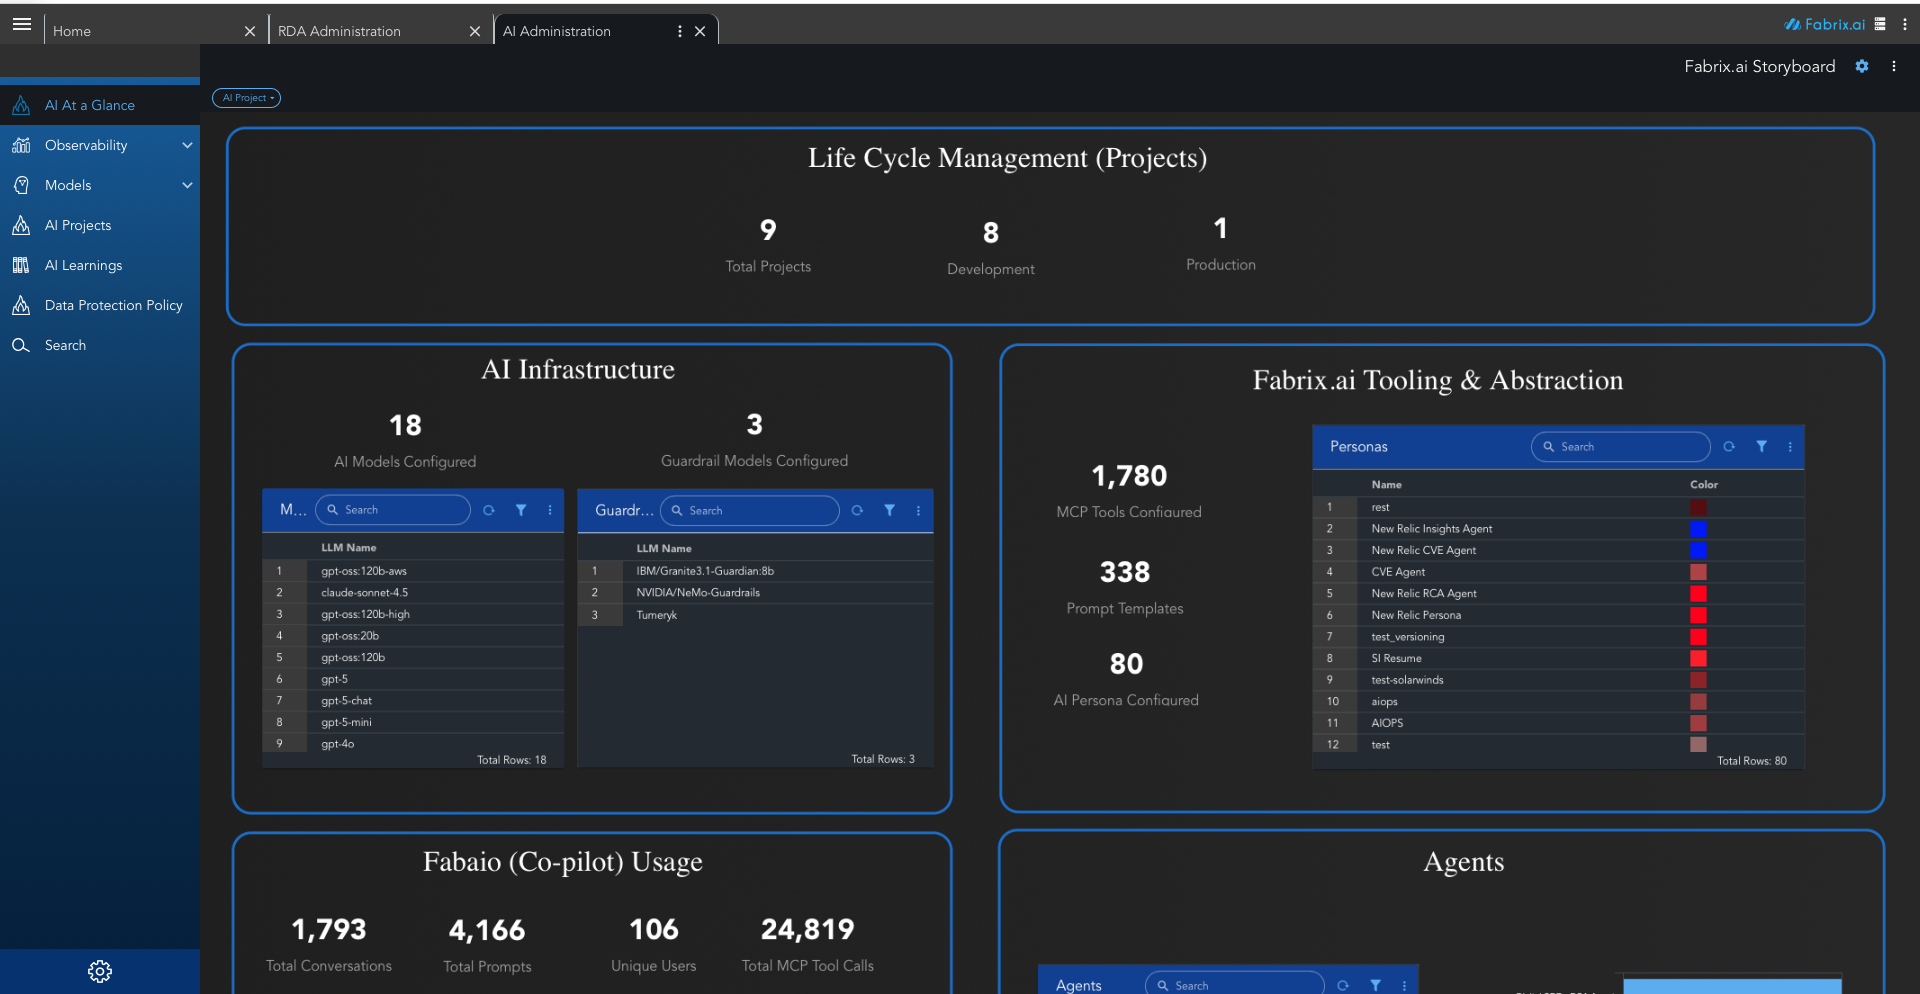
AI at a Glance
A high-level summary dashboard that shows your entire AI estate in one page, including:
- Number of AI models configured
- Guardrail models
- Tools and prompt templates
- Personas
- Co-pilot (Fabaio) usage statistics
- Active agents
- Task executions and workflows
This is the quickest way to understand platform-wide AI activity.
Observability
The Observability section provides comprehensive monitoring and analysis of AI system performance, usage patterns, and operational health. It includes detailed dashboards and analytics to track runtime behavior, costs, and system efficiency.
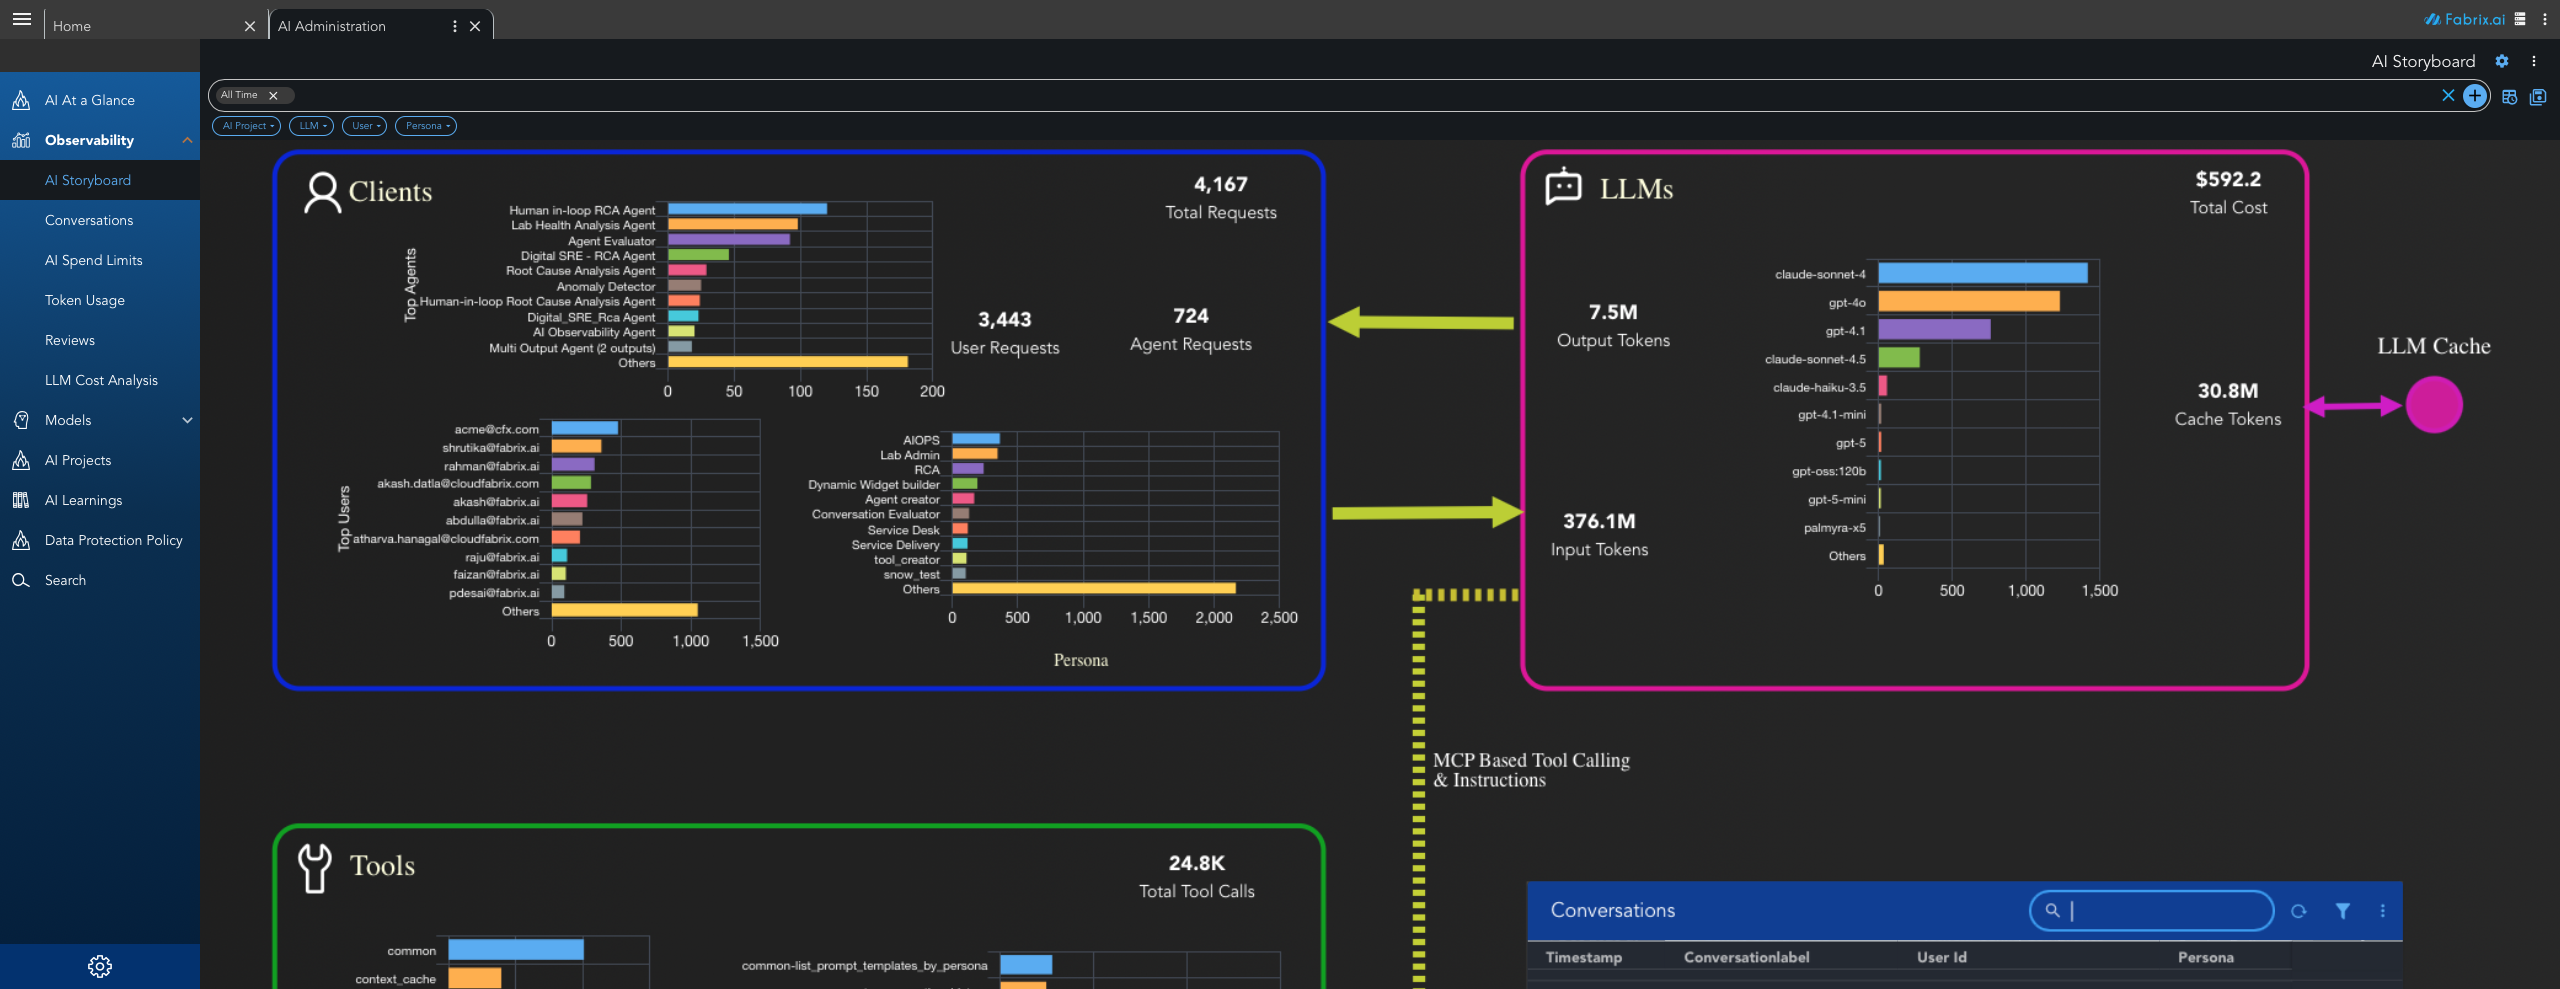
1. AI Storyboard
AI Storyboard provides a visual, comprehensive overview of your AI operations across multiple dimensions. It serves as the central observability dashboard, displaying key metrics and insights in an organized, easy-to-understand format.
- Projects Overview - Displays the total count of AI projects in your organization. Shows project distribution by name, indicating which projects have the highest activity (e.g., Staging, Agent Creator, New Relic). Displays the breakdown of projects by lifecycle stage (Development vs. Production).
- Clients Analysis - Aggregated count of all requests, broken down into User Requests (direct user interactions) and Agent Requests (automated agent-driven requests). Lists the most active agents with their usage counts (e.g., Human in-loop RCA Agent, Lab Health Analysis Agent, Agent Evaluator). Shows user activity by email address and their associated roles (e.g., AIOPS, Lab Admin, RCA, Dynamic Widget builder, Agent creator).
- LLM Usage and Cost - Shows overall expenditure across all LLM models, total output tokens generated, and total input tokens consumed. Displays usage distribution across different models (e.g., claude-sonnet-4, gpt-4o, gpt-4.1, claude-sonnet-4.5, gpt-5). Shows cache token statistics indicating how caching reduces token consumption.
- MCP Tool Calling & Instructions - Aggregate count of all MCP (Model Context Protocol) tool invocations. Shows tool usage across different domains including common tools, context cache operations, visualization tools, AIOps automation, network automation, lab administration, and agent creator tools. Provides detailed view of individual tool calls (e.g.,
common-list_prompt_templates_by_persona,common-get_conversation_history). - Prompt Templates (Instructions) - Lists all prompt templates with their usage counts, organized by domain (e.g., lab_administration, create_toolset, incident_remediate_recommend_template). Helps identify which instruction sets are most commonly used across the platform.
Note
AI Storyboard enables operational monitoring to quickly identify which projects, agents, and users are most active. It supports cost management by tracking LLM usage and costs, performance analysis to understand tool call patterns, and resource planning for data-driven decisions about resource allocation and scaling.
2. Conversations
The Conversations section provides a comprehensive log and management interface for all AI interactions and conversations within the platform. It enables administrators to monitor, search, filter, and analyze conversation data for operational insights, compliance, and troubleshooting.
- Conversation Information - Displays all conversations with details including Timestamp (when the conversation occurred), Conversation Label (user-defined or system-generated conversation names), User ID (email address of the user who initiated the conversation), Persona (the AI persona/agent used, e.g., AI Observability, New Relic Insights Agent), and Token Count (total tokens consumed for the conversation). Each conversation entry provides access to additional operations and details.
- Time Range Filtering - Filter conversations by time periods such as "All Time", "Today", "Last 7 Days", "Last 30 Days", or custom date ranges. This helps focus analysis on specific timeframes for trend analysis or incident investigation.
- Advanced Search and Filters - Search capabilities to quickly find specific conversations by keywords, user IDs, personas, or conversation labels. Additional filters allow narrowing results by AI Project, LLM model, User, or Persona type.
- Conversation Details - Access detailed information for each conversation including the full conversation history, messages exchanged, tool calls made, token usage breakdown, and associated metadata. This detailed view helps understand the complete context of each interaction.
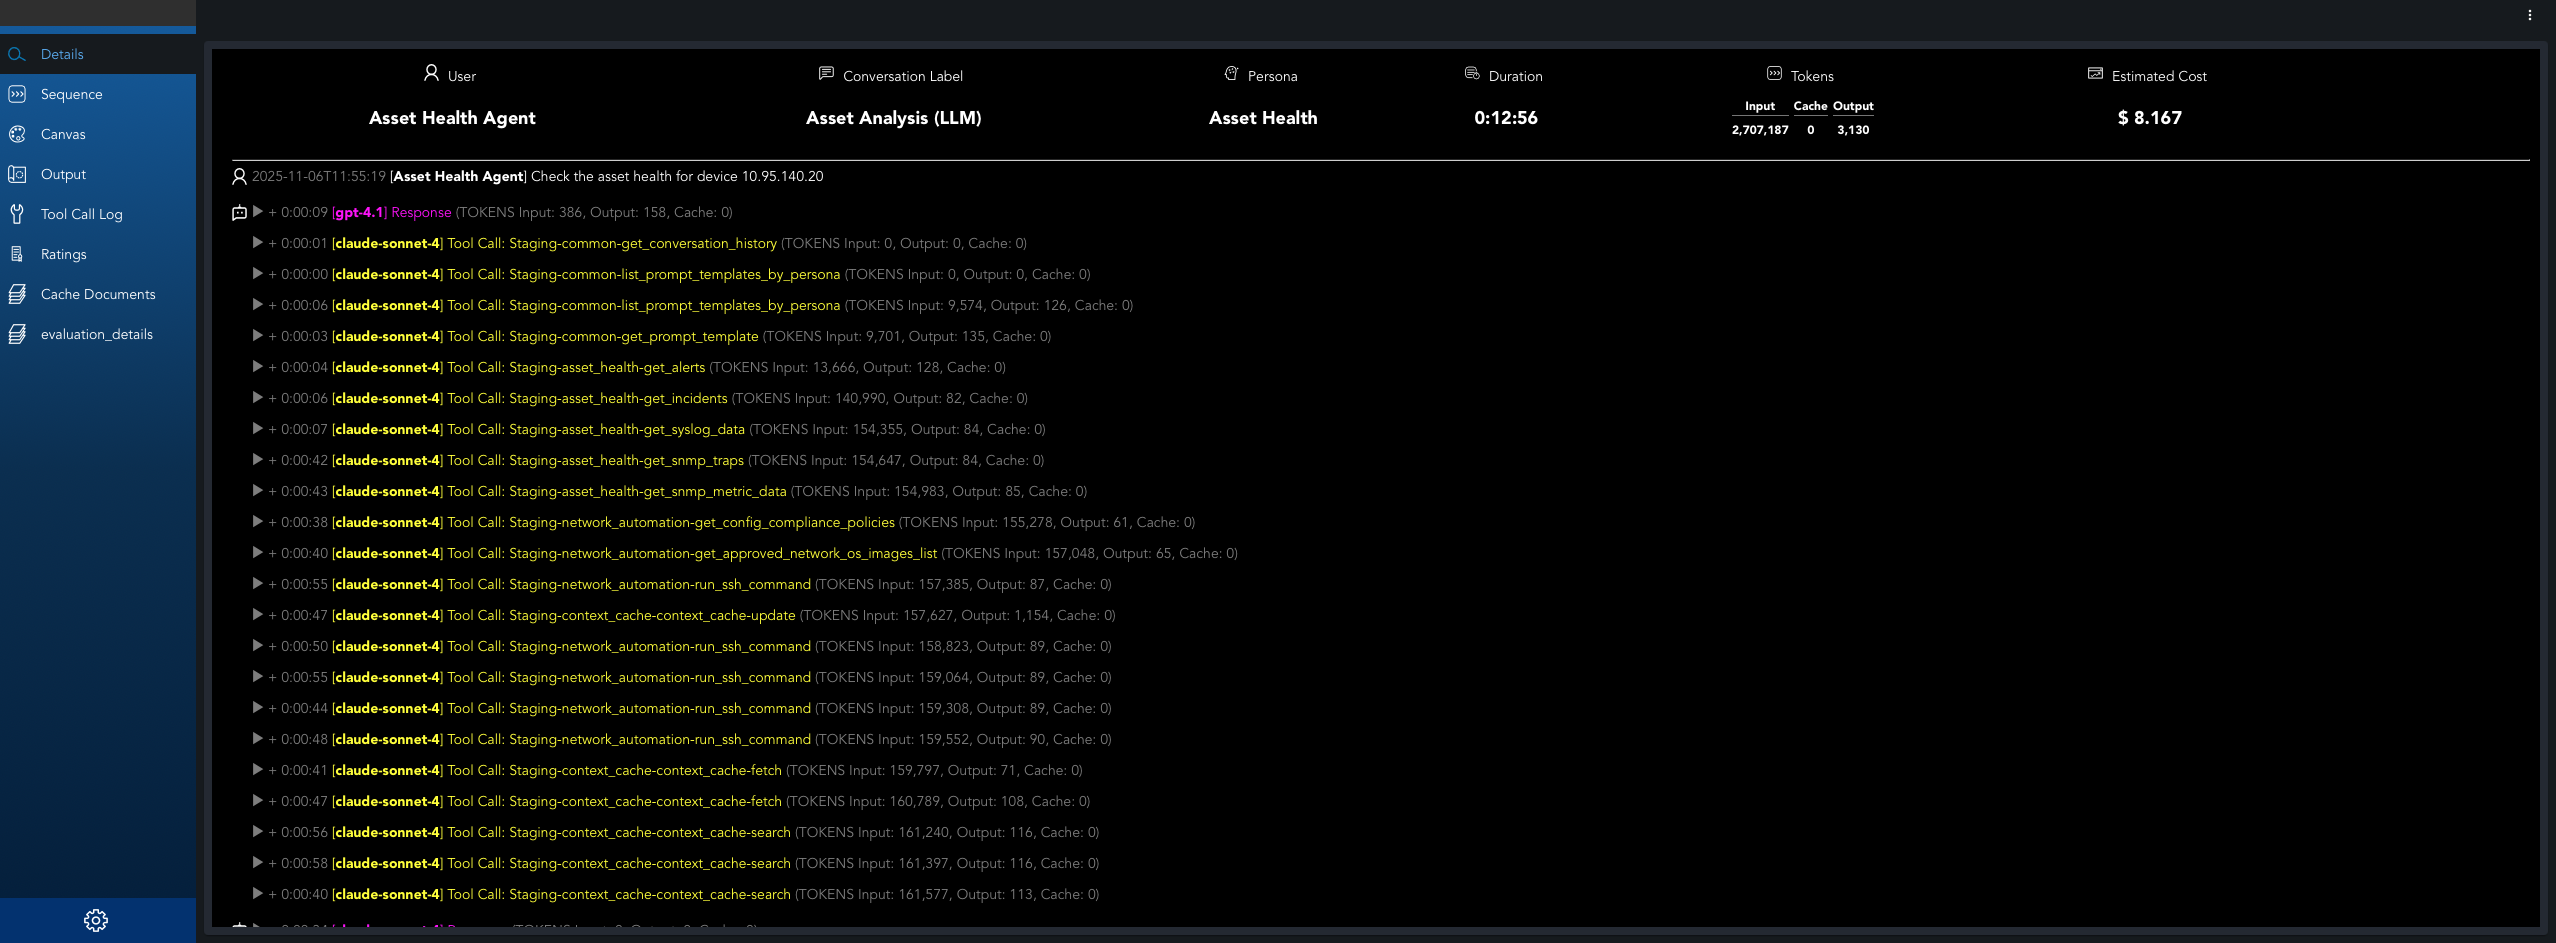
When drilling down into a specific conversation, a detailed dashboard provides comprehensive insights into the conversation's execution, performance, and resource usage.
2.1 Conversations Overview
- Conversation Flow - Displays the complete chronological list of the conversation showing user prompts, tool calls made in response, and the final LLM response after all tool calls are completed. This provides a clear view of the entire conversation execution sequence.
- Tool Call Details - When expanding individual tool calls, displays the tool input (parameters and data sent to the tool) and tool output (response received from the tool). This detailed view helps understand what data was passed to each tool and what results were returned.
- Conversation Metadata - Displays conversation identification information including conversation label, user ID, persona used, timestamp, and project association.
- Token Usage Summary - Shows total token consumption for the conversation, broken down into input tokens, output tokens, and cache tokens. Provides cost information associated with the conversation.
- Execution Metrics - Displays performance metrics such as conversation duration, response times, and completion status.
2.2 Message Sequence
Shows the complete flow of how messages are processed during a conversation. Displays how user messages are received and forwarded through the system, the communication between MCP (Model Context Protocol) client and server, the chronological order of tool invocations, and how the AI model interacts with various tools and services including conversation history retrieval, prompt template management, and context caching. Tracks the complete path from user input through tool calls and AI model processing to the final response delivery.
2.3 Tool Calls and Operations
- Tool Call Log - Lists all MCP tool calls made during the conversation, showing which tools were invoked, when they were called, and their execution status.
- Tool Call Details - For each tool call, displays the tool name, parameters passed, response received, execution time, and any errors encountered.
- Tool Usage Statistics - Aggregated statistics showing which tools were used most frequently, tool call success rates, and average execution times.
2.4 LLM Interactions
- LLM Request Details - Information about each LLM API call made during the conversation, including the model used, prompt sent, response received, and token counts.
- Model Performance - Performance metrics for each LLM interaction including latency, token efficiency, and response quality indicators.
- Cost Breakdown - Detailed cost analysis showing cost per LLM call, cost by model, and total conversation cost.
2.5 Performance Analytics
- Timeline Visualization - Visual representation of the conversation flow showing when messages were sent, tool calls were made, and LLM interactions occurred.
- Performance Metrics - Key performance indicators including average response time, total conversation duration, token efficiency, and cost per interaction.
- Bottleneck Identification - Highlights areas where the conversation experienced delays or inefficiencies, helping identify optimization opportunities.
- Sorting and Navigation - Sort conversations by timestamp, user, persona, or token count. Navigation controls allow efficient browsing through large conversation logs with configurable display options.
- Bulk Operations - Select multiple conversations for bulk actions such as export, deletion, or tagging for organizational purposes.
Note
Conversations enable audit trail tracking for compliance and auditing requirements, troubleshooting by reviewing specific conversations to diagnose issues or understand user behavior, and usage analysis to understand conversation patterns, user engagement, token consumption, and identify optimization opportunities. The detailed conversation logs help organizations maintain governance and provide transparency into AI system interactions.
3. AI Spend Limits
Monitor and manage spending limits for AI operations across projects, users, and agents.
- Spending Thresholds - Set spending thresholds and alerts to prevent budget overruns.
- Budget Tracking - Track spending against budgets in real-time.
- Cost Anomaly Detection - Identify cost anomalies and unexpected usage spikes.
- Cost Controls - Enforce cost controls to prevent budget overruns.
4. Token Usage
Detailed analytics on token consumption across all LLM interactions.
- Input Tokens - Tokens consumed for prompts and context.
- Output Tokens - Tokens generated by LLM responses.
- Cache Tokens - Tokens served from cache, reducing costs.
- Token Distribution - Token distribution by model, project, and user.
- Token Efficiency Metrics - Metrics to measure token usage efficiency.
Note
Token Usage analytics help optimize prompt engineering to reduce token consumption, identify high-cost operations, and plan capacity and budget allocation.
5. Reviews
Review and evaluate AI outputs, agent performance, and conversation quality.
- Quality Assessment - Quality assessment of AI responses.
- User Feedback Collection - Collect user feedback on AI outputs.
- Performance Ratings - Performance ratings for agents and conversations.
- Review Workflows - Review workflows for approval processes.
6. LLM Cost Analysis
Comprehensive cost breakdown and analysis for LLM usage.
- Cost per Model - Cost breakdown by model (e.g., GPT-4o, Claude Sonnet, etc.).
- Cost Trends - Cost trends over time.
- Cost by Project and User - Cost allocation by project and user.
- Cost Optimization Recommendations - Recommendations for cost optimization.
- Model Comparison - Comparison of model costs and performance.
Note
LLM Cost Analysis supports budget planning and forecasting, model selection optimization, cost allocation and chargeback, and ROI analysis for AI initiatives.
Models
Manage all AI and LLM assets configured in your organization.
Includes:
- LLM models (OpenAI, AWS Bedrock, Azure OpenAI, Llama, local models, etc.)
- Guardrail models (e.g., Granite, NeMo Guardrails)
- Model settings, versions, and performance
- Deployment lifecycle decisions
Admins can enable, disable, or fine-tune model availability for agents and workflows.
AI Projects
Represents Life Cycle Management (LCM) for all AI-related initiatives.
Programs typically move through:
- Development -> experimentation
- Testing -> validation
- Production -> fully deployed, monitored
Each project tracks:
- Assigned tools
- Models
- Personas
- Dashboards
- Execution history
This helps organizations scale AI safely with governance.
AI Learnings
A knowledge base of all learnings captured by Fabrix.ai over time.
Includes:
- Automatically generated summaries
- Insight patterns extracted from operations
- Incident -> RCA -> Fix patterns
- Historical context agents can reuse
This is the backbone of Fabrix's continuous learning system.
Data Protection Policy
Organizational controls for:
- Data governance
- Privacy requirements
- Retention rules
- PII handling
- Model usage restrictions
- Zero-trust boundaries for AI access
Admins configure what data can be used for training, inference, or storage.
Search
A unified search experience powered by your AI stack.
Allows users to search across:
- Tools
- Agents
- Projects
- Models
- Logs
- Dashboards
- Prompts
- Streams (pstreams)
Useful for quickly navigating large enterprise environments.
Dashboard Panels
The main dashboard displays key metrics and information about your AI infrastructure:
Life Cycle Management (Projects)
Shows the distribution of AI projects across different stages:
- Total Projects - Overall count of all AI initiatives
- Development - Projects in experimentation phase
- Test - Projects in validation phase
- Production - Fully deployed and monitored projects
This provides a real-time picture of how many AI initiatives are progressing through your organization.
AI Infrastructure
Displays the models powering the AI platform:
- Number of Large Language Models configured
- Number of Guardrail models
- List of all models with name and type
This reflects how capable and diverse your AI foundation is.
Fabrix.ai Tooling & Abstraction
Shows the abstraction layer components:
- Total MCP Tools - Model Context Protocol tools for integrations with external systems (vendors, databases, cloud platforms)
- Total Prompt Templates - Reusable prompt configurations
- Total AI Personas - Behavioral intelligence definitions for Agents
MCP tools allow integrations with external systems, while personas and prompts define the behavioral intelligence of Agents.
Fabaio (Co-pilot) Usage
Represents how your organization is interacting with Fabaio:
- Total conversations
- Total prompts
- Unique users
- Total tool calls
This is useful for adoption analytics and cost governance.
Agents Section
Shows configured Fabrix AI agents such as:
- RCA Agent
- CVE Agent
- Config Compliance Agent
- Spend Limit Agent
- Unplanned Change Monitor
- And more…
Each row links to deeper details and execution logs.
Key Features
Centralized Management
The AI Administration module serves as a single point of control for all AI-related assets and configurations, enabling administrators to:
- Monitor and manage AI models across different providers
- Configure guardrails and safety measures
- Track project lifecycles from development to production
- Oversee tool integrations and abstractions
Observability and Monitoring
The dashboard provides comprehensive visibility into:
- System performance metrics
- Cost analytics and token consumption
- Error rates and failed executions
- Agent behavior patterns
Governance and Compliance
Organizations can maintain governance through:
- Data protection policies
- Model usage restrictions
- Zero-trust boundaries for AI access
- Lifecycle management controls
Continuous Learning
The AI Learnings section captures and stores:
- Automatically generated summaries
- Operational insights and patterns
- Historical context for agent reuse
- Incident resolution patterns