vSphere Observability Module for Cisco FSO Platform
1. Introduction
2. Benefits
This Module will add the following items to Cloud Native Application Observability:
-
Enhanced observability: Gain a deeper understanding of your vSphere environment with comprehensive insights and observability data.
-
Proactive monitoring: Identify and address issues proactively, leveraging real-time metrics, logs, events, and traces.
-
Efficient troubleshooting: Quickly pinpoint the root cause of performance issues by establishing clear application dependencies and infrastructure links.
-
Optimal resource utilization: Optimize your VMware environment's performance by leveraging actionable insights derived from the vSphere Observability module.
-
Scalable and adaptable: Seamlessly scale and adapt to evolving infrastructure needs, supporting various deployment models across on-premises, cloud, and hybrid environments.
This user guide provides step-by-step instructions and details on how to get started with vSphere Observability module.
3. Pre-requisites
Following sections cover pre-requisites before you can start using the vSphere Observability module.
3.1 Account with Cisco FSO Platform
a) Create your Cisco FSO Platform workspace/tenant
You should have an existing account with Cisco FSO Platform. To create your workspace or tenant, visit this Cisco FSO page and follow the instructions to create your account.
b) Subscription to CloudFabrix vSphere Observability module in FSO Platform Exchange
You need to also subscribe to CloudFabrix vSphere Observability module in Cisco FSO Platform Exchange. You can do this using ‘fsoc’ command line utility or from the web UI (see instructions below)
1. Login to Observe portal https://your-tenant.observe.appdynamics.com
2. From left menu bar, click on the last icon “FSO Platform Exchange”
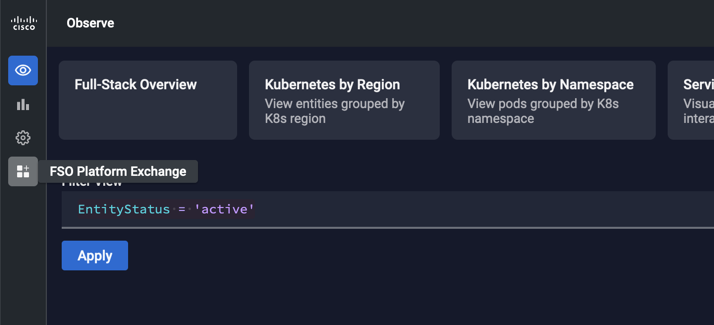
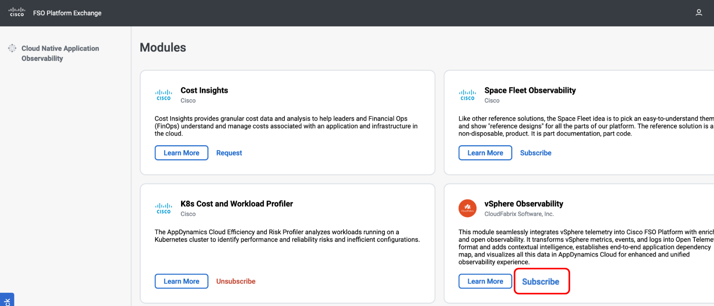
**3. ** Subscribe to vSphere Observability module
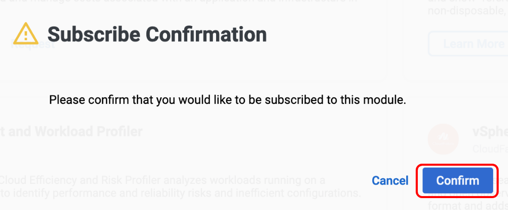
**4. Click Confirm on Subscribe Confirmation dialog
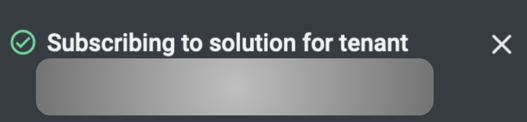
5. Close the notification dialog. You will see a notification dialog at the top right corner of the browser window. View and close the dialog. If you leave it alone, it will auto close after few seconds.
c) Get Service-Principal (API Key)
Access to Cisco FSO platform is provided through what is called a Service Principal, which is basically an API Key that carries all the information required for you to properly connect and authenticate to a Tenant in the FSO Platform. The FSO Platform offers a portal where you can easily create your Service Principal. Open a browser window and type https://accounts.appdynamics.com/ in the address bar.
Using the Cisco FSO Platform Accounts Portal you can generate a Service Principal file containing all the information needed to run fsoc commands successfully against this Tenant.
1. Login to https://accounts.appdynamics.com/
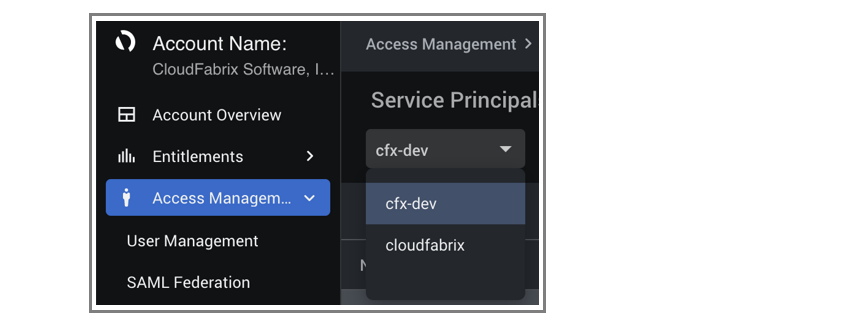
2. From the Left menu bar open Access Management > Service Principals
3. Select the relevant tenant (if your account has access to multiple tenants). In this example ‘cfx-dev’ tenant is selected
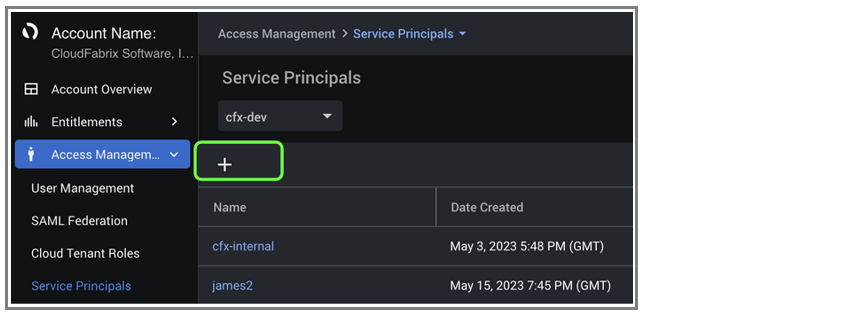
4. Create or use New Service Principal by clicking on ‘+’ button
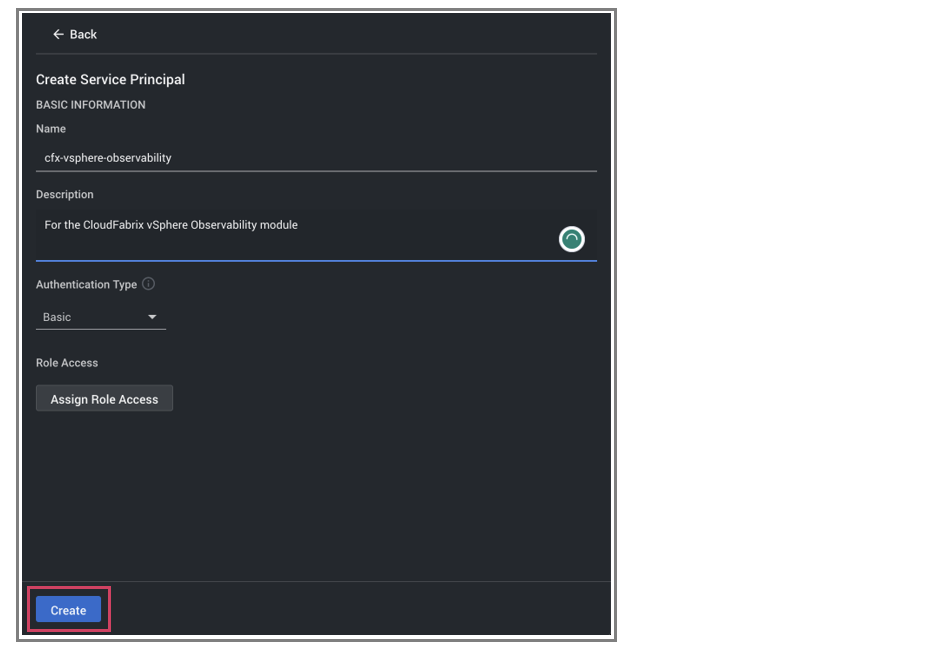
5. Provide following details in the Service Principal. Change name and description per your needs. Do not assign any Role and leave it blank. Click ‘Create’.
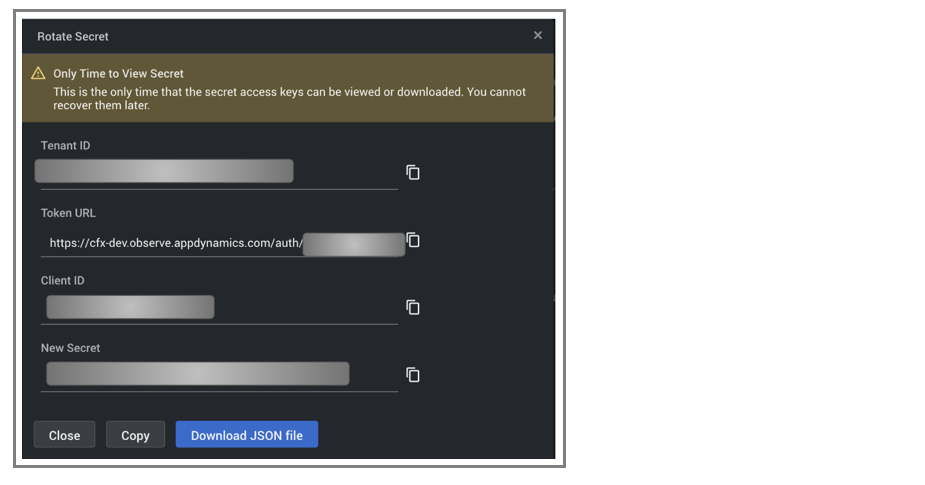
6. Download the JSON file. Default name will be secrets.json This is the only time the secret key is revealed and the file is available for download. Copy the Tenant ID and Client ID
Tip
Note : If you miss Step-6 by not downloading the secrets.json file, you have to re-create the principal again by following above steps.
c) Get Agent-Principal (API Key)
Agent-Principal is an API key that allows you to authenticate and exchange information with the APM and Kubernetes entities within the Cisco FSO platform, so that the appropriate linkage between the vSphere entities and APM/Kubernetes entities can be established.
Follow these steps to get Agent-Principal:
1. Login to Observe portal https://your-tenant.observe.appdynamics.com
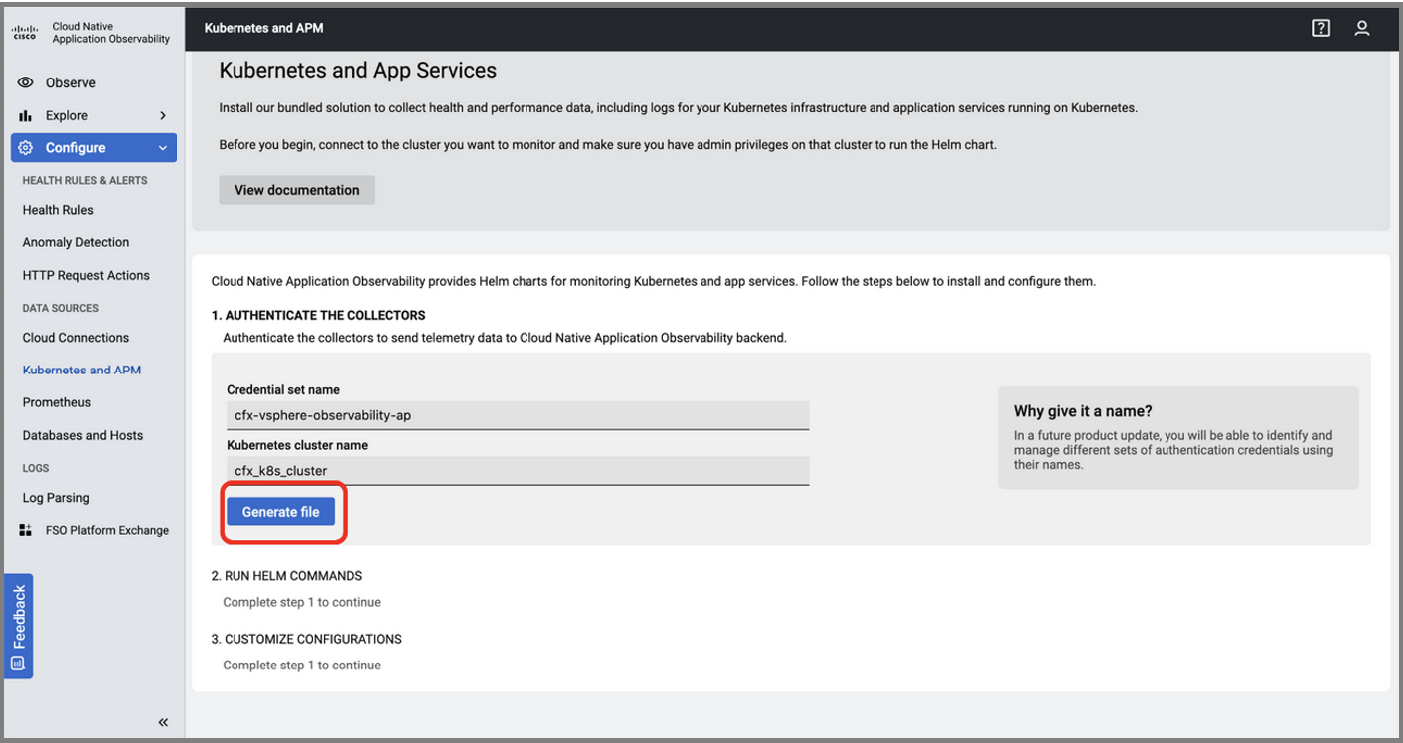
2. From left menu bar go to Configure > Kubernetes and APM
3. Give a name for the credential and provide the exact name of the Kubernetes cluster that is being monitored and click Generate file
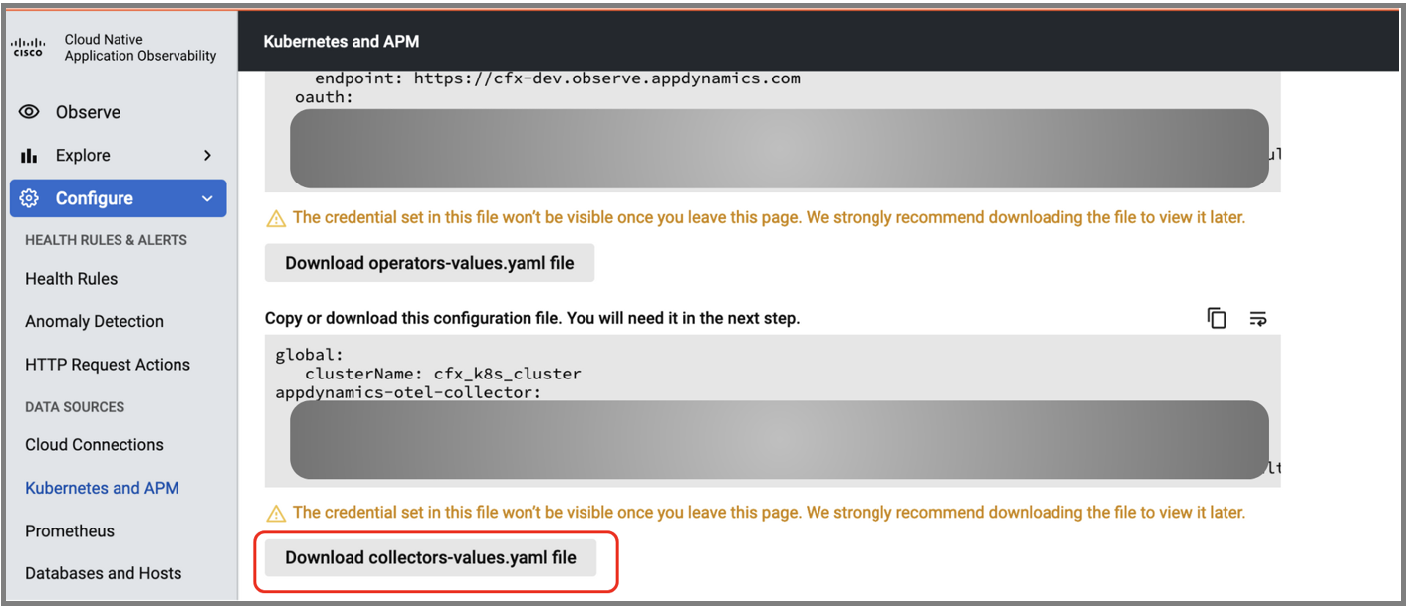
4. Download the collector-values.yaml file and keep it handy. You will need to specify this in CloudFabrix portal when creating the integration to FSO platform.
5. Ignore steps 2 and 3 click Done
3.2 Register with CloudFabrix
You need to also register with CloudFabrix by filling up this form: https://www.cloudfabrix.com/contact/
In the message section, please indicate “Signing up for Cisco FSO - vSphere Observability Module” and add any other context or questions you may have. CloudFabrix team will get in touch with you, if you have any questions or need help in getting started with the module.
4. Getting Started
4.1 Download and Install CloudFabrix RDA Edge
-
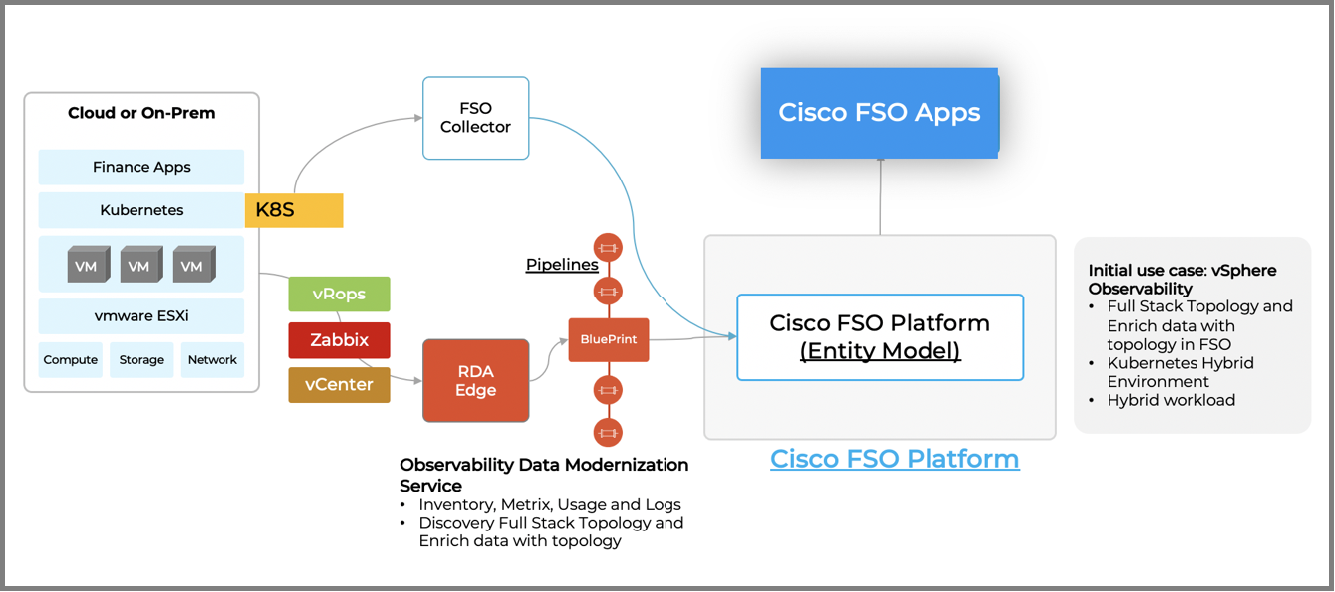
To use the vSphere Observability module, you need to install the CloudFabrix RDA Edge in the environment where you have access to vCenter and vROps, typically this will be your datacenter on-prem environment or your Cloud VPC account. RDA Edge is responsible for integrating with VMware environment, processing and enriching the data, converting to Open Telemetry, establishing all the dependency mappings and ingesting into Cisco FSO platform for visualization.
-
CloudFabrix RDA Edge is a Linux-based containerized application that can be deployed using docker-compose, Kubernetes or VMware OVF based installation.
-
Install RDA Edge in your datacenter or Cloud VPC account by following these instructions:
4.1.1 Prerequisite for OVF Deployment
1. vCenter access to deploy OVF
2. Deploy RDA Edge OVF
3. Login to deployed OVF via ssh or putty using default credentials and upgrade pip version using following command
4. Install rdafcli
pip install --user https://macaw-amer.s3.amazonaws.com/releases/rdaf-platform/1.1.8/rdafcli-1.1.8.tar.gz
5. logout and login to session
4.1.2 Run rdaf setup command to configure necessary settings for RDA Edge services
Run the below command to verify the rdaf CLI version
Run the below command to setup the system to install RDA Edge services.
Output should be similar to the following:
023-06-01 06:37:46,807 [rdaf.component.platform] INFO     - Creating default user...
2023-06-01 06:38:10,027 [rdaf.component.platform] INFO     - Retrying default user creation...1
2023-06-01 06:38:30,246 [rdaf.component.platform] INFO     - Retrying default user creation...2
2023-06-01 06:38:31,419 [rdaf.component.platform] INFO     - Created workspace:d4775754-bcb1-4f9a-b1f1-ebb863a8a364
2023-06-01 06:38:31,458 [rdaf.component.platform] INFO     -  UI can be accessed at - https://cloudfabrix.com with default user - admin@cfx.com
2023-06-01 06:38:31,458 [rdaf.cmd.edge_installer] INFO     - Installing worker components...
2023-06-01 06:38:31,528 [rdaf.component.worker] INFO     - Installing worker on host 192.168.0.1
4.1.3 Install Infra, Platform and Worker components using below commands
4.1.4 Deploy rdac cli
4.1.5 setup app-configure to aia
4.1.6 Restart resource-manager service
4.1.7 Configuration
- Login to UI by using the default credentials, reset the password, and login with updated password
4.1.8 Adding Organization, User Groups and Users
1. Add Organization
Home --> Administration --> Organization --> Add (Provide basic details) --> Save
2. Add User groups
Home --> Administration --> User Groups --> Add Group (Provide basic details) --> Select Role (MSP Administrator) --> Select Organizations (From Report) --> Add
3. Add User
Home --> Administration --> USERS --> Add User (Provide basic details) --> Select User Group --> Save
Login to the system using the new user and with a default password changeme (Note: You can reset once you login using changeme)
4.2 Authenticate CloudFabrix with Cisco FSO
-
Setup integration credentials using Service Principal and Agent Principal
-
Authenticate CloudFabrix with Cisco FSO Platform: Setup integration credentials using Service Principal and Agent Principal
-
Follow these steps to enter integration credentials that allows CloudFabrix to integrate with Cisco FSO platform.
1. Login to CloudFabrix portal https://your-cfx-rda-edge-ip-or-dns
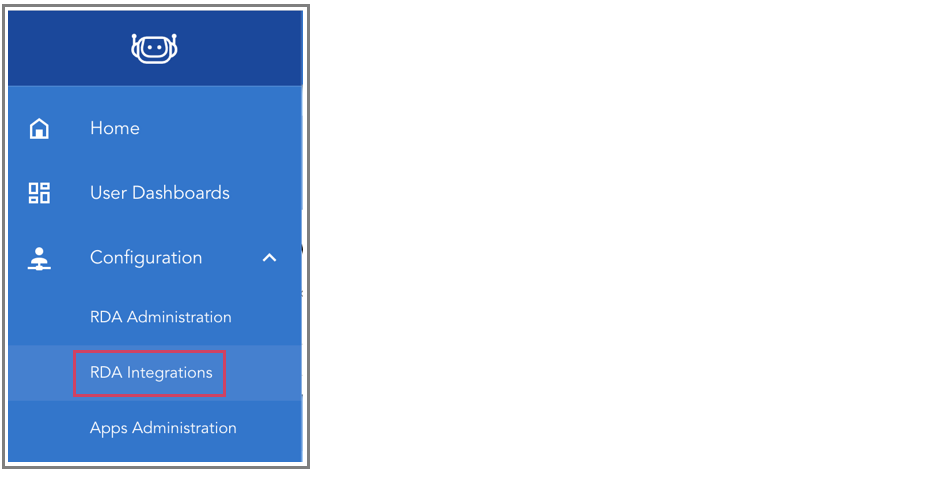
2. Go to left menu bar RDA Integrations
3. Go to Credentials and click on top right ‘Add’ button to add a new credential
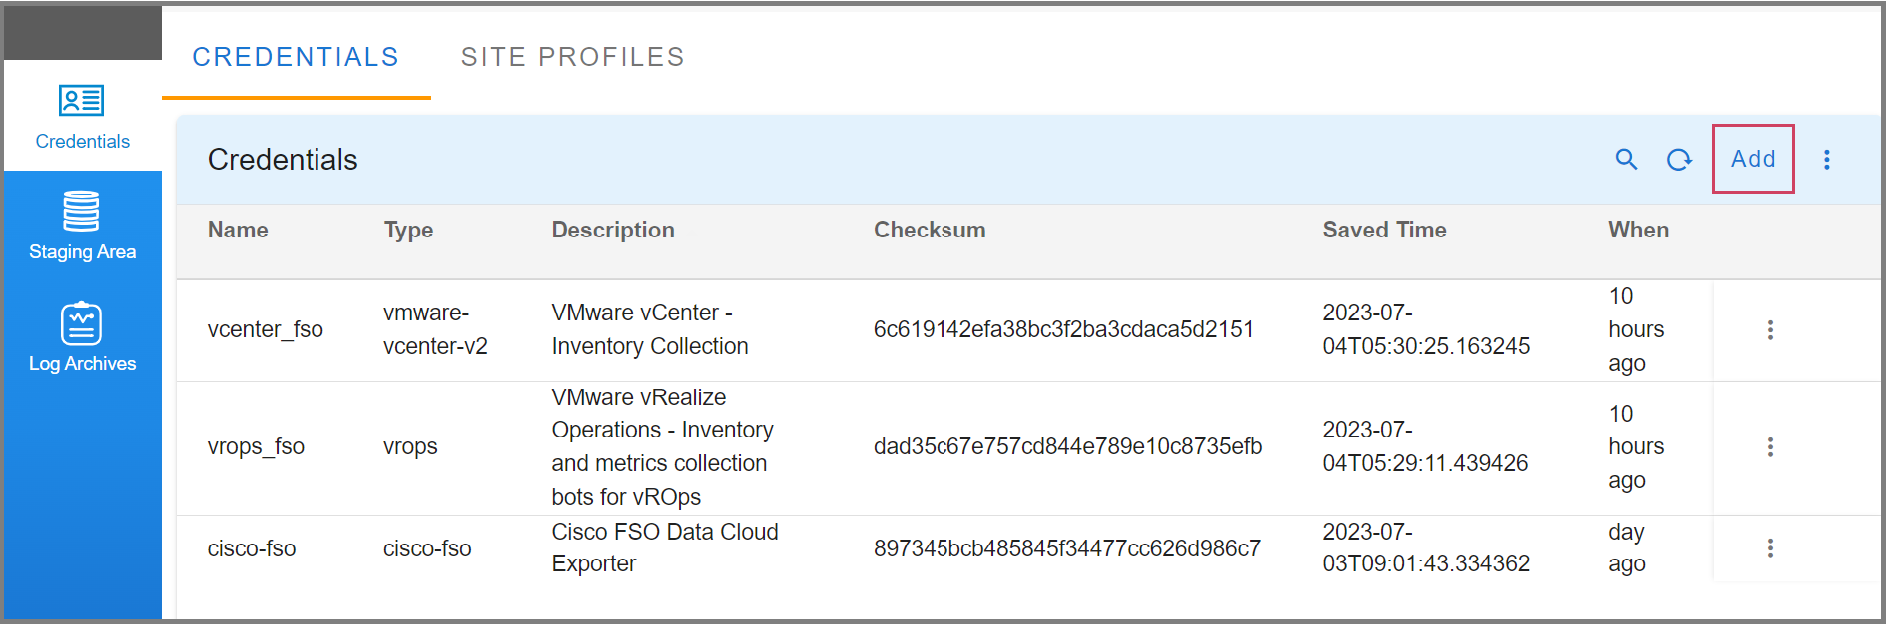
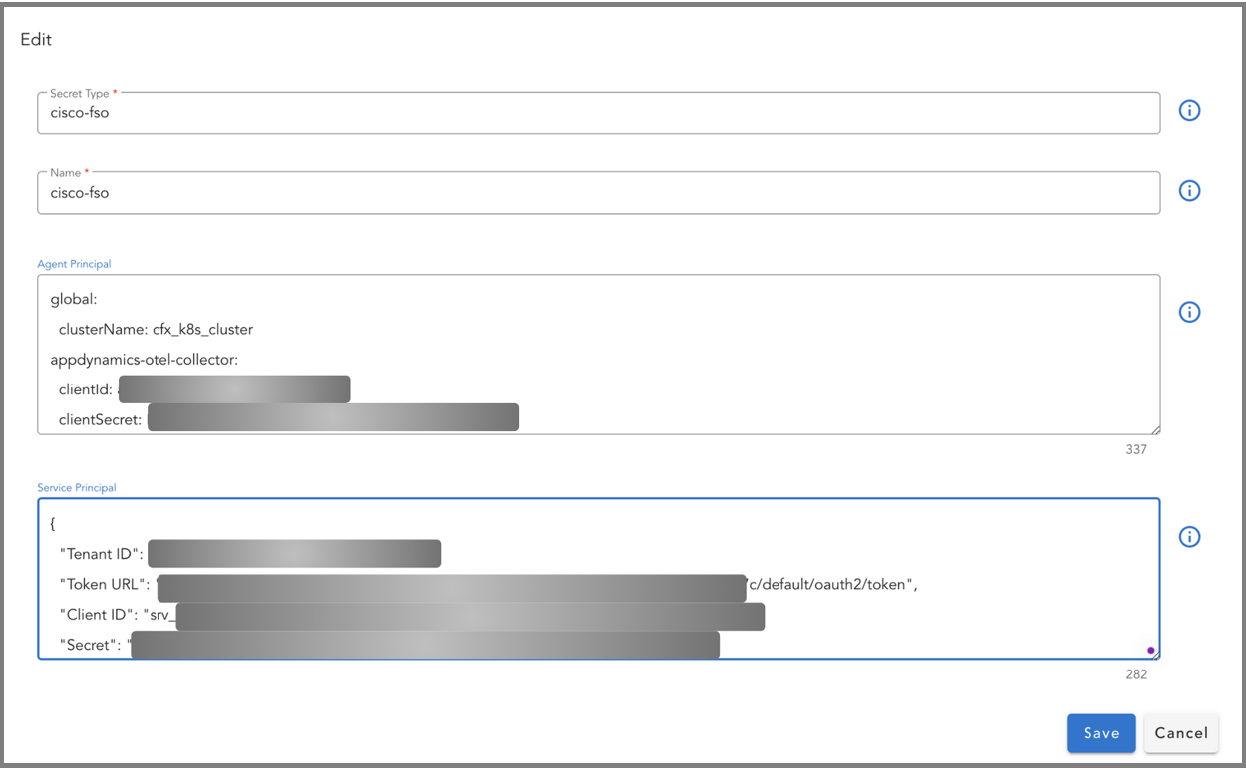
4. Add Secret-Type cisco-fso and name the credential exactly as cisco-fso
Note
The name must be cisco-fso, as this name will be used later in the pipelines to integrate with Cisco FSO Platform. If you use a different name for credential, you will have to update the pipeline or resolve the audit error during service blueprint instantation process
-
Copy the contents of
collectors-values.yamlfile (as explained in pre-reqs) and paste into the first text block which saysAgent Principal -
Copy the contents of
secrets.jsonfile (as explained in pre-reqs) and paste into the second text block which saysService Principal -
Click Save
4.3 Add vCenter, vROps credentials
For vSphere Observability module to collect data from VMware environment, module needs to have read-only API access to vCenter and vROps.
Following data will be collected from vCenter and vROps:
-
From vSphere: Environment details and logs/events are collected (1-hour interval - configurable)
-
From vROps: Timeseries metrics are collected (5-mins interval - configurable)
For VMware integration to work, add both vCenter and vROps credentials to CloudFabrix portal's Credentials section. This process of adding vCenter and vROps credential to CloudFabrix Portal will be similar to adding cisco-fso credential and is explained in the previous step.
Follow below steps to add vCenter and vRops credentials.
Note
Please specify name exactly as mentioned in the following instructions, otherwise you will have to manually resolve the audit error during service instantiation
1. Login to CloudFabrix portal https://your-cfx-rda-edge-ip-or-dns
2. Go to left menu bar RDA Integrations
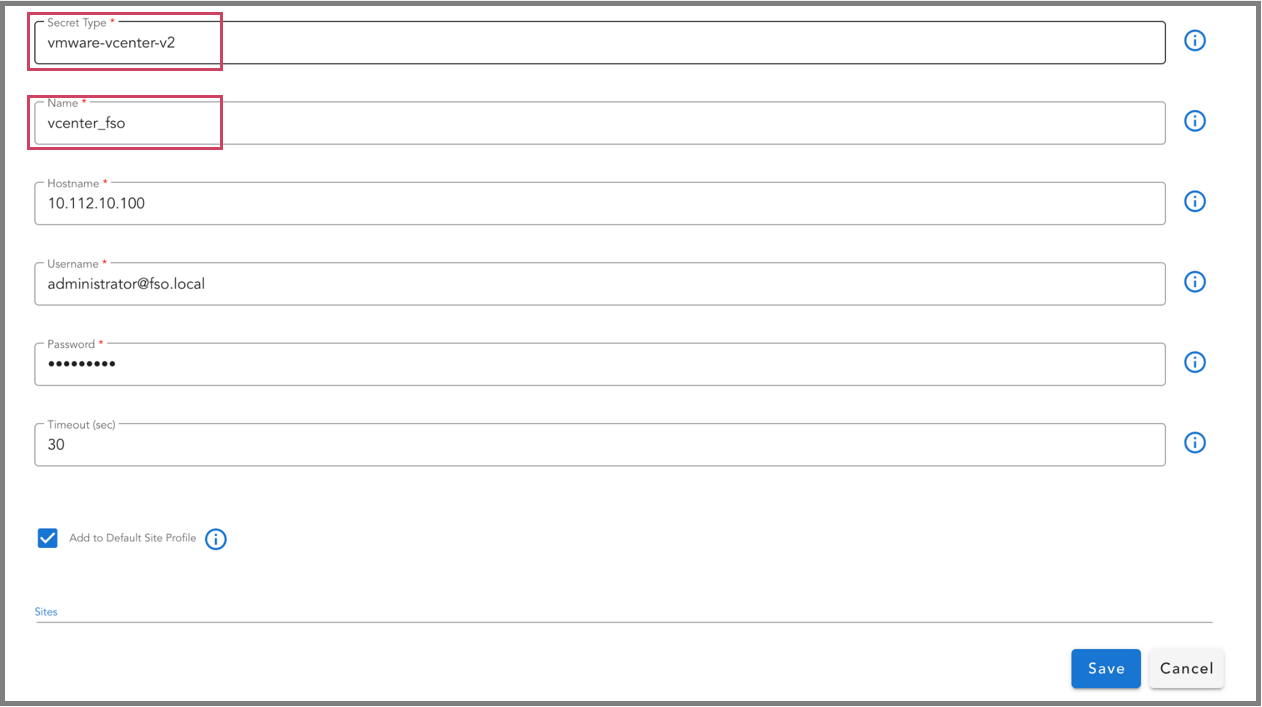
3. Add vCenter credentials
-
Secret-Type: vmware-vcenter-v2
-
Name: vcenter_fso
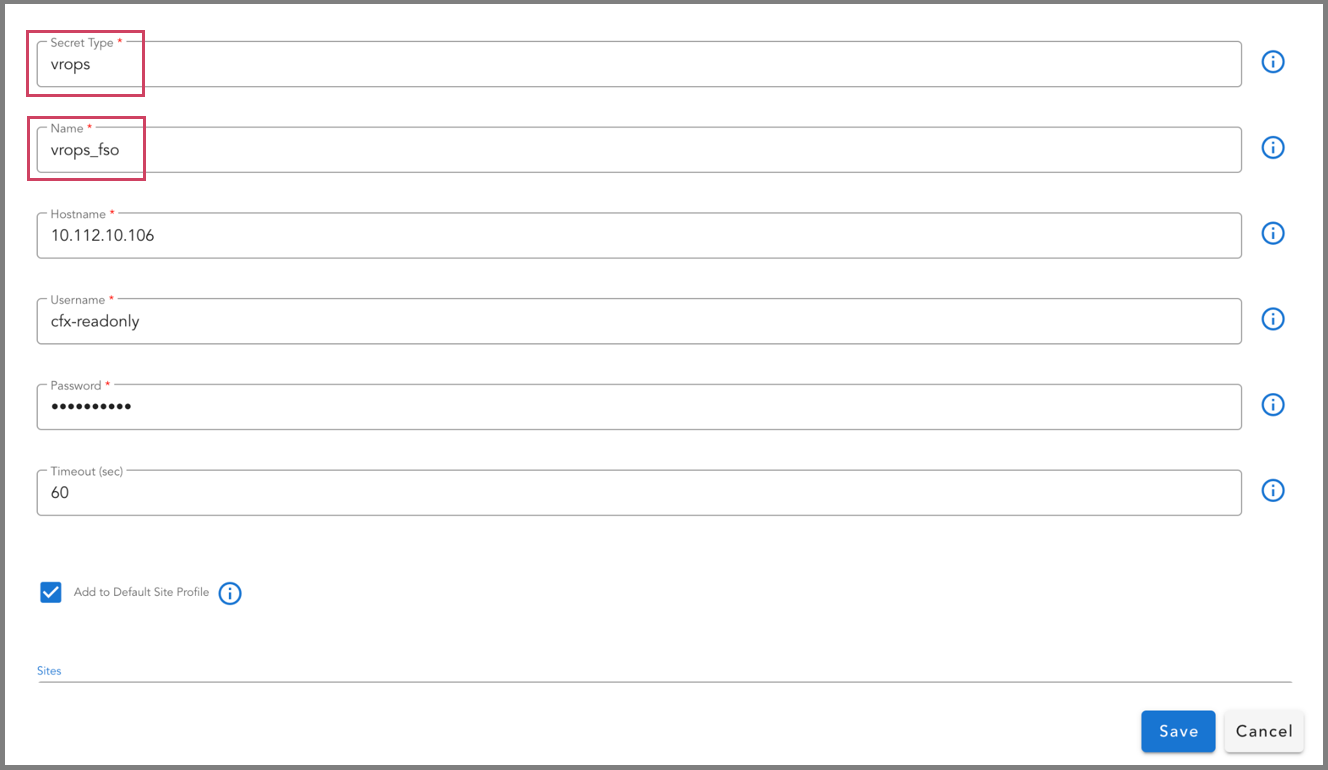
4. Add vROps credentials
-
Secret-Type: vrops
-
Name: vrops_fso
4.4 Add/Import the vSphere Observability Bundle to start data collection and processing
Now that we have configured all the required credentials to integrate with the VMware environment and Cisco FSO Platform, the next step is to import the vSphere Observability bundle into CloudFabrix portal. This bundle is a self-contained package consisting of all the necessary artifacts/components (like services, pipelines, data artifacts and dashboards) for proper functioning of vSphere Observability module.
Follow below steps to import the vSphere Observability bundle into the module:
1. Login to CloudFabrix portal https://your-cfx-rda-edge-ip-or-dns
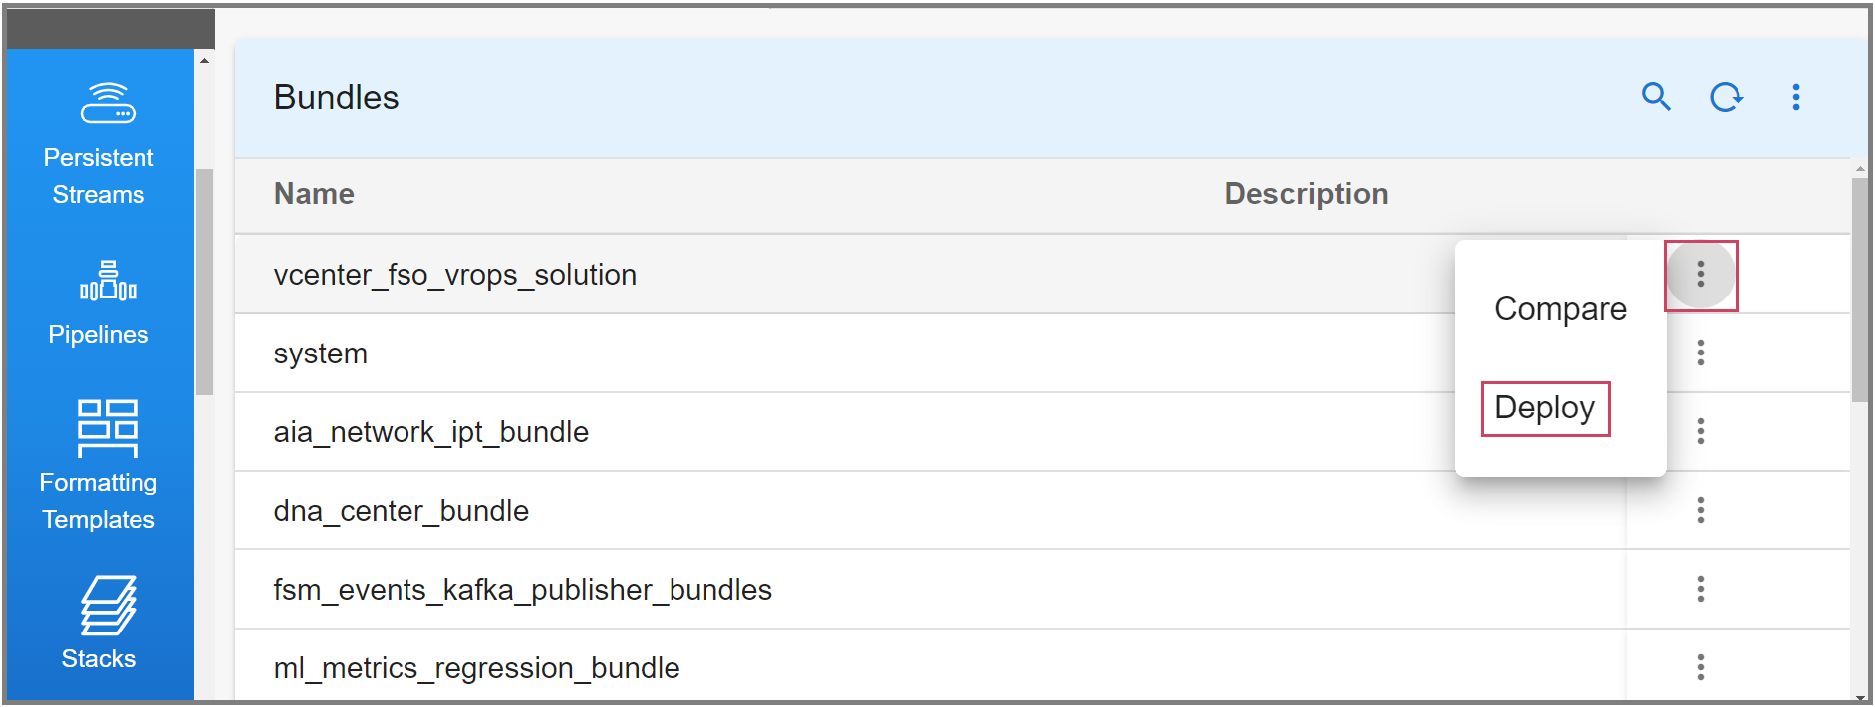
2. Deploy bundles: Once you login to main CloudFabrix Portal, use the following path to select and deploy required bundles (as shown in the following screen capture)
Go to left Menu Bar --> Home --> Configuration --> RDA Administration --> Bundles
Note
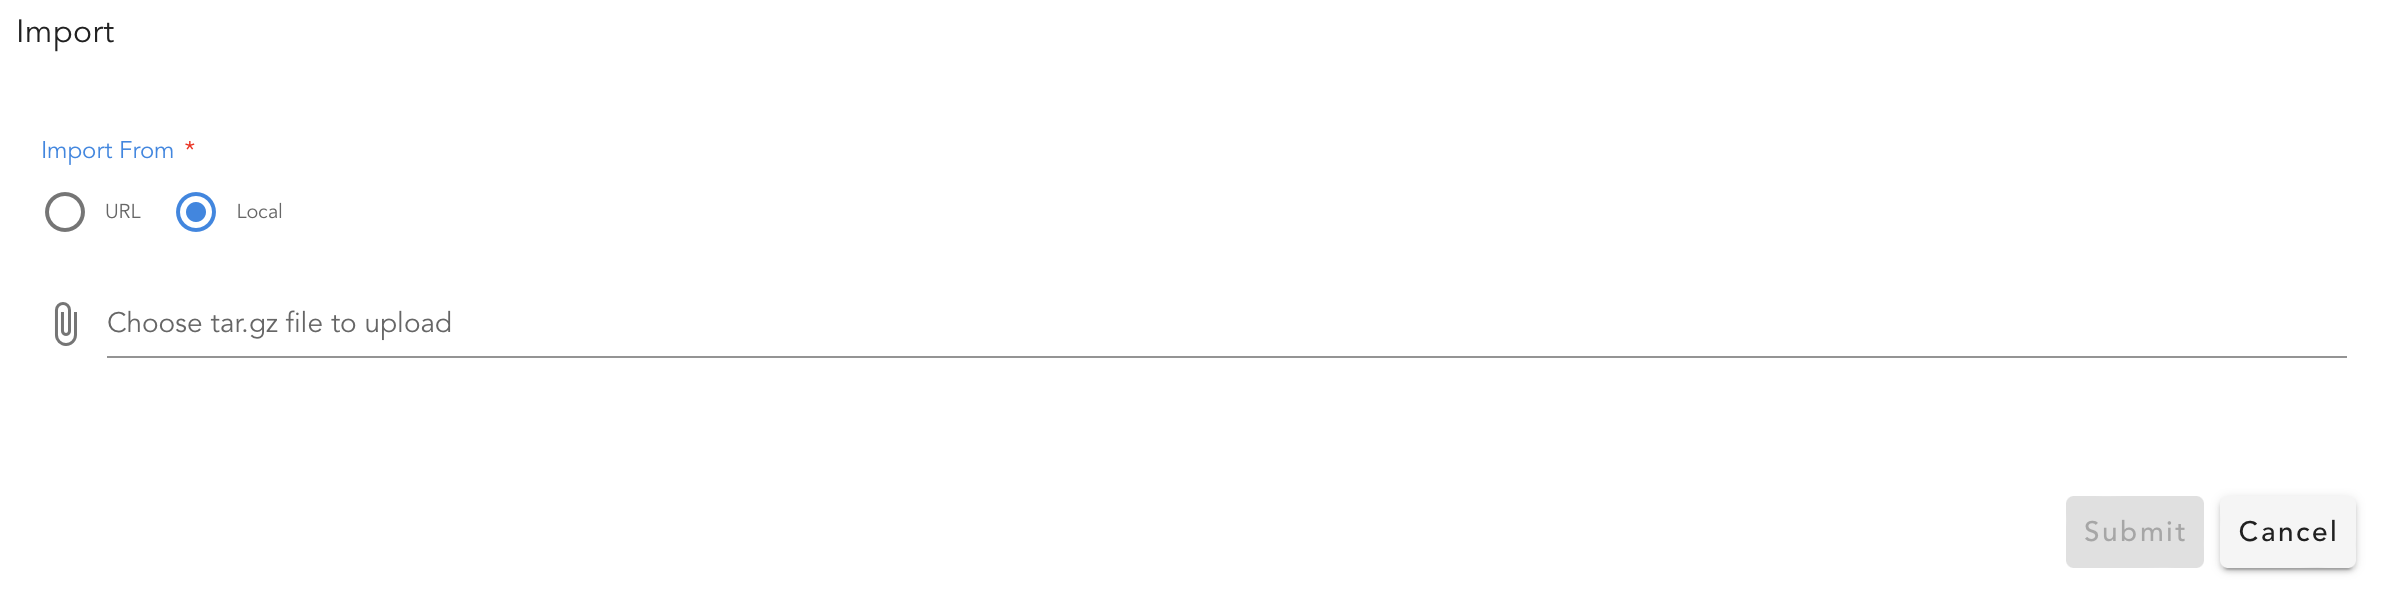
Bundles can also be added from local computer drive as well as from the URL shown in the following screenshots
Importing bundles using URL:
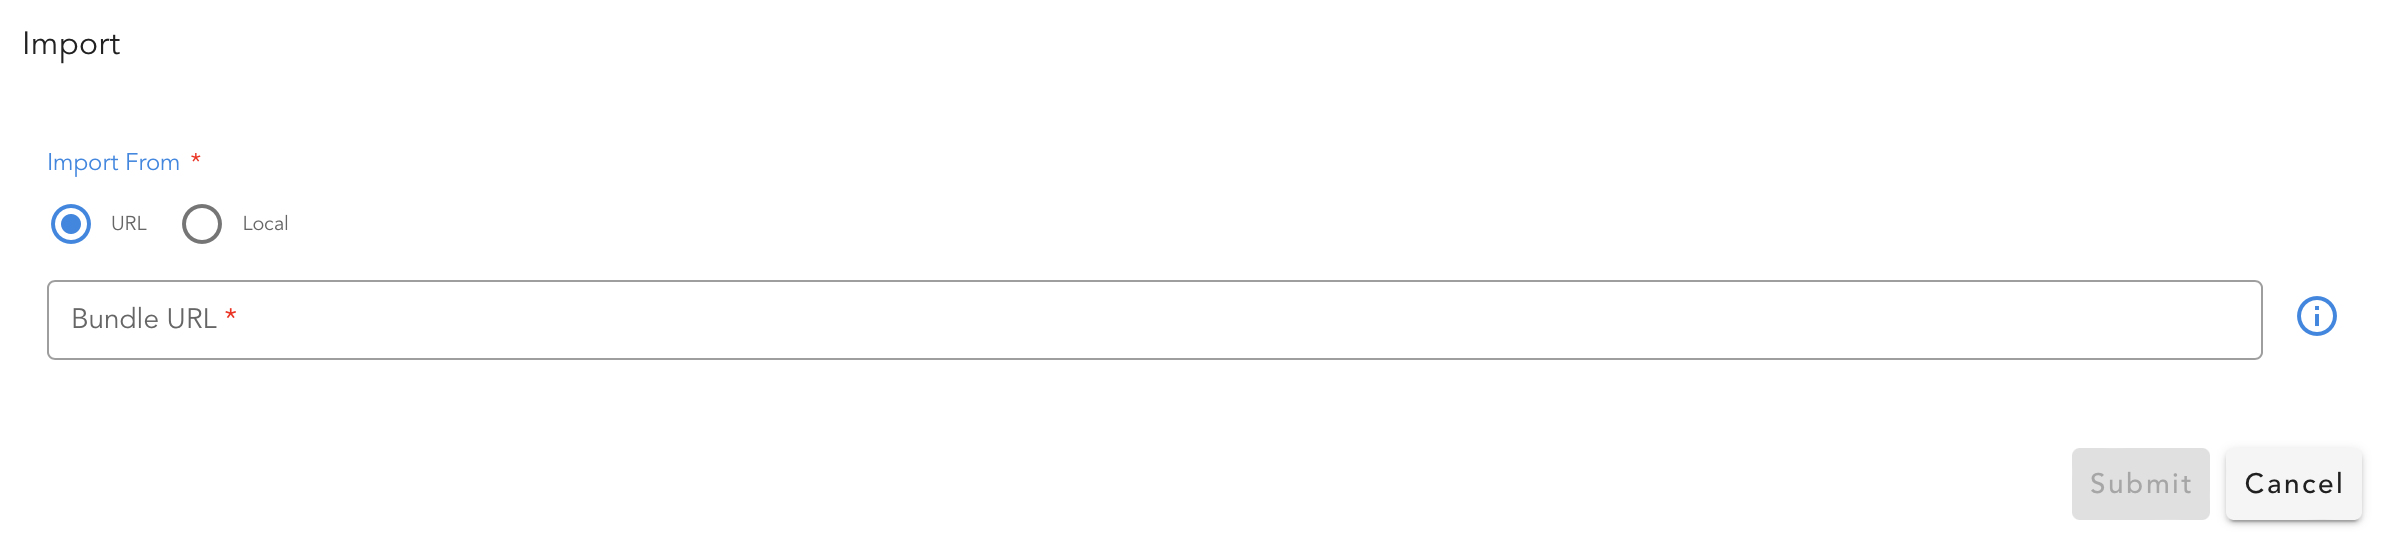
Importing bundles using local filesystem:
Deploying bundles :
3. Deploy Service Blueprints: Once you login to main CloudFabrix Portal, use the following path to select, deploy and enable required Service Blueprint (Cisco_FSO_vCenter_vROPS_Solution - as shown in the following screen capture)
Before enabling the Blueprints, run cisco_fso_metric_mappings_dataset_create_pipeline (using the steps shown in the following screen capture)
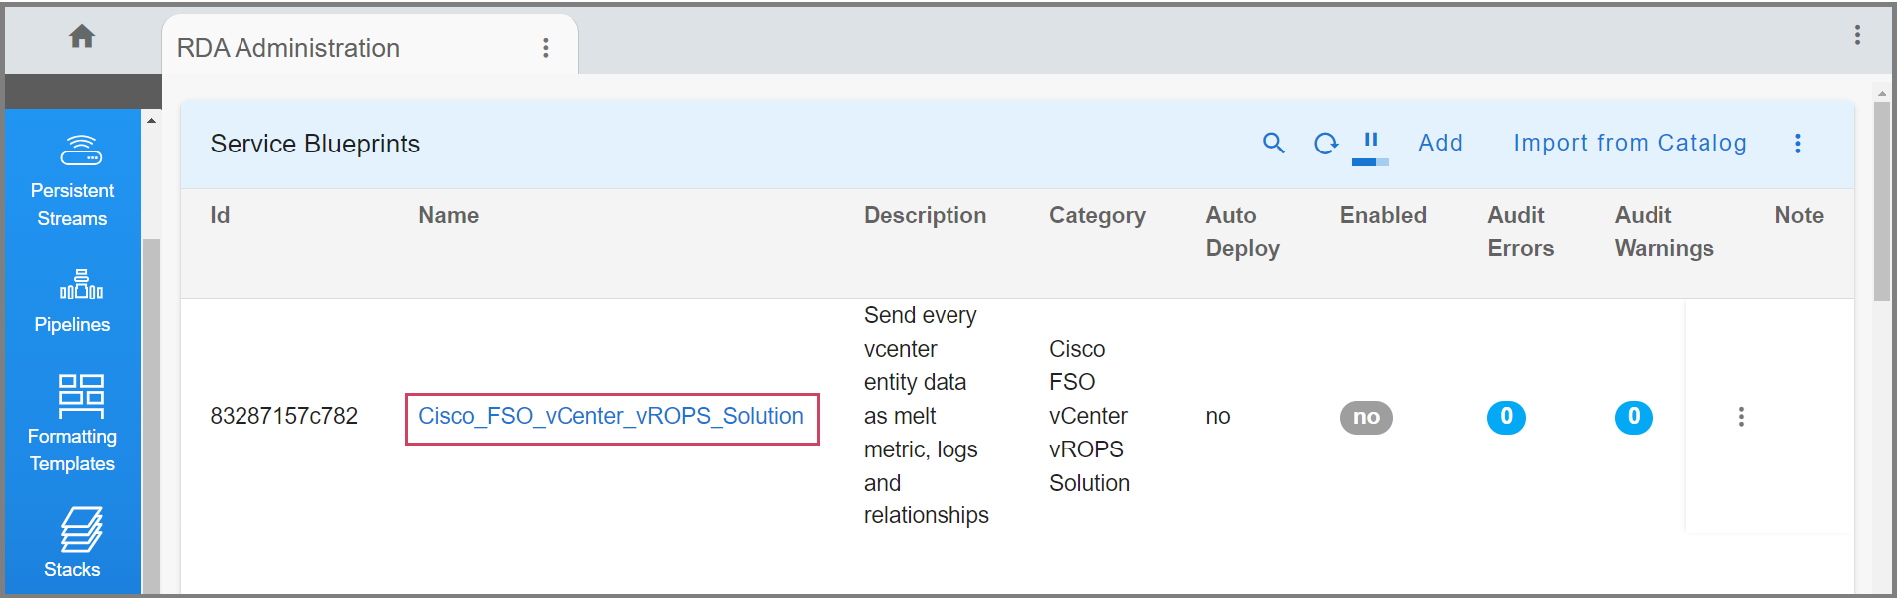
Go to Home Page --> Configuration --> RDA Administration --> Service Blueprints
Step 1. Search for 'Cisco_FSO_vCenter_vROPS_Solution'. This search will result a line item as shown in the following screen shot 'Fig (a)'
Step 2: Click on the link 'Cisco_FSO_vCenter_vROPS_Solution'. Once you click on 'Cisco_FSO_vCenter_vROPS_Solution', UI displays the 'Cisco_FSO_vCenter_vROPS_Solution' UI page as shown in the following screen shot 'Fig (b)'
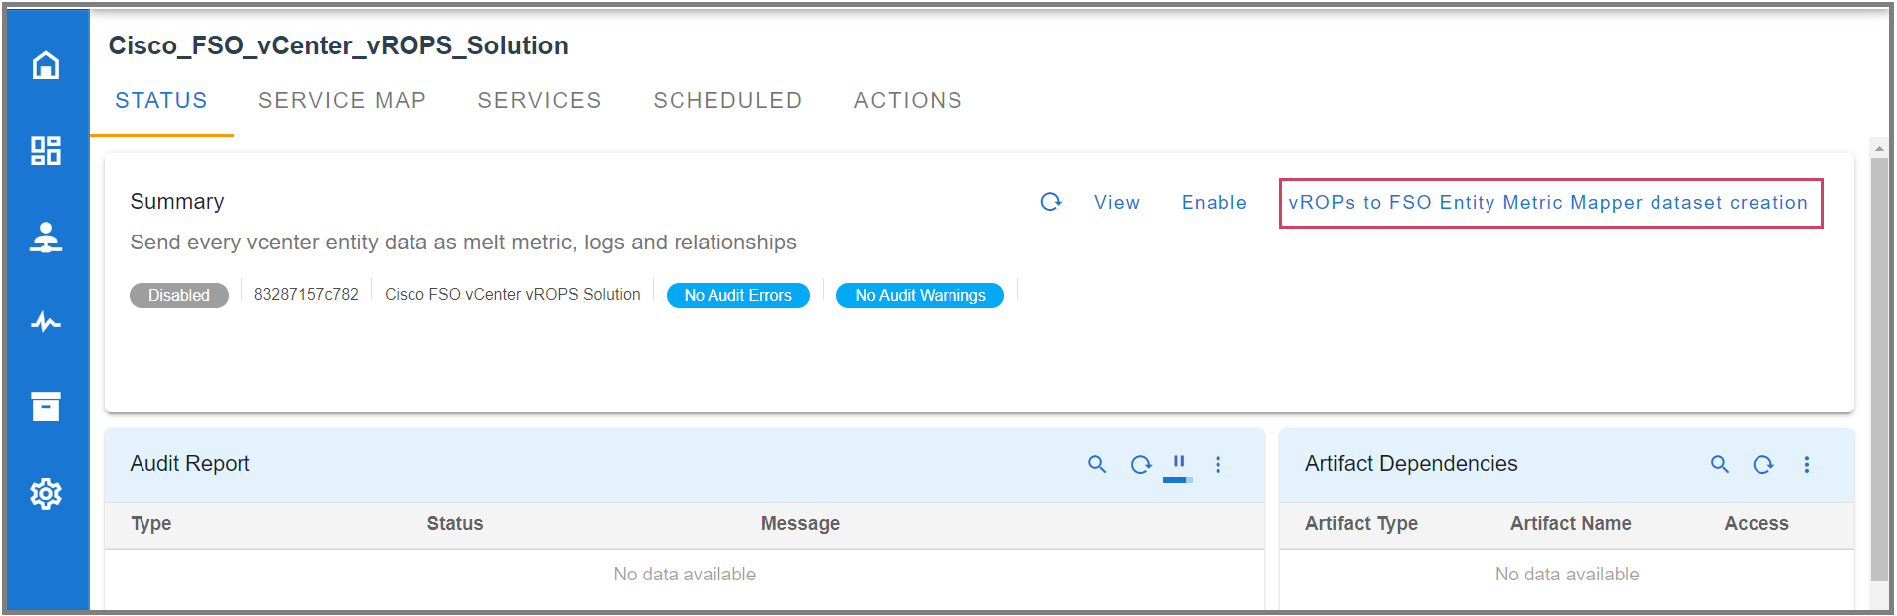
Step 3: Click on the link 'vROPs to Entity Metric Mapper dataset creation' link as shown in the above screen shot 'Fig (b)'.
Step 4: Once you click 'vROPs to Entity Metric Mapper dataset creation' link, UI will take you to the following screen 'Fig (c)'.
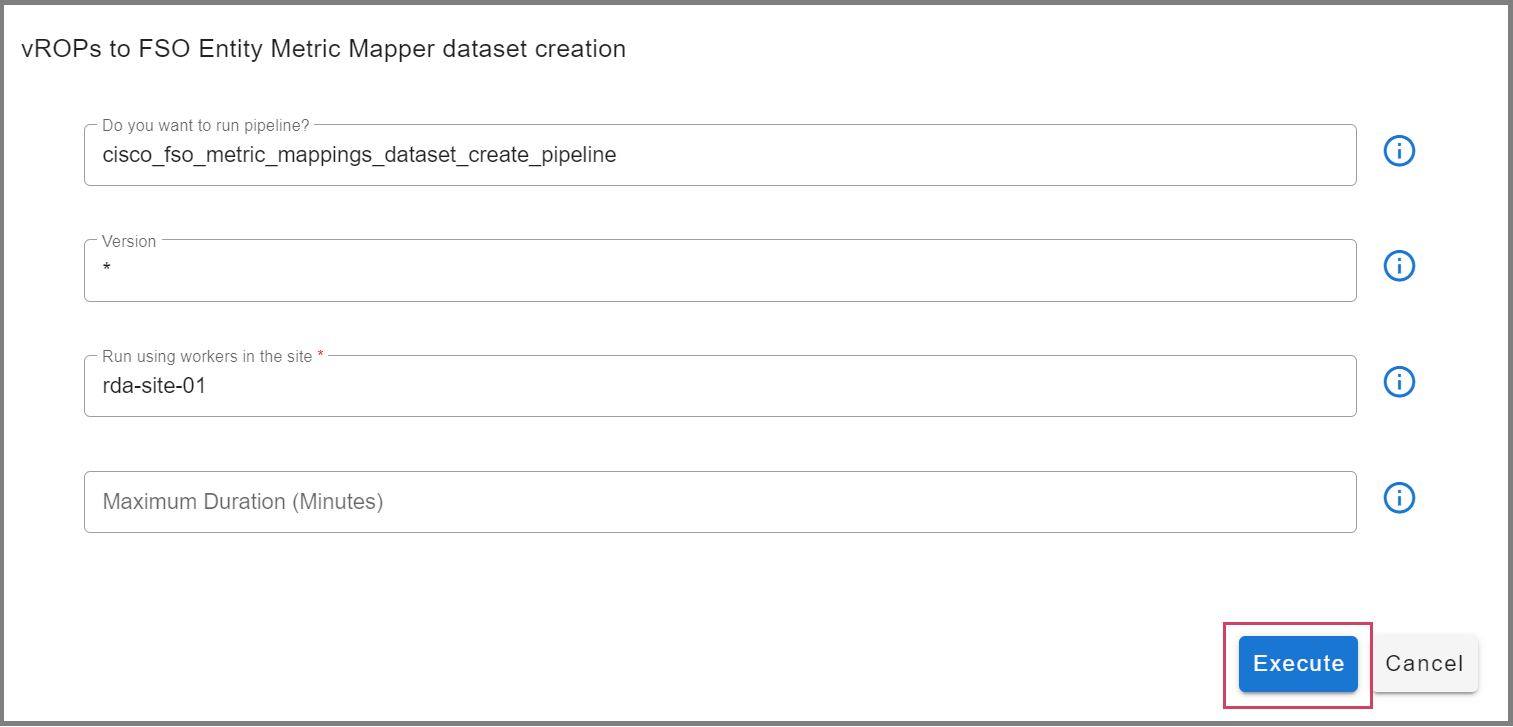
Step 5: Now from the UI shown in 'Fig (c), Click or Select 'Execute' button as shown in 'Fig (c)'.
Step 6: Step 5 will take you to UI 'Cisco_FSO_vCenter_vROPS_Solution' Page as shown in 'Fig (d)' which takes to default 'STATUS' tab on this UI page. Goto tab 'ACTIONS' as shown the below screen shot 'Fig (d)'
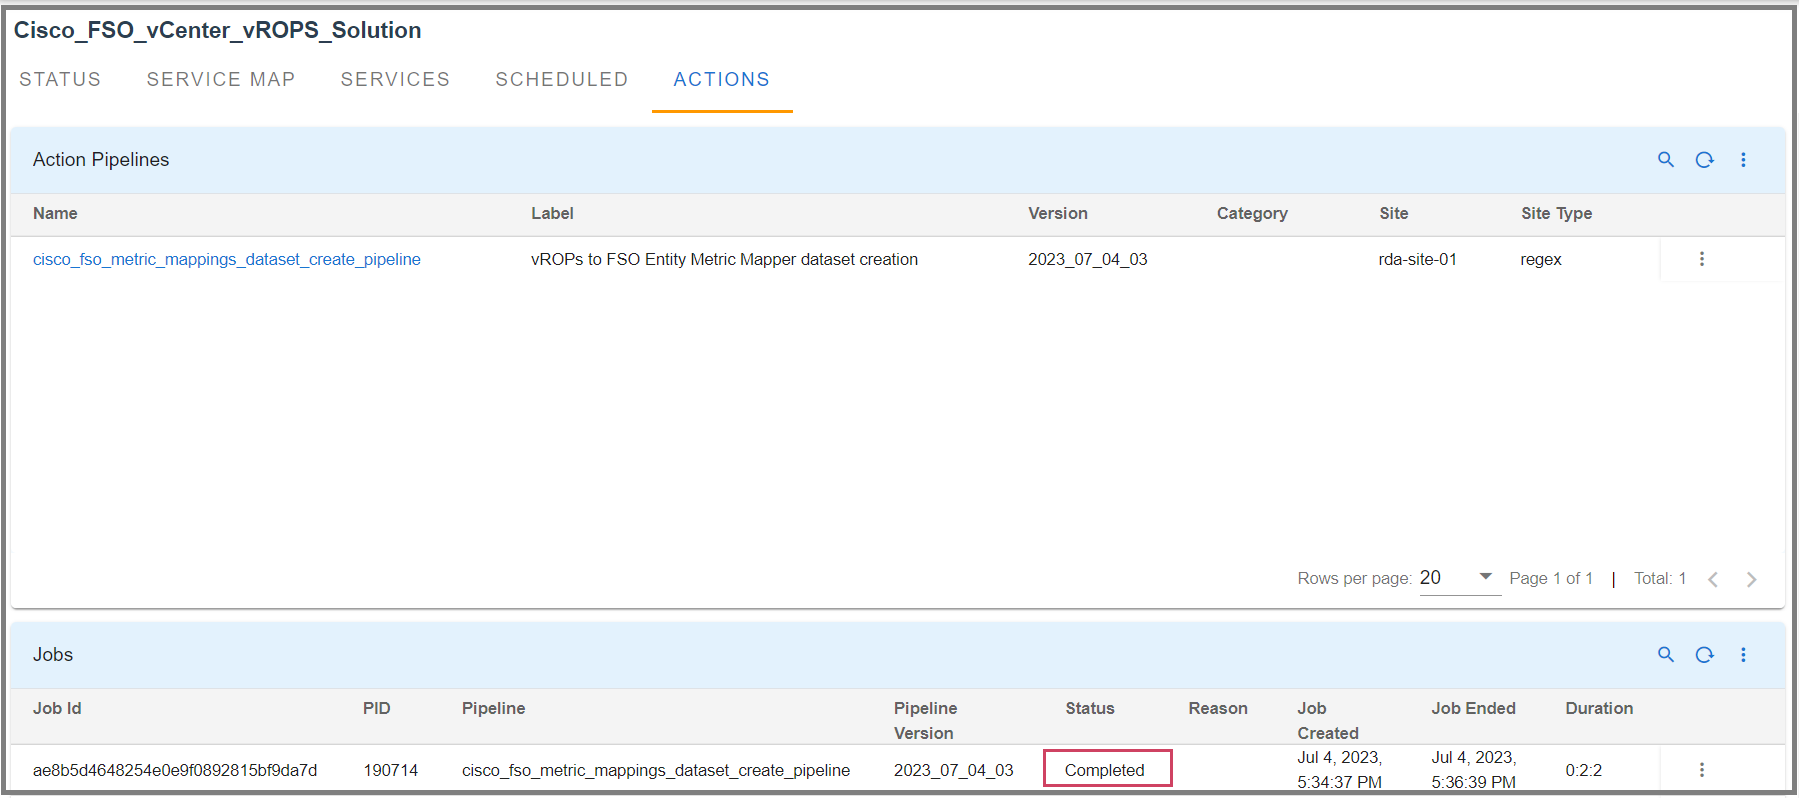
Step 7: Search for 'cisco_fso_metric_mappings_dataset_create_pipeline' under Jobs tabular report and check its status as shown in screen shot 'Fig (d)'
Note
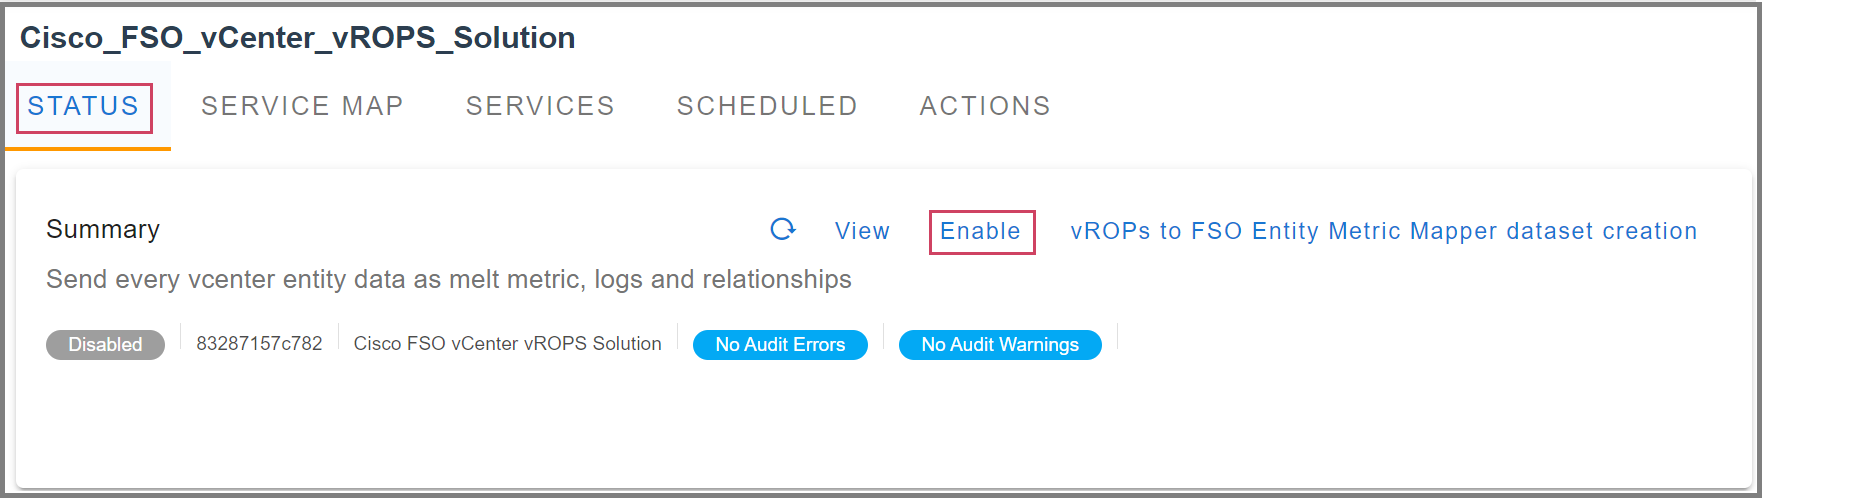
Only after cisco_fso_metric_mappings_dataset_create_pipeline status shows "completed" as shown above in the Screenshot, Then "Enable" Cisco_FSO_vCenter_vROPS_Solution as shown below in the Screenshot 'Fig (d)'
Step 8: Enable 'Cisco_FSO_vCenter_vROPS_Solution' from the 'STATUS' tab as shown in following screen shot 'Fig (e')
4.5 View Analytics in CloudFabrix Portal
Now the CloudFabrix portal is able to connect to VMware environment, discover and map relationships between nodes, collect metrics & events data, convert to Otel, and ingest into FSO Platform.
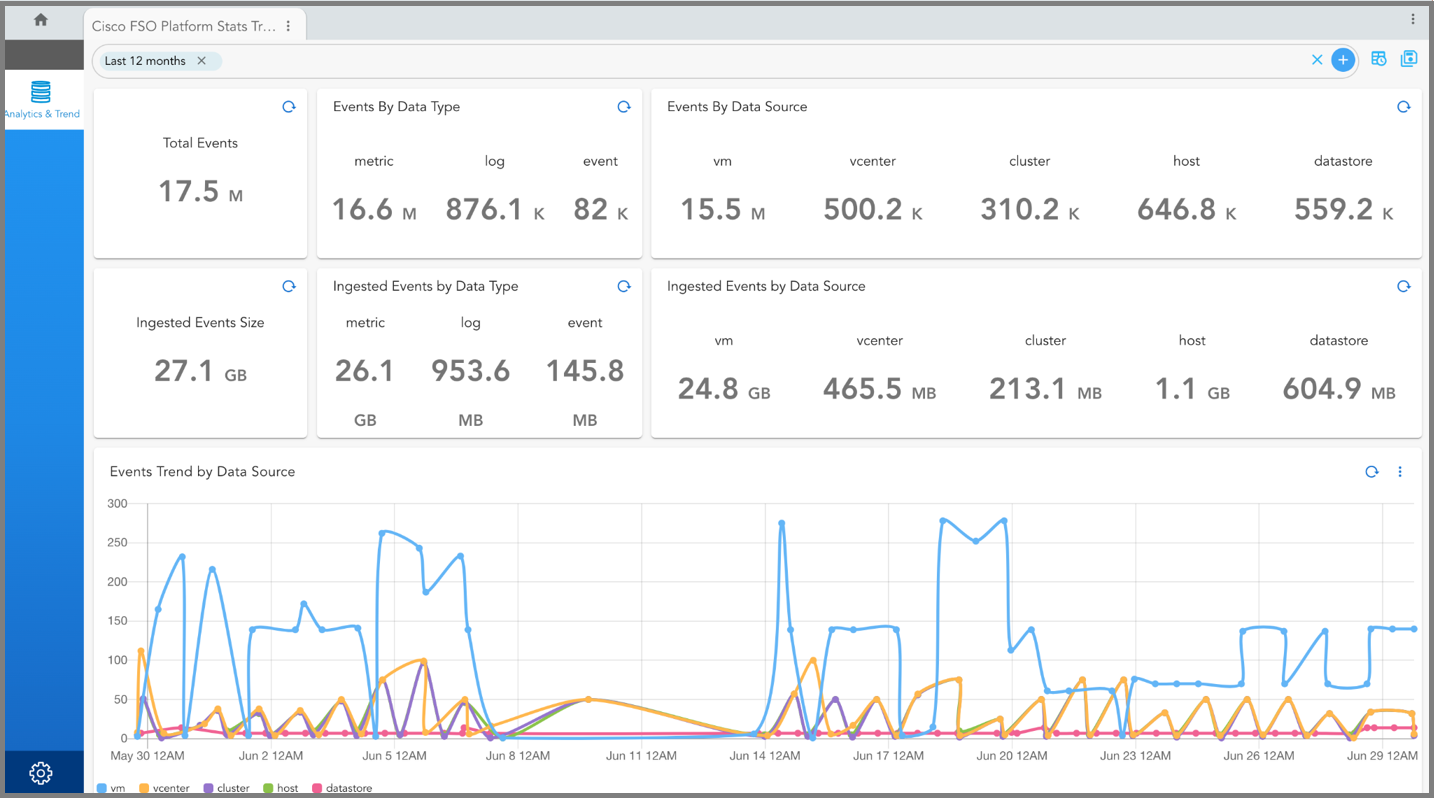
You should be able to see the data collection and ingestion progress in CloudFabrix dashboard that shows key insights like Total Ingested Metrics, Total Ingested Events, Events by Source, Metrics by Source, Metrics by Name, Event Flow Graph, etc.
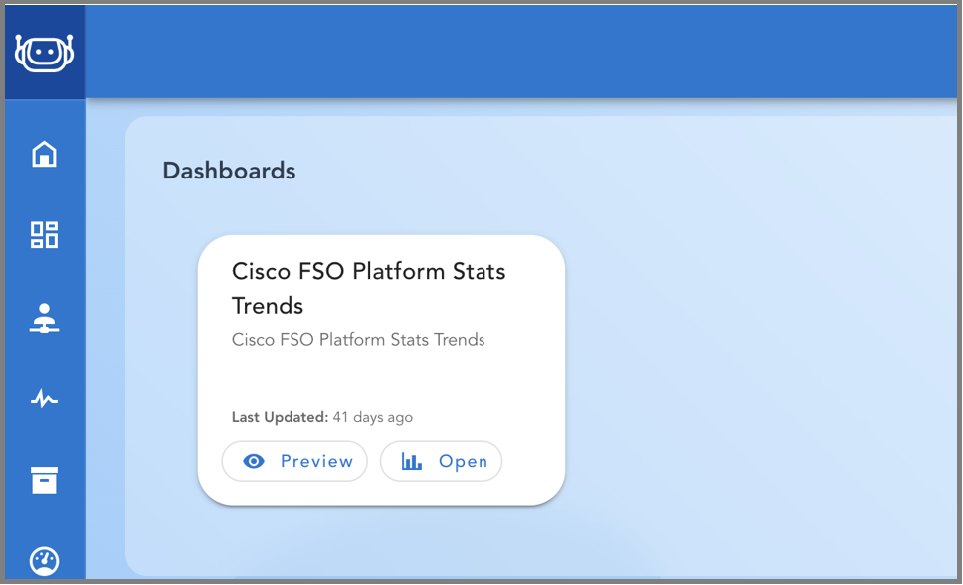
1. Go to Homepage --> Configuration --> RDA Administration --> Dashboards search for cisco_fso_platform_stats_trends click on it
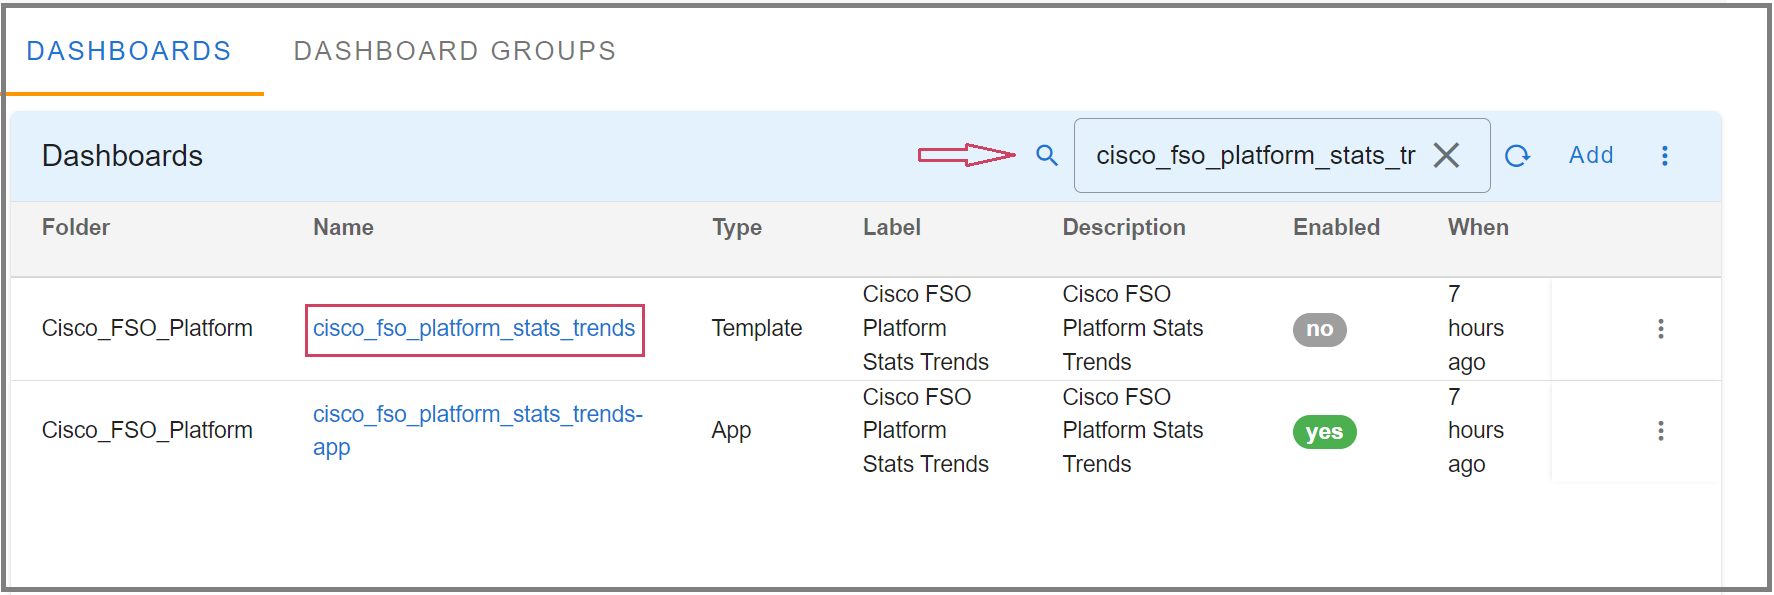
2. You will see content similar to the following captured screen shot:
4.6 View vSphere Observability Data in FSO AppDynamics Portal
Now you can login to AppDynamics portal and see the data for vSphere environment alongside your Applications and Microservices namespace. For detailed instructions on how to use Cisco FSO Platform Portal, please refer to Cisco FSO Platform documentation. This document provides couple of entry points or key visualizations where you can view the newly ingested data.
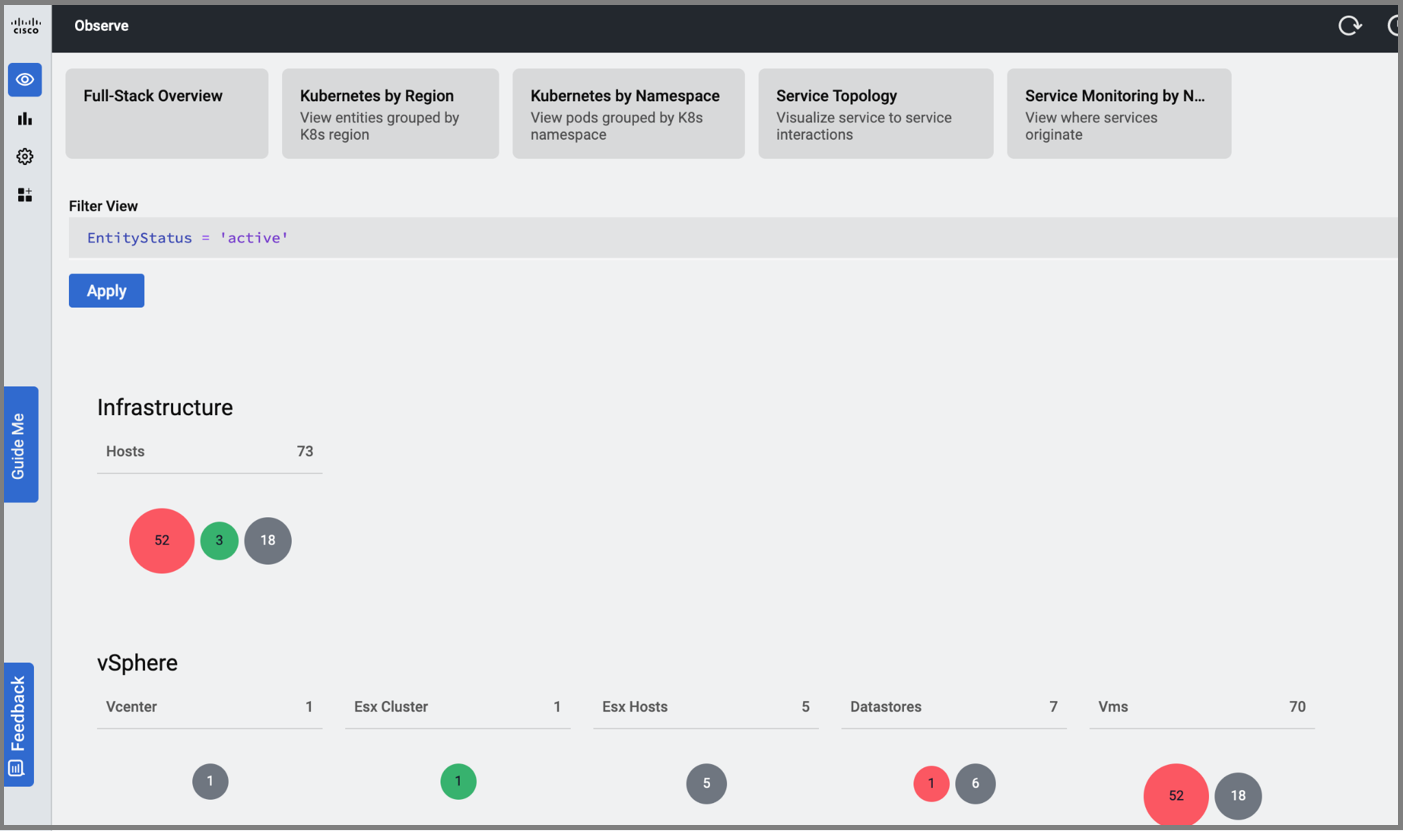
1. Login to your AppDynamics Observe portal Login to Observe portal https://your-tenant.observe.appdynamics.com
2. vSphere Observability: From Left Menu Bar, click on the first item Observe and scroll down all the way to the bottom of the page to see vSphere observability data
Troubleshooting
For help and support, please open a ticket in CloudFabrix Support portal